

Abstract
The primary objective of this investigation was to determine whether 2H2O and phenylalanine (Phe) flooding dose methods yield comparable fractional rates of protein synthesis (FSR) in skeletal muscle following a single bout of high-intensity resistance exercise (RE). Sprague-Dawley rats were assigned by body mass to either 4-h control (CON 4 h; n = 6), 4-h resistance exercise (RE 4 h; n = 6), 24-h control (CON 24 h; n = 6), or 24-h resistance exercise (RE 24 h; n = 6). The RE groups were operantly conditioned to engage in a single bout of high-intensity, “squat-like” RE. All rats were given an intraperitoneal injection of 99.9% 2H2O and provided 4.0% 2H2O drinking water for either 24 (n = 12) or 4 h (n = 12) prior to receiving a flooding dose of l-[2,3,4,5,6-3H]Phe 16 h post-RE. Neither method detected an effect of RE on FSR in the mixed gastrocnemius, plantaris, or soleus muscle. Aside from the qualitative similarities between methods, the 4-h 2H2O FSR measurements, when expressed in percent per hour, were quantitatively greater than the 24-h 2H2O and Phe flooding in all muscles (P < 0.001), and the 24-h 2H2O was greater than the Phe flooding dose in the mixed gastrocnemius and plantaris (P < 0.05). In contrast, the actual percentage of newly synthesized protein was significantly higher in the 24- vs. 4-h 2H2O and Phe flooding dose groups (P < 0.001). These results suggest that the methodologies provide “qualitatively” similar results when a perturbation such as RE is studied. However, due to potential quantitative differences between methods, the experimental question should determine what approach should be used.
Keywords: fractional rates of protein synthesis, skeletal muscle
tracers have been used to study whole body and tissue-specific protein synthesis under various conditions (i.e., postabsorptive, postprandial, disease, and exercise) for more than 35 years. Questions are addressed using either “stochastic methods” (which measure the dilution/excretion of a carbon- or a nitrogen-labeled amino acid) or “direct incorporation methods” (which compare the labeling of a protein-bound amino acid against the labeling of the amino acid precursor). Direct incorporation methods (i.e., precursor-product labeling ratios) are generally accepted as yielding reliable measurements of protein synthesis in specific proteins. Since skeletal muscle accounts for ∼60% of total body protein (37) and plays a pivotal role in health and the pathology of many chronic diseases, direct examination of this protein pool is of great interest to researchers.
The use of the continuous infusion method with either [13C]leucine or [13C]-, [15N]-, or [2H]phenylalanine (Phe) is common but requires adequate time to achieve a steady state in precursor enrichment (38) and substantial incorporation into newly made protein. In addition, uncertainty regarding the measurement of the true precursor pool (which is assumed to be the tRNA-bound amino acid) exists. However, since the tRNA-bound pool of amino acids is relatively small and is expected to have a high turnover, investigators have proposed various surrogates (intracellular or plasma), e.g., α-ketoisocaproate labeling, as markers of intracellular leucine labeling.
An alternative to the continuous infusion is the flooding dose (Phe). The principle is that, by providing a large bolus that contains a mixture of labeled and unlabeled amino acids over a short period of time (seconds to minutes), there will be a saturation of the uptake of the amino acid by a tissue(s) and therein a minimization of labeling gradients between plasma and tRNA-bound amino acids, thus making amino acid labeling in the plasma pool appropriate to use as the precursor (8, 19). An advantage of the flooding dose method is that it allows measurements over short periods of time (10 min in animals and 90 min in humans). However, the primary concern regarding the flooding dose centers on the physiological perturbation that occurs. Therefore, one must consider whether the increase in the pool size of the tracee alters the metabolism under investigation. In support of this, Jahoor et al. (21) and Smith et al. (31) have observed increases in muscle protein synthesis when using the flooding dose (with essential amino acids) in dogs and humans, respectively; however, Garlick et al. (19) did not find a stimulatory effect when flooding with Phe in rats. Although the differences may be explained by the species used, the possibility that supraphysiological concentrations of essential amino acids stimulate muscle protein synthesis warrants consideration.
These methods are faced with major challenges when the aim is to study protein synthesis under perturbed conditions. For example, nutrient ingestion can dilute the tracer and therein influence assumptions regarding precursor labeling. The use of 2H2O (a “primed infusion method”) minimizes precursor-labeling gradients, since cells are labeled from the inside via transaminase reactions (Fig. 1) (24). Since cells readily produce alanine, its labeling should reflect that of body water under many conditions (11, 28), especially since alanine undergoes rapid turnover, even in the fed state. Thus, one can compare the precursor labeling (body water) with either the 2H labeling of the α-hydrogen or total 2H labeling of protein-bound alanine divided by “n”, the number of incorporated deuteriums, which we have found to be 3.7 (a factor that is consistent with isotope effects on enzyme-catalyzed reactions and is supported by other recent data) (2, 12, 28). The use of 2H2O has practical advantages in that studies do not require a postabsorptive state and can assess protein synthesis over short and long periods of time.
Fig. 1.
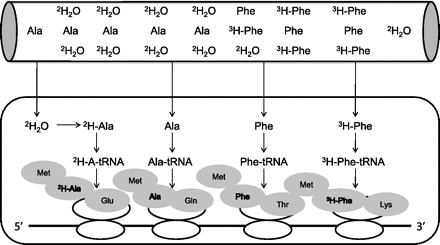
Depiction of mRNA translation elongation with 2 different isotopes {2H2O and l-[2,3,4,5,6-3H]phenylalanine ([3H]Phe)}. The flooding dose works on the assumption that providing a large bolus of labeled ([3H]Phe) and unlabeled (Phe) phenylalanine over seconds/minutes will result in similar specific activities between the plasma, intracellular, and, ultimately, the aminoacyl-tRNA. The 2H2O method works on the assumption that 2H rapidly equilibrates with the body water, which leads to the intracellular 2H labeling of alanine (Ala) via transamination reactions, therein bypassing the requirement for rapid transmembrane amino acid transport. Met, methionine; Leu, leucine; Asp, aspartate; Tyr, tyrosine; Gln, glutamine; Thr, threonine; Iso, isoleucine; Glu, glutamic acid; Val, valine.
Belloto et al. (3) recently demonstrated similar apoB-100-VLDL protein-synthetic rates with 2H2O and a primed infusion of leucine, further validating the reliability of using labeled water. However, to our knowledge, no studies exist comparing the flooding dose and 2H2O methodologies on muscle protein synthesis. We aimed to determine whether 2H2O and flooding with l-[2,3,4,5,6-3H]Phe would yield comparable results. The experiments examined two physiological scenarios (i.e., basal vs. an acute bout of resistance exercise) and considered measurements over different periods of time.
METHODS
Chemicals and Supplies
Unless specified, all chemicals and reagents were purchased from Fisher Scientific (Pittsburgh, PA). 2H2O (99.9 atom % excess) and l-[ring-13C6]Phe (99% enriched) were purchased from Cambridge Isotopes (Andover, MA). N-methyl-N-t-butyldimethylsilyl-trifluoroacetamide (MTBSTFA) + 1% t-butyl-dimethylchlorosilane (TBDMCS) was purchased from Pierce (Rockford, IL). l-[2,3,4,5,6-3H]Phe was purchased from GE Healthcare Life Science-Amersham (Buckinghamshire, UK). Gas chromatography-mass spectrometry supplies were purchased from Agilent Technologies (Wilmington, DE) and Alltech (Deerfield, IL). Kinase buffer (1×) was purchased from Cell Signaling Technology (Danvers, MA).
Animals and Operant Conditioning
Twenty-four male Sprague-Dawley rats (∼5 mo old) were individually housed in a climate-controlled small animal facility with a 12:12-h light-dark cycle (lights on at 10:00 PM, lights off at 10:00 AM). Rats were fed a standard feed ad libitum and had free access to water. The rats were assigned by body mass into one of four groups based on the number of hours prior to muscle harvest that the animals were administered 2H2O: 4-h control (CON 4 h; n = 6), 4-h resistance exercise (RE 4 h; n = 6), 24-h control (CON 24 h; n = 6), or 24-h resistance exercise (RE 24 h; n = 6). All experimental procedures were approved by the Institutional Animal Care and Use Committee of Texas A & M University.
The RE animals were operantly conditioned to depress an illuminated bar located high on a Plexiglas exercise cage (17). Negative reinforcement via an electrical foot shock (<3 mA, 60 Hz) was used to train the rats to perform the desired movements. After the animals were conditioned (4 sessions), a nonweighted Velcro vest was strapped over the scapulae, and the rats were required to touch the illuminating bar 50 times for an additional two sessions. The CON animals were free from physical activity and remained single-housed over the course of the study.
Experimental Protocol
On the day of the study, one-half of the animals (24-h CON and 24-h RE) received 20 μl/g body mass, via an intraperitoneal (ip) injection, of 99.9% 2H2O and were allowed free access to drinking water enriched to 4.0% 2H2O (Fig. 2. ) In addition, one-half of the animals (24-h RE and 4-h RE) performed a progressive bout of RE. The protocol consisted of the RE animals performing 0 (10 repetitions), 80 (15 repetitions), 110 (12 repetitions), 180 (10 repetitions), 230 (8 repetitions), and 80 g (15 repetitions). Ten of the 12 RE animals completed this protocol; however, two failed to complete the eight repetitions with 230 g, and therefore, we increased the repetitions of the final set at 80 g to equal the total volume that the other rats completed. Twelve hours following the RE session, the remaining animals (4-h CON and 4-h RE) received the same quantity of 2H2O and were allowed free access to drinking water enriched to 4.0% 2H2O. In addition, the food was withdrawn at this time (4:00 AM).
Fig. 2.
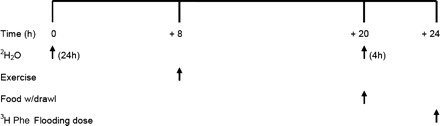
Schematic display of study design used to measure muscle protein synthesis with 2H2O and flooding dose of Phe. At time 0 (8:00 AM), an intraperitoneal bolus of 2H2O was provided to the rats (n = 12), and 4% 2H2O drinking water was provided ad libitum. The acute bout of resistance exercise (n = 12) was completed at time +8 h (4:00 PM). At time +20 h (4:00 AM), the other group of rats (n = 12) was provided an intraperitoneal bolus of 99.9% 2H2O and 4% 2H2O ad libitum drinking water. At +24 h (8:00 AM), all animals (n = 24) were anesthetized, cannulated, and administered a Phe flooding dose as well as muscle harvest to assess fractional rates of protein synthesis.
Four hours later (8:00 AM), all rats were anesthetized with ketamine (40–55 mg/kg) and medetomidine (0.4 mg/kg) via an ip injection. The left carotid artery and right jugular vein were cannulated with sterile, heparinized polythene tubing (PE-50). While the rats were sedated, a flooding dose of l-[2,3,4,5,6-3H]Phe (0.5 mCi/rat) in unlabeled Phe (150 mM, 1 ml/100 g body mass) was injected into the venous catheter over a 10- to 15-s period (19). Three arterial blood samples (1 ml) were taken from the carotid cannula during a 12-min period (2, 6, and 12 min) for the determination of Phe-specific radioactivity. After arterial sampling, the mixed gastrocnemius (M. Gastroc), plantaris (Plant), and soleus (Sol) muscles were excised, immediately frozen to the temperature of liquid nitrogen between aluminum blocks, and stored at −80C until analyzed.
Analytical Methods
Flooding dose sample preparation and analyses.
Tissue and plasma specific radioactivity were determined using a modified version of the protocols outlined by Garlick et al. (19) and Vary et al. (36). A known amount of muscle (∼0.150–0.200 g) was pulverized under liquid nitrogen, followed by homogenization in 2.0 ml of 10% trichloroacetic acid (TCA), and centrifuged at 3,800 rpm for 15 min at 4°C. The supernatant was discarded, and the protein precipitate was washed four additional times in 2.0 ml of 10% TCA and then freed from lipid with 2.0 ml of acetone, washed with 2.0 ml of distilled H2O, and dissolved in 2.0 ml of 0.25 N NaOH. A portion of the protein was used to quantify protein content using the bicinchoninic acid method (32). To determine tissue specific radioactivity, 0.5 ml of the protein solution was measured by liquid scintillation counting, with appropriate corrections made for quench. Protein-bound Phe was determined by reprecipitating the protein from the 0.25-N NaOH solution with 1.0 ml of 10% TCA and centrifugation at 3,800 rpm for 15 min at 4°C, followed by two additional wash steps. The precipitate was then hydrolyzed for 24 h at 110°C with the addition of 0.1 ml of 10 μmol/ml l-[ring-13C6]Phe to serve as an internal standard (4). Blood samples (2, 6, and 12 min) were centrifuged at 3,800 rpm for 30 min at 4°C, followed by removal of 0.4 ml of plasma and the addition of 0.4 ml of 10% TCA and 0.4 ml of 30–60 nmol/ml l-[ring-13C6]phenylalanine to quantify the total Phe in the plasma samples. To determine plasma radioactivity, 0.05 ml was measured by liquid scintillation counting, with appropriate corrections made for quench.
To quantify both plasma and tissue Phe, 0.05 ml was dried under a stream of N2, followed by the addition of a 1:1 solution of acetonitrile-MTBSTFA + 1% TBDMCS, modified from Calder et al. (7). After reacting at room temperature for 30 min, the samples were analyzed using an Agilent 5975C-MSD equipped with an Agilent 7890 GC system and an HP-5ms capillary column (30 m × 0.25 mm × 0.25 μm). The following temperature program was used: 160°C initial and hold for 5 min and increase by 15°C/min to 270°C and hold for 8 min. The sample was injected at a spit ratio of 40:1, with a helium flow of 30 ml/min. Phe eluted at ∼12 min. The mass spectrometer was operated in electron impact mode (70eV). Selective ion monitoring of mass-to-charge (m/z) ratios 234 (M) and 240 (M + 6) was conducted using a dwell time of 30 ms/ion.
2H2O preparation and analysis.
Labeling (2H) of body water was assessed by exchange with acetone described by Yang et al. (39). The reaction occurred with 20 μl of a sample/standard, 2 μl of 10 N NaOH, and 4 μl of a 5% (vol/vol) solution of acetone in acetonitrile for 24 h. Acetone was removed by the addition of 0.6 ml of chloroform and 0.5 g Na2SO4. The samples were mixed, and 0.1 ml of the chloroform was transferred to a gas chromatography-mass spectrometry vial. The samples were analyzed using an Agilent 5975C-MSD equipped with an Agilent 7890 GC system and an HP-5ms capillary column (30 m × 0.25 mm × 0.25 μm). The following temperature program was used: 60°C initial, increase by 20°C/min to 100°C, increase by 50°C/min to 220°C, and hold for 1 min. The sample was injected at a spit ratio of 40:1 with a helium flow of 1 ml/min. Acetone eluted at ∼1.7 min. The mass spectrometer was operated in 70eV. Selective ion monitoring of m/z ratios 58 (M) and 59 (M + 1) was conducted using a dwell time of 10 ms/ion.
Labeling (2H) of protein-bound alanine was measured as described previously by Dufner et al. (12). Briefly, ∼0.030 g of M. Gastroc, Plant, and Sol was homogenized on ice in 0.3 ml of a 10% (wt/vol) TCA and centrifuged at 3,750 rpm at 4°C for 15 min. The supernatant was discarded, and the protein pellet was washed three additional times with TCA. The protein pellet was then dissolved in 6 N HCl (0.1 ml/0.010 g tissue) and reacted at 100°C for 18 h. To determine whether there was a difference in mixed muscle vs. myofibrillar, ∼0.060 g of M. Gastroc was homogenized on ice in 400 μl of a 1× kinase buffer (25 mM Tris·HCl, 5 mM β-glycerophosphate, 2 mM dithiothreitol, 0.1 mM Na3VO4, 10 mM MgCl2) with 200 μM ATP and 0.01% Triton. Homogenates were centrifuged at 14,000 rpm at 4°C for 30 min. After centrifugation, the supernatant containing the cytosolic and membrane portion was discarded, and the precipitate (representative of the myofibrillar fraction) was prepared the same as the mixed muscle. An aliquot (0.1 ml) of the hydrolysate was dried under a stream of N2 for ∼1 h. A 3:2:1 ratio (0.1 ml) of “methyl-8” reagent (Pierce), methanol, and acetonitrile was added to the residue to determine the 2H labeling of alanine on its methyl-8 derivative. All samples were analyzed using an Agilent 5973N-MSD equipped with an Agilent 6890 GC system, and a DB17-MS capillary column (30 m × 0.25 mm × 0.25 μm) was used in all analyses. The following temperature program was used: 90°C initial, hold for 5 min, increase by 5°C/min to 130°C, increase by 40°C/min to 240°C, and hold for 5 min. The sample was injected at a spit ratio of 20:1 with a helium flow of 1 ml/min. Alanine eluted at ∼12 min. The mass spectrometer was operated in 70eV. Selective ion monitoring of m/z ratios 99 (M) and 100 (M + 1) was conducted using a dwell time of 10 ms/ion.
Calculations
Rates of protein synthesis (RPS) were calculated for the Phe flooding dose using the equation described by Vary et al. (36):
 |
(1) |
where DPM (disintegrations per minute)/g wet wt is the quantity of l-[2,3,4,5,6-3H]Phe incorporated into the available pool (mg protein per g of tissue), SĀ is the mean specific activity in plasma (DPM/nmol Phe) over 12 min of flooding, and t is incorporation time in hours. Fractional rates of protein synthesis (FSR) with Phe were calculated using the equation described by Garlick et al. (19):
 |
(2) |
where SP is the specific radioactivity of protein (DPM/nmol Phe) (19). When 2H2O was provided, FSR was calculated using the equation
 |
(3) |
where EA represents amount of protein-bound 2H Ala (mole % excess), EBW is the quantity of 2H2O in body water (mole % excess), and 3.7 represents the exchange of 2H between body water and alanine (12, 28, 38). The assumption is that 2H-labeled body water equilibrates with free alanine more rapidly than 2H-labeled alanine incorporates into newly made protein and that protein synthesis is linear over the study (11, 38).
Statistical Analysis
Analyses were completed using SigmaStat version 3.5, and values are expressed as means ± SE. A one-way ANOVA was used to compare differences between the exercise and control groups, the different approaches (4-h 2H2O vs. 24-h 2H2O and flooding), Phe-specific radioactivities, milligrams of protein relative to tissue, and plasma 2H2O labeling. A two-way ANOVA was used to compare differences between the myofibrillar and mixed muscle (activity × muscle fraction) as well as for 2H-labeled alanine (activity × time of administration). If a test of normality or equal variance failed, a ranks test followed by Dunn's Test was conducted. A Fisher least significant difference post hoc test was used when a main effect was observed. We accepted an analysis as statistically significant if P < 0.05.
RESULTS
Exercise vs. Control Assessed with Phe Flooding Dose
The specific activities of the plasma and muscle (DPM/nmol Phe) are shown in Tables 1 and 2. In all cases we obtained sufficient counts to allow for the calculation of protein synthesis. RE did not affect protein synthesis in any muscle type (FSR and RPS; Fig. 3, main panel and inset, respectively). As a result of this finding, we collapsed the groups to compare muscle type differences (data not shown) and observed higher RPS in the soleus [89% slow oxidative (1)] compared with Plant and M. Gastroc (P < 0.001), which is consistent with previous findings (13, 18, 35) regardless of whether plasma or the intracellular compartment was used as the precursor pool in the calculations. In addition, FSR was significantly higher in the Sol vs. Plant and M. Gastroc muscles (P < 0.05). The nanomoles of Phe relative to the pool size (mg protein/g wet wt) did not differ statistically between the M. Gastroc (122 ± 6), Plant (131 ± 9), and Sol (109 ± 7). However, DPM relative to protein pool size appeared to be higher in the Sol (56 ± 7) compared with the M. Gastroc (36 ± 5; P < 0.05) and Plant (41 ± 4). Given that the Phe was similar for all muscles, with apparently higher DPM relative to the pool size in the Sol, it suggests that muscles composed of predominately slow-type fibers have greater RPS and FSR values.
Table 1.
Phe SA and 2H labeling of body water
| Group (n = 6) | Phe SA | 2H2O at 1 h | 2H2O at 24 h |
|---|---|---|---|
| 4-hCON | 592.68±47.55 | NA | 2.47±0.12 |
| 4-hRE | 575.76±23.67 | NA | 2.80±0.08 |
| 24-hCON | NA | 2.63±0.02 | 2.71±0.16 |
| 24-hRE | NA | 2.65±0.13 | 2.69±0.05 |
Values are means ± SE. Phe SA, plasma phenylalanine specific activity [disintegrations·min (DPM)−1·nmol phenylalanine−1]; CON, control; RE, resistance exercise; NA, not available. Plasma 2H2O expressed as MPE, mole percent excess.
Table 2.
Tissue phenylalanine specific activity and 2H labeling of protein-bound alanine
| Group | n | Phe SA Tissue | 2H-Labeling Tissue |
|---|---|---|---|
| Mixed gastrocnemius | |||
| 4-h CON | 6 | 0.22±0.06 | 0.37±0.04 |
| 4-h RE | 6 | 0.36±0.02 | 0.50±0.06 |
| 24-h CON | 6 | 0.72±0.04* | |
| 24-h RE | 6 | 0.71±0.05† | |
| Mixed gastrocnemius myofibrillar | |||
| 24-h CON | 6 | 0.69±0.04 | |
| 24-h RE | 6 | 0.65±0.04 | |
| Plantaris | |||
| 4-h CON | 6 | 0.24±0.05 | 0.43±0.10 |
| 4-h RE | 5 | 0.36±0.02 | 0.35±0.04 |
| 24-h CON | 5 | 0.74±0.06† | |
| 24-h RE | 6 | 0.71±0.06* | |
| Soleus | |||
| 4-h CON | 5 | 0.44±0.10 | 0.38±0.07 |
| 4-h RE | 6 | 0.49±0.05 | 0.41±0.05 |
| 24-h CON | 6 | 0.94±0.10* | |
| 24-h RE | 6 | 0.86±0.04* |
Values are means ± SE. 2H labeling of protein-bound alanine expressed as mole % excess.
Significantly different in 24 h from 4 h in same group (P < 0.001);
significantly different in 24 h from 4 h in same group (P < 0.001).
Fig. 3.
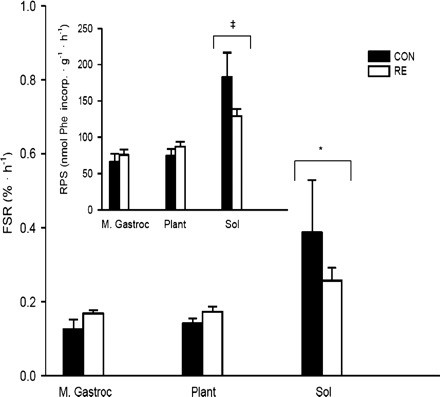
Fractional rates of protein synthesis (FSR) and rates of protein synthesis (RPS; inset) assessed with l-[2,3,4,5,6-3H]Phe in the mixed gastrocnemius (M. Gastroc), plantaris (Plant), and soleus (Sol) 16 h following the resistance exercise (RE) session or control (CON). Data are expressed as %/h (nmol Phe incorporated·g−1·h−1; inset) and presented as means ± SE; (n = 5–6/group). The groups were collapsed to determine muscle type differences. *Significant differences between the Sol and the M. Gastroc and Plant for FSR (P < 0.05); ‡significant differences between the Sol and the M. Gastroc and Plant for RPS (P < 0.001; n = 11–12/muscle).
Exercise vs. Control Assessed with 2H2O
Tables 1 and 2 demonstrate that the labeling of body water remained virtually constant over the 24-h period and show the incorporation of protein-bound [2H]Ala into the various muscles. Consistent with the Phe flooding dose, the 2H2O method did not detect any effect(s) of RE on protein synthesis in the 4-h 2H2O (Fig. 4A) or the 24-h 2H2O rats (Fig. 4B). In addition, similar to the Phe flooding dose, where FSR was higher in the Sol muscle, we observed a significantly higher FSR in the 24-h 2H2O rats' Sol compared with the M. Gastroc and Plant, when the CON and RE groups were collapsed (P < 0.01). It is commonly accepted that mixed muscle protein synthesis should be reflective of myofibrillar proteins [which comprise >70% of the total protein pool (26)]. However, myofibrillar proteins turn over at a much slower rate relative to other proteins in the mixed pool, which may limit one's ability to interpret alterations in protein synthesis using methods over short periods. Furthermore, Jaleel et al. (22) reported very different FSR values in 29 plasma proteins, which would have been severely masked if only the mixed heterogeneous pool was assessed. Thus, we directly examined the gastrocnemius myofibrillar fraction in the animals that received 2H2O over 24 h to determine whether or not protein synthesis in the myofibrillar fraction was reflective of the total mixed pool with and without an acute bout of RE. Interestingly, FSR in the mixed muscle or myofibrillar protein fractions did not differ (P > 0.05) in the 24-h 2H2O CON (0.27 ± 0.01 vs. 0.26 ± 0.01, respectively), nor was it affected by RE (0.29 ± 0.02 vs. 0.26 ± 0.01, respectively), suggesting that the anabolic effect of exercise was not observed after a single, high-intensity bout.
Fig. 4.
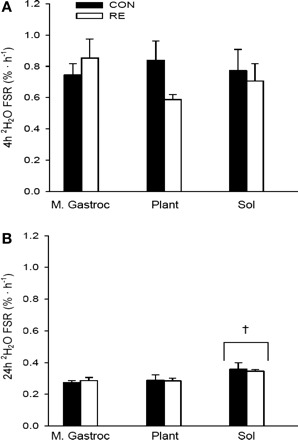
FSR assessed with 2H2O in animals over 4 (A) and 24 h (B) in the M. Gastroc, Plant, and Sol. Data are expressed as %/h and presented as means ± SE (n = 5–6/group). The groups were collapsed to determine muscle type differences. †Significant differences between the Sol and the M. Gastroc and Plant in the 24-h (B) animals (P < 0.01; n = 11–12/muscle).
Phe Flooding vs. 4-h 2H2O vs. 24-h 2H2O
In addition to making qualitative comparisons, we also wanted to make direct comparisons (quantitative) between 2H2O (different times of assessment) and flooding dose, expressed as %/h (Fig. 5). As a result of not detecting an exercise effect, we collapsed the groups and observed significant differences between the 4-h 2H2O approach vs. the Phe flooding and 24-h 2H2O techniques in the M. Gastroc, Plant, and Sol (P < 0.001) and between the 24-h 2H2O and Phe flooding dose in the M. Gastroc and Plant (P < 0.05). Note that a greater percentage of protein was synthesized in the 24-h 2H2O (7.2 ± 0.3, 7.4 ± 0.5, and 9.1 ± 0.6) vs. 4-h 2H2O (4.4 ± 0.4, 4.0 ± 0.5, and 4.0 ± 0.5) and Phe flooding dose (0.05 ± 0.01, 0.05 ± 0.01, and 0.09 ± 0.01) in the M. Gastroc, Plant, and Sol, respectively (P < 0.001). These observations underscore the importance of tissue heterogeneity (i.e., the complexity of the total protein pool) and its effect(s) when synthesis rates are calculated.
Fig. 5.
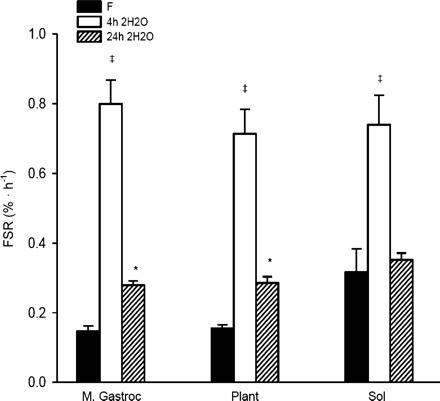
FSR assessed with Phe flooding dose and 2H2O (4 and 24 h) in the M. Gastroc, Plant, and Sol. Data are expressed as %/h and presented as means ± SE. ‡Significant difference between 4-h 2H2O vs. Phe flooding dose and 24-h 2H2O for M. Gastroc, Plant, and Sol (P < 0.001); *significant difference between 24-h 2H2O and Phe flooding dose in the M. Gastroc and Plant (n = 11–12/group).
DISCUSSION
The main purpose of the present work was to determine whether 2H2O provided comparable results as the traditional flooding dose (using l-[2,3,4,5,6-3H]Phe as the tracer) with an acute bout of high-intensity resistance exercise. We chose to include an acute bout of high-intensity resistance exercise due to its anabolic nature and role in prevention and treatment of many diseases. Additionally, we wanted to measure protein synthesis rates over shorter periods of time (∼30 min with flooding dose and 4 h with 2H2O) to ascertain whether extrapolating short-term synthesis rates on a per-day basis provides values similar to those measured over 24 h (24-h 2H2O). We report three novel findings from this research study: 1) 2H2O provides “qualitatively” similar results as the flooding dose when the effects of resistance exercise are examined, 2) a single bout of high-intensity resistance exercise without prior training does not appear to be anabolic in rats, and 3) extrapolating values that are measured over a short interval does not accurately reflect what might occur over an entire day.
The ability to quantify protein synthesis during non-steady-state metabolism has presented a challenge to investigators since it can be difficult to assess amino acid precursor labeling, particularly as temporal changes or perturbations in biochemical flux (such as what occurs with feeding or exercise) disrupt a steady state. The flooding dose method offers some advantages in that measurements of protein synthesis can be made with infusion periods of ∼10–90 min (8, 9, 19, 21, 31) by imposing a saturation of the precursor pool. Furthermore, flooding dose methodologies may be preferred in short-term intervention studies, where rapid physiological responses are expected. However, the flooding dose can become problematic when experiments are designed, since vascular cannulation has traditionally been required and measurements of protein flux over longer periods are not practical. The use of 2H2O for assessing protein synthesis can bypass some of the traditional tracer limitations, such as measurement of the true precursor pool and the ease in maintaining it over extended periods of time, the need for postabsorptive conditions prior to initiation of the tracer, the necessity of a general clinical research center and laboratory confinement (if using humans), and skilled personnel for cannulation. In addition, measurements can be made over relatively short (∼4 h) and long intervals (days or perhaps weeks), therein permitting acute and cumulative studies of protein synthesis in vivo (3, 6, 12, 28, 40). Note that 2H2O results in a rapid equilibration (∼20 min) between the hydrogen-labeling in body water and those stably bound to free alanine (12, 28); thus the labeling of plasma water seems to provide a reliable surrogate of the precursor labeling over a range of experimental conditions, making the use of 2H2O a suitable tracer in the free living environment.
In the current studies we were unable to detect any stimulatory effect(s) of a single bout of resistance exercise on protein synthesis. Particular attention was focused on 16-h postresistance exercise, since we and others have demonstrated that this time corresponds to the peak “anabolic window” (time of elevated rates of protein synthesis) (5, 14, 15, 17, 18) after two or four bouts of exercise without prior training. Likewise, the cumulative measurements over a 24-h period made using 2H2O did not reveal any stimulatory effect of resistance exercise on protein synthesis. These observations raise important questions regarding alterations in muscle protein synthesis after a single bout of resistance exercise in animals that are consuming food ad libitum. For example, resistance exercise exerts both anabolic and catabolic stimuli, whereas feeding simultaneously stimulates protein synthesis and inhibits protein breakdown (25, 27, 30, 33, 34). One might expect that, although resistance exercise may lead to elevated protein turnover, the integrated effect of exercise and food consumption over a 24-h period should lead to elevated labeling of proteins in skeletal muscle. Our data suggest that a single bout of high-intensity resistance exercise, without prior training in rats, may not be followed by a net anabolic effect. It is possible either that our findings are a result of the intense nature of the activity or that more time is necessary to observe the metabolic adaptations necessary to support the anabolic response to exercise.
One could argue that our resistance exercise regimen was too intense to observe anabolic responses to exercise, as opposed to our prior work (17, 18) and work by others (13–15, 23), which used lower intensities. Consistent with that possibility, we demonstrated previously that rates of muscle protein synthesis are blunted following a single bout of high-intensity, eccentric exercise; however, a second bout of exercise of the same magnitude 1 wk later demonstrated elevated rates of synthesis in a fiber-specific manner (16). Therefore, although we cannot rule out that the higher intensity of the resistance exercise protocol in the present study potentially blunted postexercise anabolic responses, it is more likely that a single bout without prior training leads to adaptations in skeletal muscle that are necessary before anabolic responses can be observed with subsequent bouts.
We investigated muscle protein synthesis using two methodologies to account for possible differences in the time of assessment. Reported fractional rates of mixed muscle protein synthesis typically range from ∼0.05%/h postabsorptive to ∼0.10%/h following feeding and resistance exercise in human vastus lateralis muscle (9, 10) and 0.2 to 0.9%/h under fasting-feeding conditions, respectively, in lower-limb rat muscle (19, 20, 36, 40). Clearly, it is difficult to extrapolate measurements of protein synthesis made over minutes to a few hours and draw conclusions regarding the total amount of newly made protein over the course of an entire day. In support of this, had we extrapolated the 4-h 2H2O and Phe flooding dose over 24 h, we would have overestimated the percentage of newly made protein with the 4-h 2H2O by 165% in the mixed gastrocnemius, 131% in the plantaris, and 96% in the soleus (P < 0.001) as well as underestimated FSR with the Phe flooding dose by 105% in the mixed gastrocnemius and 98% in the plantaris (P < 0.01). However, when the effect of time on the incorporation of label is looked at, it is clear that there is greater incorporation of 2H-labeled alanine into muscle protein after 24- vs. 4-h exposure to the isotope, and therefore, as expected, more protein was synthesized over 24 h (Tables 1 and 2).
In addition to technical differences between the tracer methods, our seemingly discrepant differences in quantitative FSR extrapolated over time, particularly using the two deuterium oxide techniques, may be partly explained on the basis of food consumption. For example, although food was removed from all of the rats 4 h prior to our assessment of muscle protein synthesis, it is possible that the rats consumed food up until the time of removal, allowing for labeling in the 4-h 2H2O group to be initiated in the postprandial state, ultimately enhancing FSR. Although this happened in the other groups as well, incorporation of label only occurred either minutes before the assessment of muscle protein synthesis 4 h following food removal (Phe flooding dose) or over the entire 24-h period (24-h 2H2O). Thus, the impact of food consumption during this period of time would be minimized in the former (postabsorptive) and diluted with respect to the 24-h labeling period in the latter. Figure 6 shows the consequences of sampling at different time intervals such that, if one were to measure FSR over three different periods of time, it is possible to obtain measurements that do not reflect the true values during each period. This concept is not novel, as Reeds et al. (29) reported different FSR values in the mixed gastrocnemius and soleus muscles of rats when measurements were made using the flooding dose at different times throughout a 24-h period (food was removed at the same time points). Thus, our example as well as the observations by Reeds et al. (29) emphasized the importance, or consequences, of understanding the metabolic state of the tissue (fed, fasted, pre- or postexercise, time of day, etc.) during assessments of muscle protein synthesis.
Fig. 6.
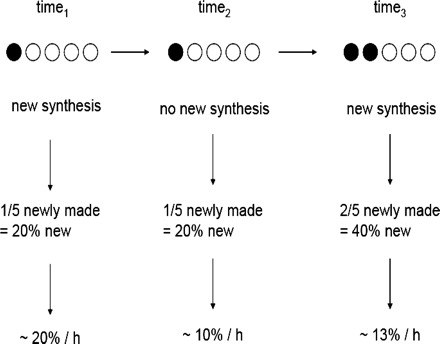
Proposed scheme of measuring non-steady-state protein synthesis in a homogenous (purified protein) pool at different time points. Assuming that the time interval is the same (e.g., 1 h), if ⅕ of the available pool is newly synthesized protein, the %/h expression would be 20%. If in the next hour no new synthesis occurs, then ⅕ of the pool would be newly synthesized protein; however, the %/h expression would now only be 10%. If in the 3rd hour of measurement another ⅕ of the pool is synthesized (two-fifths total), the %/h expression would be ∼13%; however, this FSR does not represent the values obtained over either of the other intervals.
In summary, the present study demonstrates that a single bout of high-intensity resistance exercise without prior training in rats does not stimulate muscle protein synthesis (mixed or myofibrillar) and that the Phe flooding dose and 2H2O provide qualitatively (not quantitatively) similar results. Moreover, we conclude that one should consider the impact of extrapolating (regardless of methodology) vs. measuring FSR over different periods of time. The use of 2H2O is an attractive approach to measure tissue-specific protein synthesis due to the ease in administration of the stable isotope and effective use during a wide variety of physiological perturbations. However, we acknowledge that the research question and the time by which measurements should be made should dictate which tracer methodology to employ.
GRANTS
This research was supported by the National Institutes of Health (AG-01025 to J. D. Fluckey and MMPC to S. F. Previs) and the Sydney and J. L. Huffines Institute for Sports Medicine and Human Performance (to H. G. Gasier).
Acknowledgments
We extend our gratitude to Teak Lee and Vincent Chen for their technical support.
REFERENCES
- 1.Armstrong RB, Phelps RO. Muscle fiber type composition of the rat hindlimb. Am J Anat 171: 259–272, 1984 [DOI] [PubMed] [Google Scholar]
- 2.Bederman IR, Dufner DA, Alexander JC, Previs SF. Novel application of the “doubly labeled” water method: measuring CO2 production and the tissue-specific dynamics of lipid and protein in vivo. Am J Physiol Endocrinol Metab 290: E1048–E1056, 2006 [DOI] [PubMed] [Google Scholar]
- 3.Belloto E, Diraison F, Basset A, Allain G, Abdallah P, Beylot M. Determination of protein replacement rates by deuterated water: validation of underlying assumptions. Am J Physiol Endocrinol Metab 292: E1340–E1347, 2007 [DOI] [PubMed] [Google Scholar]
- 4.Biolo G, Fleming RY, Maggi SP, Wolfe RR. Transmembrane transport and intracellular kinetics of amino acids in human skeletal muscle. Am J Physiol Endocrinol Metab 268: E75–E84, 1995 [DOI] [PubMed] [Google Scholar]
- 5.Bolster DR, Kubica N, Crozier SJ, Williamson DL, Farrell PA, Kimball SR, Jefferson LS. Immediate response of mammalian target of rapamycin (mTOR)-mediated signalling following acute resistance exercise in rat skeletal muscle. J Physiol 553: 213–220, 2003 [DOI] [PMC free article] [PubMed] [Google Scholar]
- 6.Busch R, Kim YK, Neese RA, Schade-Serin V, Collins M, Awada M, Gardner JL, Beysen C, Marino ME, Misell LM, Hellerstein MK. Measurement of protein turnover rates by heavy water labeling of nonessential amino acids. Biochim Biophys Acta 1760: 730–744, 2006 [DOI] [PubMed] [Google Scholar]
- 7.Calder AG, Garden KE, Anderson SE, Lobley GE. Quantitation of blood and plasma amino acids using isotope dilution electron impact gas chromatography/mass spectrometry with U-(13)C amino acids as internal standards. Rapid Commun Mass Spectrom 13: 2080–2083, 1999 [DOI] [PubMed] [Google Scholar]
- 8.Caso G, Ford GC, Nair KS, Garlick PJ, McNurlan MA. Aminoacyl-tRNA enrichment after a flood of labeled phenylalanine: insulin effect on muscle protein synthesis. Am J Physiol Endocrinol Metab 282: E1029–E1038, 2002 [DOI] [PubMed] [Google Scholar]
- 9.Caso G, Garlick PJ, Ballou LM, Vosswinkel JA, Gelato MC, McNurlan MA. The increase in human muscle protein synthesis induced by food intake is similar when assessed with the constant infusion and flooding techniques. J Nutr 136: 1504–1510, 2006 [DOI] [PubMed] [Google Scholar]
- 10.Dreyer HC, Fujita S, Cadenas JG, Chinkes DL, Volpi E, Rasmussen BB. Resistance exercise increases AMPK activity and reduces 4E-BP1 phosphorylation and protein synthesis in human skeletal muscle. J Physiol 576: 613–624, 2006 [DOI] [PMC free article] [PubMed] [Google Scholar]
- 11.Dufner D, Previs SF. Measuring in vivo metabolism using heavy water. Curr Opin Clin Nutr Metab Care 6: 511–517, 2003 [DOI] [PubMed] [Google Scholar]
- 12.Dufner DA, Bederman IR, Brunengraber DZ, Rachdaoui N, Ismail-Beigi F, Siegfried BA, Kimball SR, Previs SF. Using 2H2O to study the influence of feeding on protein synthesis: effect of isotope equilibration in vivo vs. in cell culture. Am J Physiol Endocrinol Metab 288: E1277–E1283, 2005 [DOI] [PubMed] [Google Scholar]
- 13.Farrell PA, Fedele MJ, Hernandez J, Fluckey JD, Miller JL 3rd, Lang CH, Vary TC, Kimball SR, Jefferson LS. Hypertrophy of skeletal muscle in diabetic rats in response to chronic resistance exercise. J Appl Physiol 87: 1075–1082, 1999 [DOI] [PubMed] [Google Scholar]
- 14.Farrell PA, Fedele MJ, Vary TC, Kimball SR, Lang CH, Jefferson LS. Regulation of protein synthesis after acute resistance exercise in diabetic rats. Am J Physiol Endocrinol Metab 276: E721–E727, 1999 [DOI] [PubMed] [Google Scholar]
- 15.Farrell PA, Hernandez JM, Fedele MJ, Vary TC, Kimball SR, Jefferson LS. Eukaryotic initiation factors and protein synthesis after resistance exercise in rats. J Appl Physiol 88: 1036–1042, 2000 [DOI] [PubMed] [Google Scholar]
- 16.Fluckey JD, Asp S, Enevoldsen LH, Galbo H. Insulin action on rates of muscle protein synthesis following eccentric, muscle-damaging contractions. Acta Physiol Scand 173: 379–384, 2001 [DOI] [PubMed] [Google Scholar]
- 17.Fluckey JD, Kraemer WJ, Farrell PA. Pancreatic islet insulin secretion is increased after resistance exercise in rats. J Appl Physiol 79: 1100–1105, 1995 [DOI] [PubMed] [Google Scholar]
- 18.Fluckey JD, Vary TC, Jefferson LS, Farrell PA. Augmented insulin action on rates of protein synthesis after resistance exercise in rats. Am J Physiol Endocrinol Metab 270: E313–E319, 1996 [DOI] [PubMed] [Google Scholar]
- 19.Garlick PJ, McNurlan MA, Preedy VR. A rapid and convenient technique for measuring the rate of protein synthesis in tissues by injection of [3H]phenylalanine. Biochem J 192: 719–723, 1980 [DOI] [PMC free article] [PubMed] [Google Scholar]
- 20.Garlick PJ, Wernerman J, McNurlan MA, Essen P. What is the normal response of protein turnover to nutrient supply? Clin Nutr 9: 294–296, 1990 [DOI] [PubMed] [Google Scholar]
- 21.Jahoor F, Zhang XJ, Baba H, Sakurai Y, Wolfe RR. Comparison of constant infusion and flooding dose techniques to measure muscle protein synthesis rate in dogs. J Nutr 122: 878–887, 1992 [DOI] [PubMed] [Google Scholar]
- 22.Jaleel A, Nehra V, Persson XM, Boirie Y, Bigelow M, Nair KS. In vivo measurement of synthesis rate of multiple plasma proteins in humans. Am J Physiol Endocrinol Metab 291: E190–E197, 2006 [DOI] [PubMed] [Google Scholar]
- 23.Kubica N, Bolster DR, Farrell PA, Kimball SR, Jefferson LS. Resistance exercise increases muscle protein synthesis and translation of eukaryotic initiation factor 2Bepsilon mRNA in a mammalian target of rapamycin-dependent manner. J Biol Chem 280: 7570–7580, 2005 [DOI] [PubMed] [Google Scholar]
- 24.Oshima T, Tamiya N. Mechanism of transaminase action. Biochem J 78: 116–119, 1961 [DOI] [PMC free article] [PubMed] [Google Scholar]
- 25.Phillips SM. Dietary protein for athletes: from requirements to metabolic advantage. Appl Physiol Nutr Metab 31: 647–654, 2006 [DOI] [PubMed] [Google Scholar]
- 26.Phillips SM. Protein requirements and supplementation in strength sports. Nutrition 20: 689–695, 2004 [DOI] [PubMed] [Google Scholar]
- 27.Phillips SM, Hartman JW, Wilkinson SB. Dietary protein to support anabolism with resistance exercise in young men. J Am Coll Nutr 24: 134S–139S, 2005 [DOI] [PubMed] [Google Scholar]
- 28.Previs SF, Fatica R, Chandramouli V, Alexander JC, Brunengraber H, Landau BR. Quantifying rates of protein synthesis in humans by use of 2H2O: application to patients with end-stage renal disease. Am J Physiol Endocrinol Metab 286: E665–E672, 2004 [DOI] [PubMed] [Google Scholar]
- 29.Reeds PJ, Palmer RM, Hay SM, McMillan DN. Protein synthesis in skeletal muscle measured at different times during a 24 hour period. Biosci Rep 6: 209–213, 1986 [DOI] [PubMed] [Google Scholar]
- 30.Rennie MJ, Wackerhage H, Spangenburg EE, Booth FW. Control of the size of the human muscle mass. Annu Rev Physiol 66: 799–828, 2004 [DOI] [PubMed] [Google Scholar]
- 31.Smith K, Reynolds N, Downie S, Patel A, Rennie MJ. Effects of flooding amino acids on incorporation of labeled amino acids into human muscle protein. Am J Physiol Endocrinol Metab 275: E73–E78, 1998 [DOI] [PubMed] [Google Scholar]
- 32.Smith PK, Krohn RI, Hermanson GT, Mallia AK, Gartner FH, Provenzano MD, Fujimoto EK, Goeke NM, Olson BJ, Klenk DC. Measurement of protein using bicinchoninic acid. Anal Biochem 150: 76–85, 1985 [DOI] [PubMed] [Google Scholar]
- 33.Tipton KD, Ferrando AA, Phillips SM, Doyle D Jr, Wolfe RR. Postexercise net protein synthesis in human muscle from orally administered amino acids. Am J Physiol Endocrinol Metab 276: E628–E634, 1999 [DOI] [PubMed] [Google Scholar]
- 34.Tipton KD, Wolfe RR. Exercise, protein metabolism, and muscle growth. Int J Sport Nutr Exerc Metab 11: 109–132, 2001 [DOI] [PubMed] [Google Scholar]
- 35.Vary TC, Kimball SR. Sepsis-induced changes in protein synthesis: differential effects on fast- and slow-twitch muscles. Am J Physiol Cell Physiol 262: C1513–C1519, 1992 [DOI] [PubMed] [Google Scholar]
- 36.Vary TC, Siegel JH, Tall BD, Morris JG, Smith JA. Inhibition of skeletal muscle protein synthesis in septic intra-abdominal abscess. J Trauma 28: 981–988, 1988 [DOI] [PubMed] [Google Scholar]
- 37.Wagenmakers AJ. Muscle amino acid metabolism at rest and during exercise: role in human physiology and metabolism. Exerc Sport Sci Rev 26: 287–314, 1998 [PubMed] [Google Scholar]
- 38.Wolfe RR, Chinkes DL. Isotope Tracers in Metabolic Research. Hoboken, NJ: John Wiley & Sons, 2005
- 39.Yang D, Diraison F, Beylot M, Brunengraber DZ, Samols MA, Anderson VE, Brunengraber H. Assay of low deuterium enrichment of water by isotopic exchange with [U-13C3]acetone and gas chromatography-mass spectrometry. Anal Biochem 258: 315–321, 1998 [DOI] [PubMed] [Google Scholar]
- 40.Yuan CL, Sharma N, Gilge DA, Stanley WC, Li Y, Hatzoglou M, Previs SF. Preserved protein synthesis in the heart in response to acute fasting and chronic food restriction despite reductions in liver and skeletal muscle. Am J Physiol Endocrinol Metab 295: E216–E222, 2008 [DOI] [PMC free article] [PubMed] [Google Scholar]