

Abstract
Follistatin-like 1 (Fstl1) is a distantly related homolog of the Activin and Bone Morphogenetic Protein antagonist Follistatin. Interestingly, this molecule also has homology with the extracellular matrix modifying protein BM-40/SPARC/osteonectin. Previous studies in chick have identified Fstl1 as a regulator of early mesoderm patterning, somitogenesis, myogenesis and neural development. In this study, we determine the developmental expression pattern of Fstl1 during mouse development. We find that Fstl1 is ubiquitously expressed in the early embryo, and that expression becomes regionalized later during development. In the majority of tissues, Fstl1 is strongly expressed in the mesenchymal component and excluded from the epithelium. Notable exceptions include the central nervous system, in which Fstl1 expression is entirely absent with the exception of the choroid plexi and floor plate, the lung, in which Fstl1 expression can be seen in airway epithelia and the kidney, in which collecting ducts and nascent nephron epithelia express the highest levels of Fstl1.
Keywords: Follistatin, activin antagonist, BMP antagonist, bone development, gonad development, gut development, heart development, kidney development, limb development, lung development, neural development, skin development, tooth development
1. Results and Discussion
The Activin and Bone Morphogenetic Protein (BMP) antagonist Follistatin plays an essential role during mouse embryogenesis, regulating development of musculature, skin, palate and teeth (Matzuk et al., 1995). Furthermore, Follistatin plays a key role in regulating folliculogenesis in the adult female (Jorgez et al., 2004). A number of homologs of this developmentally important gene have been identified since completion of the mouse genome sequence (Fig. 1A). Although distantly related, they are classified as belonging to the Follistatin family based on the presence of a conserved Follistatin (FS) domain (Fig. 1B). Biochemical analyses of the Follistatin-like 3 (Fstl3) member show that this protein acts as an antagonist of Activin signaling, demonstrating functional homology with Follistatin (Sidis et al., 2006). RNA knock-down experiments in chick have identified developmental roles for Follistatin-like 1 (Fstl1, syn TSC-36, Flik), differing significantly from those of Follistatin. Fstl1 is involved in early mesoderm patterning, somitogenesis, myogenesis and neural development (Amthor et al., 1996; Patel et al., 1996; Towers et al., 1999). In zebrafish, morpholino knock-down studies show that the zFstl2 homolog of mouse Fstl1 acts together with Chordin and Noggin to establish the dorso-ventral body axis (Dal-Pra et al., 2006), arguing that Fstl1 acts as a BMP antagonist. However, in addition to homology with Follistatin (Fig. 1B), Fstl1 contains regions of homology with the BM-40/SPARC/osteonectin protein (Hambrock et al., 2004). BM-40 is an extracellular matrix modifying protein that binds collagen I-IV, nidogen and thrombospondin, and also antagonizes the activities of PDGF and VEGF growth factors (Brekken and Sage, 2000). Functional conservation of these properties are unclear however as Fstl1 lacks key BM-40 family characteristics such as calcium binding (Hambrock et al., 2004). Fstl1 is inducible by TGFβ (Shibanuma et al., 1993) and estrogen (Ohashi et al., 1997), and has been identified as a potential tumor suppressor (Hodgson et al., 2001). Expression of Fstl1 is reduced in human cancer cell lines (Hambrock et al., 2004; Mashimo et al., 1997; Sumitomo et al., 2000) and experimentally transformed cells (Johnston et al., 2000). Reintroduction of Fstl1 to transformed cells reduces proliferation (Sumitomo et al., 2000) and invasion (Johnston et al., 2000), suggesting that mechanisms of Fstl1 action during embryonic development may be to inhibit cell growth and migration. These actions could be due either to antagonism of Activin/BMP signals which are proliferative in some developmental contexts, or to modification of the extracellular matrix environment. To define the expression of this potentially important developmental regulator during mouse embryogenesis, we performed in situ hybridization using a Fstl-1 specific riboprobe on a time-course of embryonic tissues from E7.5 to E17.5, and adult ovary.
Figure 1. Similarities between Follistatin (Fst) and its homologs.
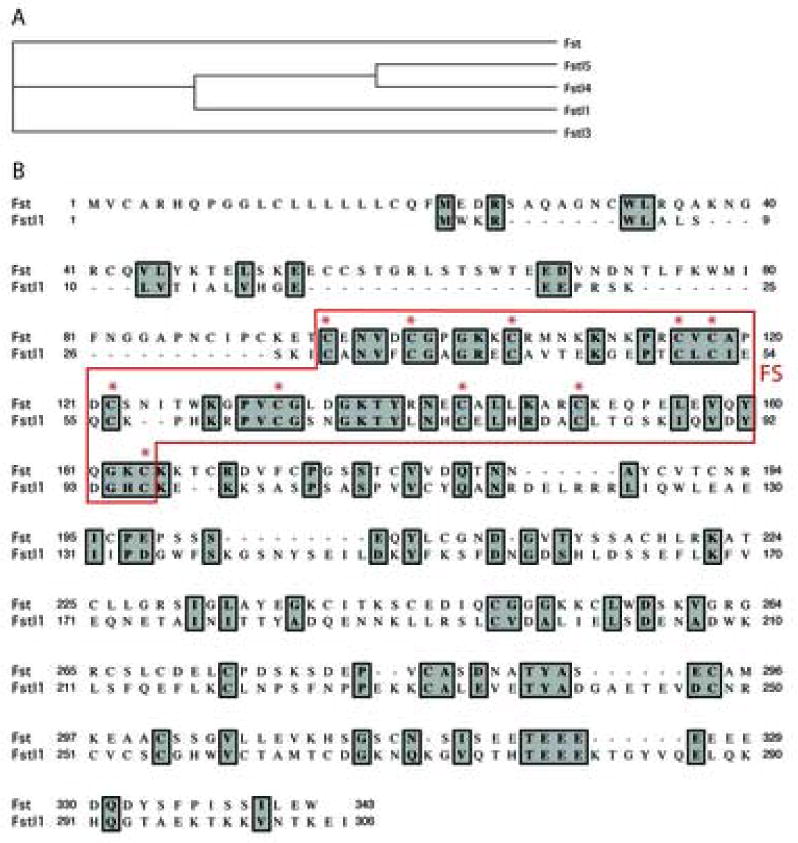
A: Phylogenetic relationships between Follistatin (Fst) and Follistatin-related (Fstl) proteins. Fstl1 displays greater similarity to Fstl4 and Fstl5 than Follistatin. Phylogenetic relationships were calculated using the neighbor joining method and bootstrapped with 1,000 repetitions. B: Fst displays weak homology with Fstl1 at the amino acid level. Overall, amino acid identity is 22%, and similarity is 36%. Conserved cysteines within the Follistatin homology domain (FS, red box) are marked with asterisks. Alignment was performed using the Clustal W algorithm.
1.1 Early embryonic expression
Fstl1 is expressed throughout the E7 embryo, and excluded from extra-embryonic tissues (Fig. 2B). At E9.5, ubiquitous expression is largely maintained, with the exception of the developing nervous system. Fstl1 is specifically expressed in the floorplate throughout the neural tube (Fig. 2D-E) with dorsal aspects lacking expression. Expression differs slightly in the forebrain (Fig. 2D), in which Fstl1 can be seen in sections of the roof-plate. At this stage, the optic vesicles also completely lack Fstl1. The dermomyotome of somites and pronephric ducts display notably high levels of Fstl1 expression at E9.5 (Fig. 2D).
Figure 2. Generalized expression of Fstl1 during early embryogenesis.
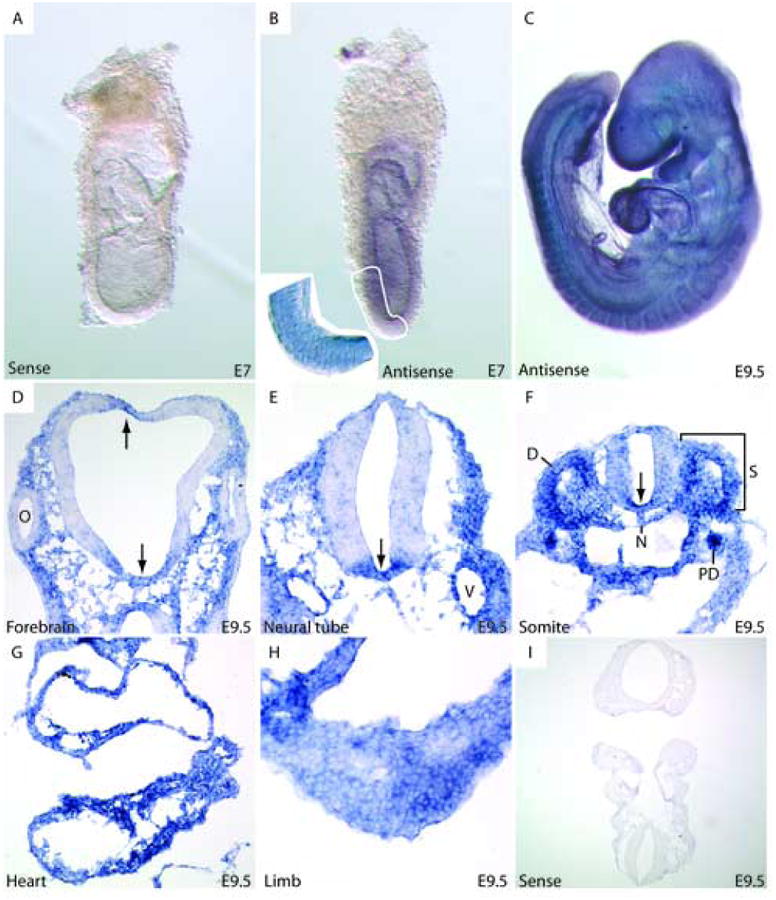
A, B: Whole-mount in situ hybridization for Fstl1 shows generalized embryonic expression at E7. Sectioning demonstrates expression in all three germ-layers (inset). C: General low-level expression is maintained in the E9.5 embryo. However, differential expression can be seen at this stage in: D: Forebrain, E, F: Neural tube. Arrows indicate regions of Fstl1 expression within the central nervous system. F: Fstl1 is expressed in somites, with strong expression in dermomyotome. The pronephric duct displays high-level Fstl1 expression. G: Expression is uniform throughout the heart at this stage. H: Expression can be seen throughout the mesenchyme of the developing forelimb bud. I: Sense control showing specificity of the antisense riboprobe. D: dermomyotome, N: notochord, O: optic vesicle, PD: pronephroc duct, S: somite, V: blood vessel.
1.2 Expression at mid-gestation
The ubiquitous early developmental expression of Fstl1 resolves during mid-gestation (Fig. 3A-C). Expression is entirely absent in the E12.5 embryonic liver (Fig. 3A) and regions of the central nervous system (Fig. 3B). In other organ systems, Fstl1 expression is expressed differentially in a variety of cell types (Fig 3D-L).
Figure 3. Regionalized expression of Fstl1 during mid-gestation.

A-C: Serial sagittal sections show expression in the majority of the embryo with the exception of liver, central nervous system and peripheral nervous system. D-F: Expression in the central nervous system is limited to the floor plate and choroid plexus. G: Expression is largely absent from the lens and neural retina of the developing eye, but can be seen in the surrounding pigmented epithelium and optic stalk. H: Fstl1 is expressed in the mesenchyme but not the epithelium of the developing inner ear. I: Fstl1 is not expressed in the olfactory epithelium, but strongly expressed in surrounding mesenchyme. J: Fstl1 is not expressed in dorsal root ganglia, but is expressed in the surrounding mesenchyme. Cartilage primordia of developing vertebrae do not express Fstl1. K: Strong generalized expression can be seen in limb mesenchyme. However, expression is absent in precartilage condensates. L: Fstl1 is not expressed in condensing cartilage of developing long bones, but is strongly expressed in surrounding mesenchyme. DRG: dorsal root ganglion, E: epithelium, FP: floor plate, G: gut, H: Heart, K: kidney, L: liver, Le: lens, LM: limb mesenchyme, Lu: lung, M: mesenchyme, NR: neuroretina, OS: optic stalk, PC: precartilage condensate, PE: pigmented epithelium, R: radius, U: ulna, V: vertebra. Scale bars represent 100μms.
1.3 Central and peripheral nervous systems
The ventral localization of Fstl1 is maintained in E12.5 neural tissue, with extensive expression in the floor-plate (Fig. 3D, E). Furthermore, domains of expression can be seen dorsally in the choroid plexi (Fig. 3F). Sensory organs display differential Fstl1 expression, with the developing eye showing strong Fstl1 expression in the pigmented epithelium and optic stalk, and very weak generalized expression (Fig. 3G). In the inner ear, Fstl1 is strongly expressed in the mesenchyme and weakly expressed in the sensory epithelium (Fig. 3H). Similarly, the olfactory epithelium does not express Fstl1, whereas it is strongly expressed in the surrounding mesenchyme (Fig. 3I). In the peripheral nervous system Fstl1 expression is low to absent in dorsal root ganglia and strong in surrounding mesenchyme (Fig. 3J).
1.4 Skeletal system
Fstl1 is expressed in limb mesenchyme from E9.5 onward (Fig. 2H), but is absent from condensing precartilaginous chondrocytes in digits (Fig. 3K) and long bones (Fig. 3L). A similar expression pattern is seen in developing vertebrae (Fig. 3J).
1.5 Circulatory system
Expression of Fstl1 is ubiquitous in the heart at E9.5 (Fig. 2G), but becomes regionalized at E12.5 (Fig. 3B, C, 4A). While expression is low in the atria and ventricles, it remains high specifically in the outflow tract (Fig. 4A). Fstl1 is expressed in vessel walls from E9.5 onward (Figs. 2E, 3C, 4B-F). Comparison of adjacent sections stained for Fstl1 (Fig. 4C), hematoxylin and eosin (H&E) (Fig. 4D), α-smooth muscle actin (α-sma), a smooth muscle marker (Fig. 4E) and CD31, an endothelial cell marker (Fig. 4F) shows that Fstl1 is expressed in both endothelium and smooth muscle cells of developing vessels. Expression cannot be detected in circulating blood cells (Fig. 4B, C).
Figure 4. Fstl1 is expressed regionally in the developing heart, and throughout the blood vessel wall.

A: Low-level generalized expression can be seen in the E12.5 heart, with strong expression in the outflow tract. B: The E12.5 dorsal aorta shows Fstl1 expression in the vessel wall (square bracket). C: Fstl1 expression in the E12.5 vessel wall. D: H&E stained adjacent section showing differential morphology of smooth muscle and endothelial cells. E: α-sma immunostained adjacent section showing that Fstl1 expression overlaps with smooth muscle. F: CD31 immunostained adjacent section showing that Fstl1 expression also overlaps with endothelium. E: endothelial cell, OT: outflow tract, SM: smooth muscle cell, VW: vessel wall. Scale bars represent 50μms
1.6 Gut
In the developing gut, Fstl1 expression is limited to mesenchyme, and excluded from epithelium (Fig. 5A, B). Interestingly, adjacent sections stained for α-sma (Fig, 5C) and CD31 (Fig. 5D) demonstrate that Fstl1 expression is highest in the sub-epithelial vascular presumptive lamina propria and in the mesothelium surrounding the gut, but low or absent in developing smooth muscle.
Figure 5. Fstl1 is expressed in the mesenchyme but not the epithelium of the developing gut.
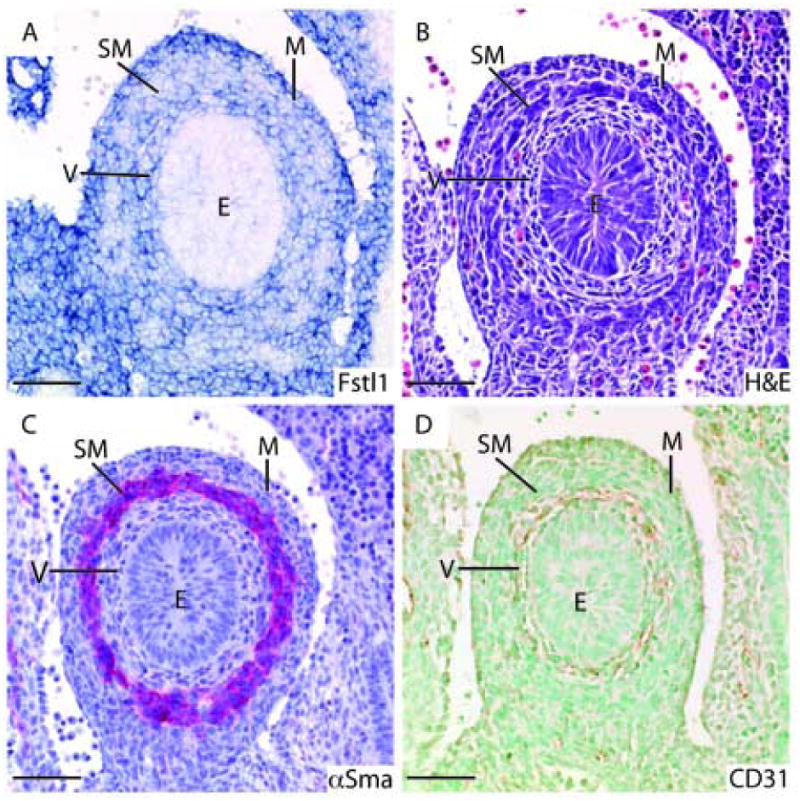
A: Fstl1 is not expressed in the epithelium of the E12.5 gut, but is expressed in the surrounding mesenchyme. B: H&E staining of an adjacent section shows the distinct cell layers of the developing gut: the vessel rich presumptive lamina propria, the smooth muscle layer, and the outer mesothelial layer. C: α-sma stained adjacent section shows that regions of reduced or absent Fstl1 expression in the gut mesenchyme correspond to the smooth muscle layer. D: CD31 stained adjacent section shows that sub-epithelial Fstl1 staining corresponds to the vessel-rich presumptive lamina propria. E: epithelium, M: mesothelium, SM: smooth muscle, V: vascular presumptive lamina propria. Scale bars represent 50μms.
1.7 Lung
The developing lung shows a generalized expression of Fstl1 at E12.5 (Fig. 3A, B) and E14.5 (Fig. 6A, B), with high levels in lung mesenchyme surrounding airways (Fig. 6A). α-sma and CD31 staining of adjacent sections shows that this high-level expression is within the smooth muscle layer surrounding airways, as well as in walls of blood vessels. Furthermore, CD31 staining shows a distribution of endothelial cells throughout the mesenchyme that closely correlates with the distribution of Fstl1-stained cells, indicating that mesenchymal Fstl1 expression is localized to vasculature developing around alveoli (Fig. 6A, D). At E17.5, our expression analysis indicates that Fstl1 expression is weak in airway smooth muscle, remains in endothelial cells surrounding alveoli and is localized to goblet cells of the airway epithelium and blood vessel walls (Fig. 6E-H).
Figure 6. Fstl1 is expressed in airway smooth muscle and goblet cells of the respiratory epithelium.

A: Fstl1 expression is generalized in the E14.5 lung, with strong expression in the mesenchyme surrounding the larger airways. B: H&E stained adjacent sections shows distinct morphologies of airway epithelium, sub-epithelial mesenchyme and general lung mesenchyme. C: α-sma stained adjacent section shows that sub-epithelial Fstl1 staining overlaps with airway smooth muscle in addition to vascular smooth muscle. D: CD31 stained adjacent section shows widespread distribution of endothelial cells in the lung mesenchyme, with which Fstl1 expression overlaps. E: In addition to endothelial localization, E17.5 sections show that Fstl1 is expressed in specific cells of the developing airways. Inset shows expression specifically in highly vacuolated goblet cells of the airway epithelium (arrows). F: H&E stained adjacent section shows that Fstl1 expression in airway epithelium corresponds to heavily vacuolated goblet cells. G: α-sma stained adjacent section shows that airway smooth muscle expression of Fstl1 is less prominent at E17.5 than at E14.5. H: CD31 stained adjacent section shows that Fstl1 expression overlaps with widely distributed endothelial cells surrounding alveoli, and also blood vessel walls. A: airways, GC: goblet cells, SM: smooth muscle, V: blood vessel. Scale bars represent 100μms.
1.8 Kidney
In the kidney, expression is generalized at E12.5 and E14.5 (Fig. 3B, 7A, A′), with regions of intense expression. Collecting ducts express strongly, with tips showing more intense staining than trunks (Fig. 7A, A′, B, B′). Expression is however entirely absent from the nephron progenitor cell population or nephrogenic mesenchyme (Fig. 7B, B′). Expression is dynamic in the developing nephron, initiating late during the renal vesicle stage (Fig. 7B, B′, 7C, C′). Strong expression is seen in the S-shaped body (Fig. 7D, D′) and later throughout the nascent nephron tubule (Fig. 7E, E′). At E17.5, nephrons have matured and regionalized to proximal and distal tubules (Fig. 7F). Staining of adjacent sections with lotus lectin (LTL), a marker for proximal tubule, and dolichos bifloris lectin (DBA), a collecting duct marker, shows that Fstl1 expression is maintained in collecting ducts (Fig. 7G, H) but completely absent from proximal tubules (Fig. 7G, I). Fstl1 expression is also completely absent from the glomerulus (Fig. 7F, G).
Figure 7. Fstl1 is dynamically expressed in nephrons of the developing kidney.

A, A′: In the E14.5 kidney, weak generalized expression can be seen, with high level expression in collecting ducts and nascent nephrons but not in the nephrogenic mesenchyme. At this time-point expression is localized to collecting duct tips but not trunks. B, B′: Expression is absent from nephrogenic mesenchyme and early stage renal vesicles. C, C′: Later stage renal vesicles show Fstl1 expression. D, D′: Expression is strong in the S-shaped body. E, E′: Expression is strong in the nascent nephron. F, G: Expression is highly regionalized in the E17.5 kidney. H: DBA lectin stained adjacent sections shows that Fstl1 expression corresponds to collecting ducts. I: Lotus lectin stained adjacent section shows that Fstl1 expression is completely absent from proximal tubules. Note also that expression is completely absent from the glomerulus. CD: collecting duct, G: glomerulus, NT: nephron tubule, NM: nephrogenic mesenchyme, PT: proximal tubule, RV: renal vesicle, S: S-shaped body, V: blood vessel. Scale bars represent 50μms.
1.9 Gonads
Developmental expression of Fstl1 is limited to the interstitial/stromal compartment of both testes and ovaries, and cannot be detected in germ cells (Fig. 8A, B, C). In the adult ovary, Fstl1 expression can be seen in cells surrounding primary follicles, and low-level expression can be detected in granulosa cells of secondary follicles (Fig. 8D).
Figure 8. Fstl1 expression is regionalized in embryonic and adult gonads.

A, B: Fstl1 is expressed in both epididymus and testis of the E17.5 gonad, with expression limited to interstitial cells, and excluded from seminiferous tubules. C: In the E17.5 ovary, expression is limited to the stromal cell compartment. D: In the adult ovary, Fstl1 can be seen in cells surrounding primary follicles, and is weakly expressed in granulosa cells. CL: corpus luteum, EP: epididymus, GC: granulosa cells, IC: interstitial cells, OC: ovum cluster, PF: primary follicle, S: stroma, SF: secondary follicle, ST: seminiferous tubule, T: testis. Scale bars represent 100μms.
1.10 Integumentary and dental structures
In embryonic skin, Fstl1 is expressed in dermis and subcutaneous connective tissue but not expressed in the epidermal layer (Fig. 9A, B). In the hair follicle, Fstl1 is expressed at the hair germ stage, and later becomes localized more specifically to the dermal papilla, with no detectable expression in hair shaft or hair sheaths (Fig. 9A, B).
Figure 9. Fstl1 is expression in developing skin and teeth.
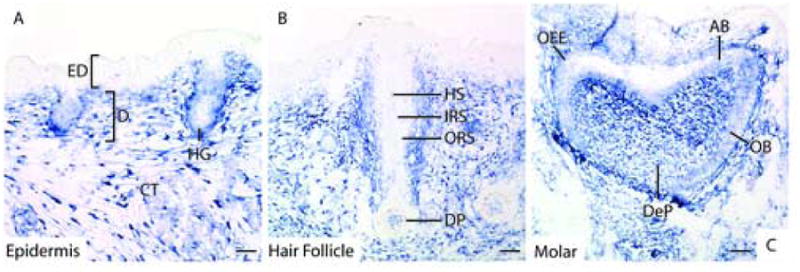
A: Fstl1 is expressed in connective tissue and dermis, and not in the epidermal layer of the skin. Expression can also be seen in hair germs. B: In the hair follicle, Fstl1 expression is limited to the dermal papilla, and cannot be seen in hair sheath, inner or outer root sheaths. C: In developing teeth, Fstl1 is strongly expressed in the dental papilla and moderately expressed in odontoblasts, ameloblasts and outer enamel epithelium. AB: ameloblast, CT: connective tissue, D: dermis, DeP: dental papilla, DP: dermal papilla, ED: epidermis, HG: hair germ, HS: hair shaft, IRS: inner root sheath, OB: odontoblast, OEE: outer enamel epithelium, ORS: outer root sheath. Scale bars represent 100μms.
Developing teeth express Fstl1 in a regionalized manner, with strong expression in the dental papilla, and weaker expression in odontoblasts, ameloblasts and outer enamel epithelium (Fig. 9C).
In summary, Fstl1 expression is generalized within the early embryo, but becomes limited largely to mesenchymal tissues at later stages. Notable exceptions are the central nervous system, in which expression is localized to the floor plate and choroid plexi, the lung in which epithelial cells of the airways express Fstl1 strongly, and the developing kidney in which epithelial structures such as collecting ducts and developing nephrons strongly express Fstl1. Fstl1 expression is dynamically regulated during organogenesis of the latter two organs. In the lung, early airway smooth muscle expression is augmented by expression in mucus-producing cells of the airway epithelium. In the kidney, nephron progenitor cells entirely lack Fstl1 expression. However, Fstl1 expression is seen upon epithelialization of the progenitors and throughout the development of the nephron, but is absent from mature nephrons and glomeruli.
2. Experimental procedures
2.1 Mouse embryos
Mouse embryos of the ICR strain were used for all experiments & the day of vaginal plug was recorded as embryonic day 0.5.
2.2 In situ hybridization probe
PCR derived DNA template was made using the following primers containing the promoter sequences for the T7 and T3 RNA polymerase (in bold) and were designed to amplify a segment of exons 6 through 9 from embryonic cDNA: Fstl1T7: 5′-CAGAGATGCA TAATACGACT CACTATAGGG AGAGCTTCCA AGAGTTCCTC AAGTGC-3′, Fstl1T3: 5′-CCAAGCCTTC ATTAACCCTC ACTAAAGGGA GACGATGCTG TTTCCTTAGT TGCC-3′. Sense (T7) and antisense (T3) probes were generated using the Roche DIG RNA Labeling Mix according to the manufacturer's instructions.
2.3 In situ hybridization
Whole mount and non-radioactive section in situ hybridizations were performed as previously described (Oxburgh et al., 2004).
2.4 Immunostaining and lectin staining
Immunostaining and lectin staining were performed on sections adjacent to those used for in situ hybridization as previously described (Oxburgh and Robertson, 2002).
Acknowledgments
Many thanks to the histopathology core at Maine Medical Center Research Institute for tissue processing services. The project described was supported by Grant Number P20 RR18789 from the National Center for Research Resources (NCRR), a component of the National Institutes of Health (NIH). Its contents are solely the responsibility of the authors and do not necessarily represent the official views of NCRR or NIH
Footnotes
Publisher's Disclaimer: This is a PDF file of an unedited manuscript that has been accepted for publication. As a service to our customers we are providing this early version of the manuscript. The manuscript will undergo copyediting, typesetting, and review of the resulting proof before it is published in its final citable form. Please note that during the production process errors may be discovered which could affect the content, and all legal disclaimers that apply to the journal pertain.
References
- Amthor H, Connolly D, Patel K, Brand-Saberi B, Wilkinson DG, Cooke J, Christ B. The expression and regulation of follistatin and a follistatin-like gene during avian somite compartmentalization and myogenesis. Dev Biol. 1996;178:343–62. doi: 10.1006/dbio.1996.0223. [DOI] [PubMed] [Google Scholar]
- Brekken RA, Sage EH. SPARC, a matricellular protein: at the crossroads of cell-matrix. Matrix Biol. 2000;19:569–80. doi: 10.1016/s0945-053x(00)00105-0. [DOI] [PubMed] [Google Scholar]
- Dal-Pra S, Furthauer M, Van-Celst J, Thisse B, Thisse C. Noggin1 and Follistatin-like2 function redundantly to Chordin to antagonize BMP activity. Dev Biol. 2006 doi: 10.1016/j.ydbio.2006.07.002. [DOI] [PubMed] [Google Scholar]
- Hambrock HO, Kaufmann B, Muller S, Hanisch FG, Nose K, Paulsson M, Maurer P, Hartmann U. Structural characterization of TSC-36/Flik: analysis of two charge isoforms. J Biol Chem. 2004;279:11727–35. doi: 10.1074/jbc.M309318200. [DOI] [PubMed] [Google Scholar]
- Hodgson G, Hager JH, Volik S, Hariono S, Wernick M, Moore D, Nowak N, Albertson DG, Pinkel D, Collins C, Hanahan D, Gray JW. Genome scanning with array CGH delineates regional alterations in mouse islet carcinomas. Nat Genet. 2001;29:459–64. doi: 10.1038/ng771. [DOI] [PubMed] [Google Scholar]
- Johnston IM, Spence HJ, Winnie JN, McGarry L, Vass JK, Meagher L, Stapleton G, Ozanne BW. Regulation of a multigenic invasion programme by the transcription factor, AP-1: re-expression of a down-regulated gene, TSC-36, inhibits invasion. Oncogene. 2000;19:5348–58. doi: 10.1038/sj.onc.1203927. [DOI] [PubMed] [Google Scholar]
- Jorgez CJ, Klysik M, Jamin SP, Behringer RR, Matzuk MM. Granulosa cell-specific inactivation of follistatin causes female fertility defects. Mol Endocrinol. 2004;18:953–67. doi: 10.1210/me.2003-0301. [DOI] [PubMed] [Google Scholar]
- Mashimo J, Maniwa R, Sugino H, Nose K. Decrease in the expression of a novel TGF beta1-inducible and ras-recision gene, TSC-36, in human cancer cells. Cancer Lett. 1997;113:213–9. doi: 10.1016/s0304-3835(97)04700-9. [DOI] [PubMed] [Google Scholar]
- Matzuk MM, Lu N, Vogel H, Sellheyer K, Roop DR, Bradley A. Multiple defects and perinatal death in mice deficient in follistatin. Nature. 1995;374:360–363. doi: 10.1038/374360a0. [DOI] [PubMed] [Google Scholar]
- Ohashi T, Sato S, Yoshiki A, Kusakabe M. TSC-36 (follistatin-related polypeptide) gene expression in estrogen receptor positive osteoblastic cell line, CDO7F. Calcif Tissue Int. 1997;61:400–3. doi: 10.1007/s002239900355. [DOI] [PubMed] [Google Scholar]
- Oxburgh L, Chu GC, Michael SK, Robertson EJ. TGFb superfamily signals are required for morphogenesis of the kidney mesenchyme progenitor population. Development. 2004;131:4593–4605. doi: 10.1242/dev.01324. [DOI] [PubMed] [Google Scholar]
- Oxburgh L, Robertson EJ. Dynamic regulation of Smad expression during mesenchyme to epithelium transition in the metanephric kidney. Mech Dev. 2002;112:207–11. doi: 10.1016/s0925-4773(01)00648-7. [DOI] [PubMed] [Google Scholar]
- Patel K, Connolly DJ, Amthor H, Nose K, Cooke J. Cloning and early dorsal axial expression of Flik, a chick follistatin-related gene: evidence for involvement in dorsalization/neural induction. Dev Biol. 1996;178:327–42. doi: 10.1006/dbio.1996.0222. [DOI] [PubMed] [Google Scholar]
- Shibanuma M, Mashimo J, Mita A, Kuroki T, Nose K. Cloning from a mouse osteoblastic cell line of a set of transforming-growth-factor-beta 1-regulated genes, one of which seems to encode a follistatin-related polypeptide. Eur J Biochem. 1993;217:13–9. doi: 10.1111/j.1432-1033.1993.tb18212.x. [DOI] [PubMed] [Google Scholar]
- Sidis Y, Mukherjee A, Keutmann H, Delbaere A, Sadatsuki M, Schneyer A. Biological activity of follistatin isoforms and follistatin-like-3 is dependent on differential cell surface binding and specificity for activin, myostatin, and bone morphogenetic proteins. Endocrinology. 2006;147:3586–97. doi: 10.1210/en.2006-0089. [DOI] [PubMed] [Google Scholar]
- Sumitomo K, Kurisaki A, Yamakawa N, Tsuchida K, Shimizu E, Sone S, Sugino H. Expression of a TGF-beta1 inducible gene, TSC-36, causes growth inhibition in human lung cancer cell lines. Cancer Lett. 2000;155:37–46. doi: 10.1016/s0304-3835(00)00407-9. [DOI] [PubMed] [Google Scholar]
- Towers P, Patel K, Withington S, Isaac A, Cooke J. Flik, a chick follistatin-related gene, functions in gastrular dorsalisation/neural induction and in subsequent maintenance of midline Sonic hedgehog signalling. Dev Biol. 1999;214:298–317. doi: 10.1006/dbio.1999.9421. [DOI] [PubMed] [Google Scholar]