Abstract
Two kinds of evidence suggest that female fertility may end at an earlier age in modern people than in ancestral populations or in our closest living relatives, chimpanzees. We investigate both to see whether fertility schedules or ovarian follicle counts falsify the alternative hypothesis that the age of terminal fertility changed little in the human lineage while greater longevity evolved due to grandmother effects. We use 19th century Utah women to represent non-contracepting humans, and compare their fertility by age with published records for wild chimpanzees. Then we revisit published counts of ovarian follicular stocks in both species. Results show wide individual variation in age at last birth and oocyte stocks in both humans and chimpanzees. This heterogeneity, combined with interspecific differences in adult mortality, has large and opposing effects on fertility schedules. Neither realized fertility nor rates of follicular atresia stand as evidence against the hypothesis that ages at last birth changed little while greater longevity evolved in our lineage.
Keywords: grandmother hypothesis, fertility decline, menopause, heterogeneity, follicular depletion, chimpanzee comparisons
Introduction
Women usually outlive their fertility by decades, a feature often described as the distinctively human mid-life menopause. Williams1 famously proposed that earlier fertility termination evolved in humans as a consequence of other evolutionary changes that made late births increasingly risky. Now we know that ages at last birth are similar in humans and the other living great apes.2 Childbearing years extend into the 40s, and end there—medical interventions notwithstanding—in our own species and our closest living relatives. We also know that long adult lifespans distinguish us from other apes.2 This is regularly obscured by inferences from the global increases in human life expectancies since the mid-19th century. Many assume—erroneously—that when average lifespan is less than 50 there must be few old people. Instead, the global increases in life expectancies to the mid-20th century were largely driven by declines in infant and juvenile mortality.3 Hunter-gatherers provide a key line of evidence about the mortality experience humans faced before the origins of agriculture about 10,000 years ago. Among the best-studied hunter-gatherer populations life expectancies at birth are less than 40 years, yet for the girls who survive to adulthood, most—63–77%—outlive the childbearing years.4–7
Consistent with those findings, an alternative hypothesis about the evolution of human life history proposes that grandmother effects increased longevity in our lineage without changes in the age of female fertility decline.8,9 A key stimulus to this grandmother hypothesis was the economic productivity of older women among Hadza hunter-gatherers.10 The subsidies these elders provided for young children whose mothers were nursing a new infant suggested a similar role for ancestral grandmothers when ecological changes in the Plio-Pleistocene reduced the availability of foods youngsters could handle for themselves.11 Those ecological changes opened a novel fitness window for females whose own fertility was declining. By subsidizing their grandchildren they also enhanced the fertility of their daughters. Through those grandmother effects, more robust elders, able to help more, left more descendants.
However, some observations seem inconsistent with that grandmother hypothesis. Here we consider two that appear initially to support Williams’ “stopping early” hypothesis instead. One is the recent report that free ranging chimpanzees maintain high fertility through age classes that are associated with declining fertility in women.12 Comparisons between humans and chimpanzees are of special relevance for reconstructing human life history evolution2 for at least two reasons. They are our closest living relatives, and, because of similarities in body and brain size, they are the favored model for estimating maturation and aging rates in australopithecines, the fossil genus ancestral to our own.13,14 The evidence that age-specific fertility remains high in chimpanzees long after it starts to decline in women might indicate that humans stop childbearing earlier than chimpanzees do. If so, and if chimpanzees are more similar to our common ancestor, it would contradict the proposition of the grandmother hypothesis that women’s fertility does not end earlier now than in our presapiens past. The other contradiction is an apparently sharp acceleration in the depletion rate of ovarian follicle stocks around the age of 38 in women, a pattern that has been interpreted as evidence of a programmed shift to menopause “20 years early.”15–18
To compare human and chimpanzee fertility schedules we use 19th century records from the Utah Population Database (UPDB)19 to represent natural fertility in humans; and for wild chimpanzees we rely on reports from Boesch and Boesch-Achermann20 from one study site and Emery Thompson et al.12 for a compilation of records from six more. We use a single population to represent the human pattern because the decline in age-specific fertility is very similar among natural fertility human populations, including women in the UPDB.21 The Utah database has the great advantage for our inquiry of both large size necessary for assessing demographic parameters and of individual records that allow us to investigate associations between one’s fertility rate and her age at last birth. Both humans and chimpanzees display wide individual variation in these features and in both species this heterogeneity in fertility is associated with variation in survival rates.12,22–27 However, adult mortality is much lower in human populations than in chimpanzees.28 We show that because of this difference in mortality (women usually outlive the childbearing ages and chimpanzees do not), heterogeneity has opposing effects on age-specific fertility rates (ASFRs) through the fourth and fifth decade—the 30s and 40s—in these two species.29
Then we turn to the available data on oocyte counts with age. All mammalian females develop a fixed stock of oocytes near the time of birth that is subsequently depleted almost entirely by atresia throughout juvenile and adult life.16 The issue here is the biphasic model proposed to characterize depletion rates in women. In the most widely cited model, an initial exponential rate of loss persists to the late 30s and then accelerates to reduce stocks to menopause levels around the age of 50.15,30,31 The sharp rate change in the late 30s is interpreted as possible evidence of a shift from later ages of menopause in the past.15–18 More than 10 years ago, Leidy et al.32 pointed out that a biphasic model that best fits all the human data has an inflexion point not at 38 but 10 years later, much closer to the average age at menopause. Their analysis justified comparison of chimpanzee and human follicular depletion rates with simple exponential models across the age range from birth to 47 years.33 Both the similarity in rates of decline in humans and chimpanzees and the questionable inflexion point at 38 in humans are relevant here. Leidy et al.32 and others, including Faddy and Gosden17 who were themselves architects of the most widely cited biphasic model, pointed out that a single inflexion point at any age is biologically unrealistic. More recently Hansen et al.34 have published new follicle counts and shown that a power function is a better fit for the decline with age in both the new cases and those previously analyzed. However as they note, the wide variation in counts for women of the same age makes their power model “inadequate for predicting the reproductive lifespan for an individual” (p. 706).34 The individual variation in fertility rates and age at last delivery highlighted here underscore that caveat.
Our analyses can not demonstrate that fertility decline in modern women remains at ancestral ages. We nonetheless conclude that available data are best interpreted as evidence against the stopping early hypothesis. Instead they are consistent with a parsimonious inference of the grandmother hypothesis that greater longevity evolved in the human lineage while fertility declines with age changed little from our last common ancestor with other great apes.
Age-specific fertility
Records of ASFRs are far richer for humans than for any other primate. While fertility levels in our species vary widely, the changes in rate by age take characteristic shapes depending on whether fertility is natural or controlled.21 Controlled fertility reflects practices of family limitation, and results in a concave decline in age-specific fertility as more women reach their desired family sizes. In natural fertility populations, family size limitation is absent and the decline is convex. These two age patterns of decline are strikingly constant across populations,21 with the potential for continued child bearing reflected by actual births in natural fertility populations.
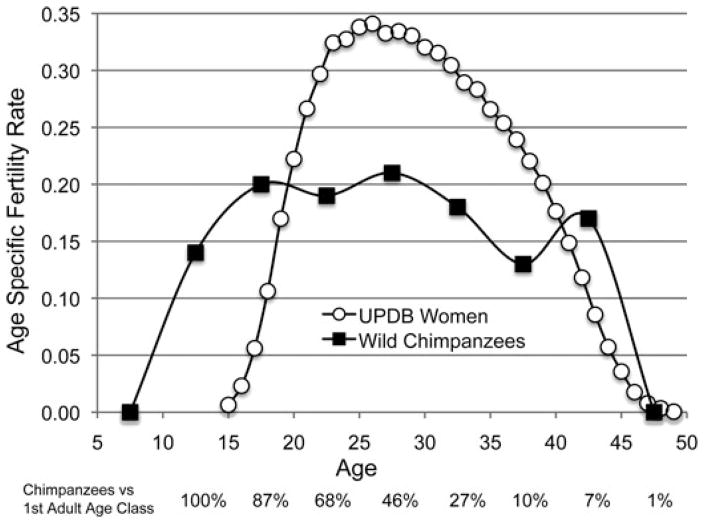
The mid-19th century settlers in Utah (UPDB19), comprising both Mormons and non-Mormons alike, had high fertility as is often found in colonizing populations35,36 and the convex decline of natural fertility. Figure 1 shows the ASFRs of 42,493 parous, monogamously married UPDB women born between 1845 and 1890. To remove the very small influence of divorce and the complications of remarriage for this population, only women who married once are included. To observe completed fertility that is not curtailed by early death and to remove the effects of husband’s death, this analysis also excludes women who died or were widowed at or before the age of 50.
Figure 1.
Natural fertility humans and wild chimpanzees compared. The humans are 42,493 UPDB parous women born 1845–1890 who were monogamously married, neither divorced nor widowed before 50, and lived to at least that age. Chimpanzees are 165 females from four study sites compiled by Emery Thompson et al.12 There are 627.3 risk years in the 10–14 year chimpanzee interval, that dwindle to 7.8 in the 45–49 year interval (Ref. 12 and supplemental data Table S2). The relative number of risk years in each 5-year interval is represented by the percentage relative to the initial adult interval (10–14) below the horizontal axis.
Available samples are always much smaller for chimpanzees. ASFRs for wild chimpanzees from six study sites, based on 165 females12 are also shown in Figure 1. The comparison illustrates some of the differences between humans and other great apes highlighted by the grandmother hypothesis: Humans have later ages at first birth, shorter birth intervals (higher fertility peaks), but similar ages at last birth compared to chimpanzees. In both species fertility approaches zero around the age of 45.
A closer look at the comparison also suggests a difference in the decline with age. Human ASFRs have a peaked shape, beginning to decline around the age of 30 to reach less than a third of maximum in the early 40s. Chimpanzee ASFRs are flat instead, persisting at about the rate reached before the age of 20 for two more decades. The chimpanzee samples are very small and become miniscule at the older ages. The survival restriction imposed on the UPDB women in Figure 1—all survived at least to 50—can not be imposed on the chimpanzees. Along the horizontal axis of Figure 1 we indicate the relative sample size for each 5-year interval in Emery Thompson et al.’s12 chimpanzee compilation as a percentage of the number of risk years in the first adult category. The 627.3 risk years for 10–14 year olds declines to 7.8 risk years in the 45–49 year interval, an index of the slim chance that a young adult female survives the childbearing years (Ref. 12 supplemental information table S2).
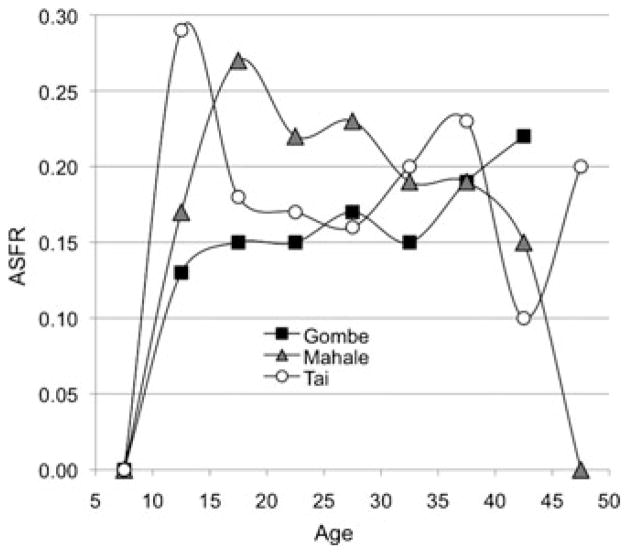
The small sample of chimpanzees, especially at older ages, raises questions about whether the plateau shape might be just an artifact of sample size. To explore that possibility we plot chimpanzee populations separately. Figure 2 shows ASFRs for three chimpanzee study sites. Gombe and Mahale (the two longest running East African sites) are the only populations included in Emery Thompson et al.12 compilation that have more than one individual known to be over 40 years old. The Tai population in the Ivory Coast is not included in that synthesis, but “age-specific fertility does not diminish in Tai chimpanzees” (p. 62).20
Figure 2.
Chimpanzee ASFRs at three study sites. Gombe and Mahale data from Emery Thompson et al.12; Tai data from Boesch and Boesch-Achermann.20
The recurrence of the same trend in all these cases underscores the contrast with humans. As Coale and Demeny37 reported in their classic compendium, “In all [human] populations where reliable records have been kept, fertility is zero until about age 15, rises smoothly to a single peak, and falls smoothly to zero by age 45–50” (p. 35).
Elsewhere29 we elaborated a suggestion about the flat age-specific fertility in wild chimpanzees from Emery Thompson et al.12 They cited correlations between later fertility and longer survival in humans and suggested that similar linked heterogeneity in chimpanzees would mean that especially fertile females are more likely to survive into their late 30s and 40s. If low fertility females die at younger ages, their selective removal increases average fertility rates at older ages—even if the fertilities of the survivors themselves are usually declining from their own rates when younger. We noted a similar bias recognized in assessments of variation in birth intervals with parity in humans.35,36 When women of all parities are pooled, birth intervals can appear to be constant, or even decreasing across parities. This is because women that reach higher parities have shorter intervals, and high parity intervals can only come from those women. Following Emery Thompson et al.,12 we hypothesized that if high fertility chimpanzee females are more likely to survive to older ages, the fertility rates at older intervals come disproportionately from those females because low fertility females have died.
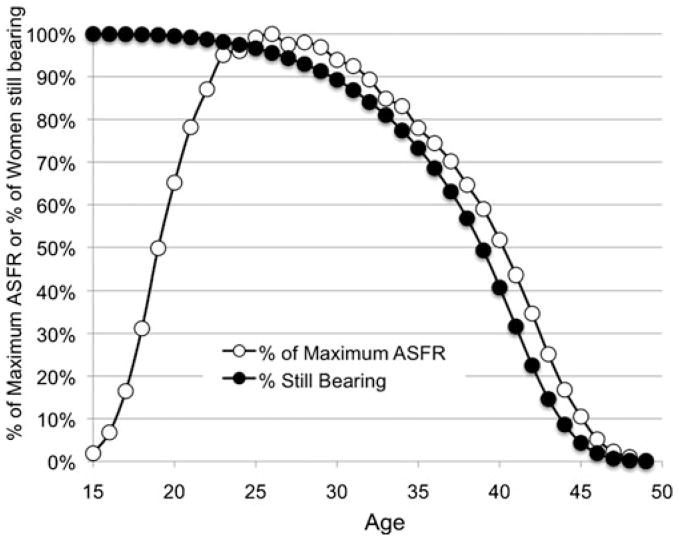
Here we further explore the effects of the difference in adult mortality rates between humans and chimpanzees on ASFRs. Women vary widely in the ages at which they reach physiological thresholds associated with declining fertility.38 Half the women in natural fertility populations have had their last delivery around 40, and reach menopause about 10 years later.38–40 Consider the distribution around those thresholds. For the UPBD women whose age-specific fertility is reported above, Figure 3 plots the proportion of women who have already lived past their last parturition at each age across the child-bearing years (filled circles). More than 10% have no more births after the age of 30, about 27% have no more after 35. ASFRs plotted on the same figure (open circles) show that the downward slope of the ASFR is driven by the increasing proportion of women at each succeeding age who have no more births. This association has been noted in other human populations as well.21,35 While the sloping decline in ASFRs is readily interpreted as similar declining fertility among all women, that inference is incorrect. Instead it is strongly dependent on the expanding fraction of women in these age classes who are no longer bearing offspring.
Figure 3.
Decreasing proportions of women still giving birth drive down human ASFR. Percentage of women not yet past their last delivery and percentage of maximum age-specific fertility by age for 42,493 UPDB parous women born 1845–1890 who were monogamously married, neither divorced nor widowed before 50, and lived to at least that age.
In chimpanzees by contrast, females rarely outlive their own fertility, and those with higher fertility rates live longer. Emery Thompson et al.12 looked for associations between fertility rates and survival in females over the age of 25 by dividing their female observation years from the six-site sample into healthy and unhealthy years. An observation year for a given chimpanzee was considered healthy if she survived an additional 5 years or more, unhealthy if she did not. Their Figure 2 (ref. 12, p. 2152) shows that fertility was about twice as high in females who would survive at least 5 more years than in those who would not. Similar heterogeneity in which those with higher fertility also have later ages at last birth is suggested in the human pattern in Figure 3. At age 39, less than half the women are still delivering (49%), and yet age-specific fertility is 59% of maximum. Women who continue to give birth are doing so almost 20% faster than the overall average at the age of maximum fertility.
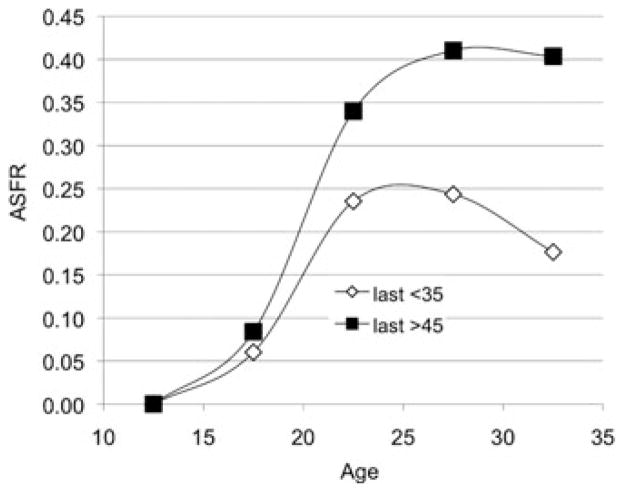
To more directly parallel Emery Thompson’s probe for an association between higher fertility rates and later parturitions in chimpanzees, we divided the Utah women according to their ages at last birth. As Figure 4 shows, the women who bore their last baby before 35 also had lower age-specific fertility in the preceding years than those who continued bearing past 45.
Figure 4.
Women’s fertility rates vary with their ages at last birth. ASFR for two subsets of the 42,493 UPDB parous women born 1845–1890 who were monogamously married, neither divorced nor widowed before 50, and lived to at least that age. Fertility rates before 35 of the women whose fertility ended by 35 (n = 10,440) are compared to the rates at the same ages of the women who were fertile past 45 (n = 2659).
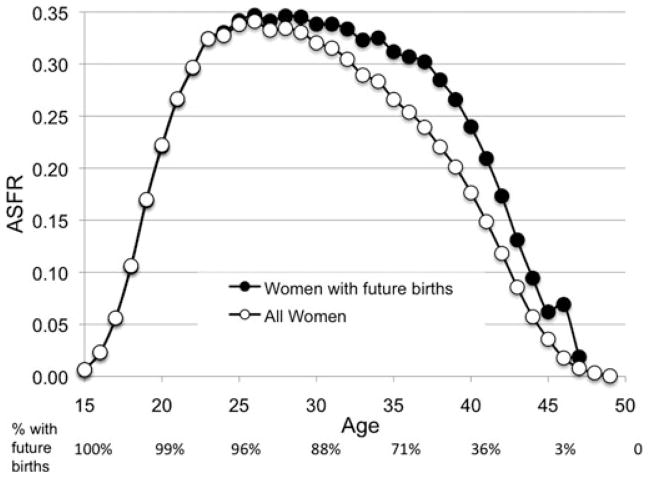
In Figure 5 we compare age-specific fertility at each age to the ASFR of just the women who would still bear offspring beyond that age (filled circles). Women who had last births at a given age (and their last babies) are excluded from this subset to avoid ascertainment bias. Including them would overestimate the fertility of the women continuing to give birth because those women, identified by parturitions at exactly that age, must have an ASFR of 1. The fertility schedule for the subset of women continuing to bear in future is flatter than the usual schedule that includes all the women in each age class (open circles). At the age of 30 the ASFR of those who will continue to have babies past that age is 6% higher than the standard schedule. By 35 the rate of those that will continue is 17% higher; by 40 it is 32% higher. Over the last 3 years for which this subset can be distinguished (ages 45–47), the rate averages 96% higher than the ASFR as usually calculated. Women that continue to breed have a flatter fertility schedule than the standard human schedule for the same reason the chimpanzee schedule is flat. In both species, females that continue bearing to older ages are the ones that produce at higher rates. In chimpanzees, individuals near the end of their fertility are excluded by mortality. Here we have excluded women past their own fertility by manipulation, representing only those with future fertility in the black circles in Figure 5. According to the grandmother hypothesis, those excluded survivors are the evolutionary legacy of ancestral grandmother effects.
Figure 5.
Age-specific fertility for women who will have future births compared to ASFR for all. ASFR for all 42,493 UPDB parous women born 1845–1890 who were monogamously married, neither divorced nor widowed before 50, and lived to at least that age (open circles), and ASFR for just the subset who will still bear offspring beyond each age (filled circles). Percentage of the 42,493 sample who will still deliver at a later age is indicated below the x-axis.
Because chimpanzees, even under the most benign conditions, rarely survive beyond their own fertility, a manipulation to make chimpanzee ASFRs look more human can only be partial. However, captivity provides an opportunity to see what happens to chimpanzee ASFR when mortality is reduced. Higher survival than found in free-ranging populations41 leaves more frail individuals alive at older ages. If, as Emery Thompson et al. have shown,12 frailty affects both fertility and mortality, then more females with lower fertility levels and earlier fertility termination should survive to older ages among captives than survive in the wild. Observations at Taronga Park Zoo accumulated since the mid-1960s are suggestive.42 This population of chimpanzees experienced “conditions of near-optimal nutrition … [and] natural breeding conditions” (p. 282).42 While infant mortality was similar to the wild, “the major contrast is the greater life expectancy for female adults at the zoo” (p. 294).42 The Taronga Park ASFR begins to slope down before the age of 30, more like the usual human ASFR than like the flat schedule for chimpanzees in the wild. This peaked shape is consistent with the expectation of greater heterogeneity when more females survive into their late 30s and 40s. Also consistent with that expectation, pregnancy outcomes in captives show increasing failures with age. Roof et al.43 examined 1255 pregnancies in 272 females from three Primate Research Centers and found a clear rise in spontaneous abortions and stillbirths with increasing maternal age, a result that parallels evidence of increasing fetal loss with increasing age in women.35,44
Follicle stocks
Fertility in all female mammals declines with age as oocyte stocks are depleted.16 Most of the initial stock is lost to atresia. As stocks decline in women, numbers reach thresholds associated first with reduced fecundability, then secondary sterility, and finally menopause at different ages in different individuals.17,45,46 The classic human records of ovarian follicle stocks show that among females of the same age, remaining primordial follicle pools can vary by two orders of magnitude.34,47–50
Recognizing the variation, analysts nevertheless initially characterized the general pattern of follicle depletion in women as “biphasic,” with a sharp acceleration in the rate of loss before menopause. This invited speculation that the acceleration might indicate an evolutionary shift to earlier menopause.15,16,49,50 Recently Cant and Johnstone18 used that inference to support their hypothesis that mid-life menopause evolved in humans when reproductive competition between the generations pushed older ancestral females to terminate their fertility early.
The initial oocyte stock and rate of follicular attrition in human females are commensurate with a longer reproductive life span: specifically, an age at menopause of ~70 years…. The onset of the accelerated phase of reproductive senescence that leads to menopause coincides with the age at which, in natural-fertility populations, human females can first expect to encounter reproductive competition from the next generation…. [This] early reproductive cessation reflects ‘the ghost of reproductive competition past’ (p. 5333–5334).18
The biphasic model15 used by Cant and Johnstone18 found the inflexion point at 37.5 years. As Leidy et al.32 noted, when all the data are included in the sample, the inflexion point in a best-fit biphasic model moves from 37.5 to 48 years. They concluded that,
The data emphatically do not support an abrupt change in the exponential rate of decay at age 37.5. … [But] defending a biphasic model with a critical age of 48 seems equally absurd…. The idea that a process of cellular degeneration that begins at birth, when there are approximately three quarters of a million follicles in the ovaries, and … accelerates in women with 3,000 follicles just as these women approach menopause, seems clinically uninteresting if not biologically implausible (p. 857).32
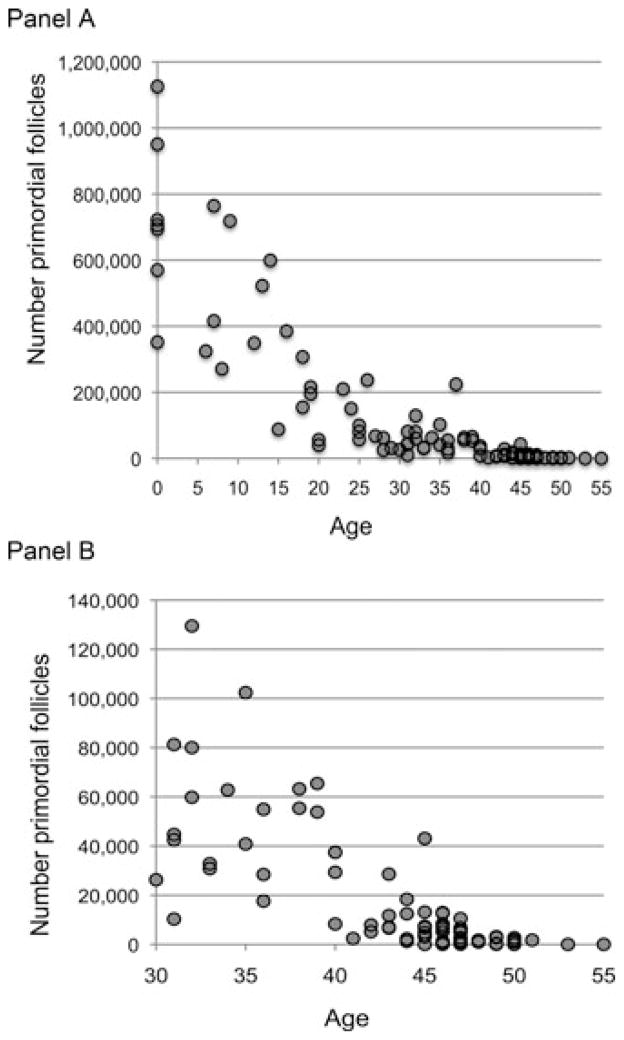
Faddy and Gosden17 themselves noted the biological improbability of a biphasic shift and tailored a subsequent model to the data in which “the step-change in the rate of follicle attrition was replaced by a model which assumed that this rate changes more gradually with the size of the follicle store” (p. 1484). Hansen et al.34 have now shown the fit of a simpler power model. Figure 6 plots the classic follicle counts on original measurement scales, Panel A includes all the cases in the classic data sets, Panel B restricts attention to subjects age 30 and older (excluding one conspicuous outlier from Block’s47 counts visible in Panel A: 224,500 for a 37 year old). This display underscores the wide scatter in the counts across all ages to emphasize the improbability of a widely shared acceleration in the rate of loss at age 37.5.
Figure 6.
Follicle counts in humans by age. Counts are from Block,47,48 Richardson et al.,49 Gougeon et al.50 Panel A includes all cases, Panel B includes all cases for subjects over the age of 30 except one conspicuous outlier from Block’s47 counts evident in Panel A: 224,500 for a 37 year old.
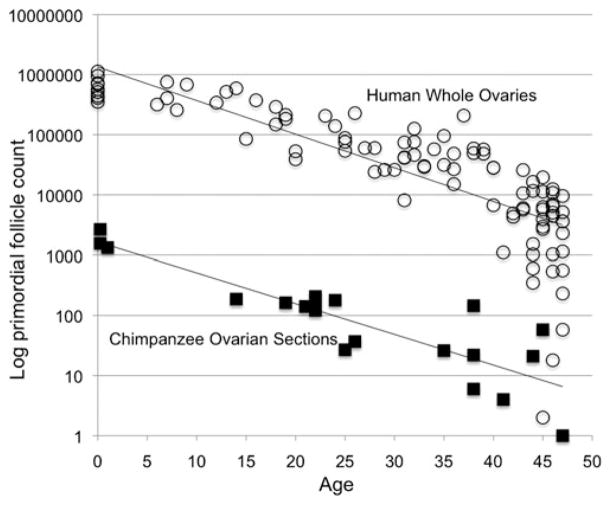
Consider that each count represents one snapshot, of one infant, girl, or woman, along her own interrupted trajectory from a maximum initial stock of oocytes to exhaustion of that stock sometime after the age of menopause. The cross-sectional counts can not reveal individual fertility trajectories. However, they can still be useful for comparing humans to other species. Follicle counts from archived ovarian sections taken at necropsy from captive chimpanzees provide an index of the rate of decline in primordial follicles with age in that species.33 The available sections span the ages of 0–47, a range that falls within the first phase of the Leidy et al.32 observation that a single exponential rate to the age of 48 was a better fit to the human data than a biphasic shift at 37.5. On those grounds we fit single exponential regressions to the follicle counts across the 0–47 age range in both species. Measured this way, across this age range, the decrease in primordial follicle counts with age in the chimpanzee sample is indistinguishable from the rate of depletion with age in classic human data sets (Fig. 7).33
Figure 7.
Follicle stock depletion from birth to age 47 in humans compared to chimpanzees. The human counts are for whole ovaries from the classic sources (open circles),46–49 and the chimpanzee counts are for single ovarian sections taken at chimpanzee necropsies (closed squares),33 displayed here on logarithmic scale. Heights of the lines must differ because a section is only a thin slice of an ovary. The human ovaries contained about 2000 sections per ovary46,48 (see text). Rates of follicular depletion with age are indicated by the slopes of the lines. The slope and 95% confidence interval for whole human ovaries is −0.05594 (−0.06421053, −0.04767339). For the chimpanzee sample of ovarian sections, the slope and 95% confidence interval are −0.05079 (−0.06494935, −0.03662765). These slopes are statistically indistinguishable.33
The intercepts—the heights—of the two regression lines are necessarily different because the chimpanzee counts are for single sections while the human counts are for whole ovaries. Variation in ovary size, section thickness, and estimation protocols make it impossible to specify precisely the fraction of an ovary represented in a section,52 but the order of magnitude of the difference can be estimated. An average section represents about 1/2000 of an average human ovary.47,49 If the single sections were from human ovaries they should differ from whole ovaries by about that much. The difference in heights of the two lines in Figure 7 thus indicates at least an order of magnitude similarity in human and chimpanzee stock sizes. That general similarity and the similar slopes of declining stocks with age are consistent with a wider body of findings, including hormone and cycling data from captivity51,53–55 but see Ref. 56 and the fertility data from the wild discussed above. All suggest that chimpanzees would reach menopause at about the same ages humans do—if they lived long enough.
Discussion
Women’s decline in fertility with age is conventionally represented by fertility rates for each age class, ratios of the number of births to women of that age divided by the number of women in that age class. As we have illustrated with the UPDB data, declines in ASFRs at the population-level are not the same as declines in the fertility of individual women. Human ASFRs fall smoothly from a peak near 30 to reach zero near 45 because increasing proportions of women in these age classes are no longer bearing offspring. Considering only the women who will still give birth in future intervals, the peaked pattern flattens, staying higher at subsequent ages than in the standard fertility schedule. While the birth intervals of the women still breeding increase with parity, their average fertility rate remains higher because lower fertility women leave the risk pool. This clarifies the difference in the shape of the fertility schedules of human and chimpanzee populations. The sloping decline after an earlier fertility peak in humans seems to suggest earlier termination of fertility in humans than in free-ranging chimpanzees who have much flatter ASFRs. However, when the women who have passed their last parturition are removed from subsequent age classes, human ASFRs start to approximate those of chimpanzees. The fact that women usually outlive their fertility makes the shape of the fertility schedule different, even if the fertility declines with age experienced by individuals in both species closely overlap.
Assumptions that ovarian follicular depletion rates show a distinctively sharp acceleration in women in their late 30s provide another line of evidence used to infer that fertility declines in humans are now earlier than they were in ancestral populations. Leidy et al.32 noted that models identifying an inflexion point at 37.5 years have been well received in the medical literature as the timing corresponds with age-related increases detected in chromosomal abnormalities, fetal loss, and rising levels of pituitary FSH. In addition to the evolutionary questions of direct interest here, the influence of the biphasic model on those giving medical advice30,31 is additional reason to highlight the lack of support for it.
Although we discussed, and even engaged in, fitting age-specific curves to the follicle counts ourselves, we nevertheless emphasize their limits. Just as the ratio of births per woman gives the fertility rate of an age interval, but not the fertility rate of the individual women in it, so the central tendency of follicle counts across subjects of the same age is not the same as the counts for individuals. Central tendencies can, however, provide an index for cross-species comparisons. Expanding the sample of counts for humans and especially chimpanzees whenever possible can provide direct evidence for (and against) hypotheses about a derived early fertility decline in humans. Chimpanzee samples currently available indicate similar distributions of follicle stock sizes and similar rates of follicular depletion with age in both species.33
We conclude that neither age-specific fertility trends nor rates of follicular depletion are consistent with the hypothesis that menopause is earlier in women than in our ancestors or our closest living relatives. Of course neither can prove that humans do not stop earlier than our ancestors did. However, for now, the burden of evidence indicates that declines in fertility with age do not differ much between humans and chimpanzees. Similar individual variation in declining fertility that is pruned out by mortality in chimpanzees is preserved by greater longevity in humans. This individual variation, especially important to women who are delaying pregnancy, is obscured by emphasis on average age at last birth or average age at menopause.30,31,38,39 Perhaps paradoxically, a grandmother hypothesis to explain the evolution of human longevity contributes to exploring this heterogeneity in fertility, confirming the continuing utility of this working hypothesis.
Acknowledgments
This study was supported in part by National Science Foundation grant 0850951 (Chimpanzee Reproductive and Physiological Aging) and by National Institute of Aging Grant AG022095 (The Utah Study of Fertility, Longevity, and Aging). The content is solely our responsibility and does not necessarily represent the official views of the supporting agencies. We thank the Pedigree and Population Resource (funded by the Huntsman Cancer Foundation) for its role in the ongoing collection, maintenance and support of the Utah Population Database (UPDB). We also acknowledge Dr. Geraldine P. Mineau and Alison Fraser, MSPH, for their careful management of and assistance with the data used for this study. We are grateful to James Coxworth, Richard Paine, and Alan Rogers for analytical assistance and advice, and thank Jim Herndon and Sarah Hrdy for useful comments. This study in funded by NIH.
Footnotes
Conflicts of interest
The authors declare no conflicts of interest.
References
- 1.Williams GC. Pleiotropy, natural selection, and the evolution of senescence. Evolution. 1957;11:398–411. [Google Scholar]
- 2.Robson SL, van Schaik CP, Hawkes K. The derived features of human life history. In: Hawkes K, Paine RR, editors. The Evolution of Human Life History. School of American Research Press; Santa Fe: 2006. pp. 17–45. [Google Scholar]
- 3.Oeppen J, Vaupel J. Broken limits to life expectancy? Science. 2002;296:1029–1031. doi: 10.1126/science.1069675. [DOI] [PubMed] [Google Scholar]
- 4.Howell N. Demography of the Dobe !Kung. Academic Press; New York: 1979. [Google Scholar]
- 5.Hill K, Hurtado AM. Ache Life History: the Ecology and Demography of a Foraging People. Aldine de Gruyter; New York: 1996. [Google Scholar]
- 6.Blurton Jones NG, Hawkes K, O’Connell JF. Antiquity of postreproductive life: are there modern impacts on hunter-gatherer postreproductive life spans? Am J Hum Biol. 2002;14:184–205. doi: 10.1002/ajhb.10038. [DOI] [PubMed] [Google Scholar]
- 7.Hawkes K, Blurton Jones NG. Human age structures, paleodemography, and the grandmother hypothesis. In: Voland E, Chasiotis A, Schiefenhovel W, editors. Grandmotherhood: the Evolutionary Significance of the Second Half of Life. Rutgers University Press; New Brunswick: 2005. pp. 118–140. [Google Scholar]
- 8.Hawkes K, et al. Grandmothering, menopause, and the evolution of human life histories. Proc Natl Acad Sci USA. 1998;95:1336–1339. doi: 10.1073/pnas.95.3.1336. [DOI] [PMC free article] [PubMed] [Google Scholar]
- 9.Hawkes K. Grandmothers and the evolution of human longevity. Am J Hum Biol. 2003;15:380–400. doi: 10.1002/ajhb.10156. [DOI] [PubMed] [Google Scholar]
- 10.Hawkes K, O’Connell JF, Blurton Jones NG. Hadza women’s time allocation, offspring provisioning and the evolution of post-menopausal lifespans. Curr Anthropol. 1997;38:551–577. [Google Scholar]
- 11.O’Connell JF, Hawkes K, Blurton Jones NG. Grandmothering and the evolution of Homo erectus. J Hum Evol. 1999;36:461–485. doi: 10.1006/jhev.1998.0285. [DOI] [PubMed] [Google Scholar]
- 12.Emery Thompson M, et al. Aging and fertility in wild chimpanzees provide insights into the evolution of menopause. Curr Biol. 2007;17:2150–2156. doi: 10.1016/j.cub.2007.11.033. [DOI] [PMC free article] [PubMed] [Google Scholar]
- 13.Smith BH, Tompkins RL. Toward a life history of the Hominidae. Ann Rev Anthropol. 1995;24:257–279. [Google Scholar]
- 14.Robson SL, Wood B. Hominin life history: reconstruction and evolution. J Anat. 2008;212:394–425. doi: 10.1111/j.1469-7580.2008.00867.x. [DOI] [PMC free article] [PubMed] [Google Scholar]
- 15.Faddy MJ, et al. Accelerated disappearance of ovarian follicles in mid-life: implications for forecasting menopause. Hum Reprod. 1992;7:1342–1346. doi: 10.1093/oxfordjournals.humrep.a137570. [DOI] [PubMed] [Google Scholar]
- 16.vom Saal FS, Finch CE, Nelson JF. Natural history and mechanisms of reproductive aging in humans, laboratory rodents, and other selected vertebrates. In: Knobil E, Neill JD, editors. The Physiology of Reproduction. 2. Raven Press; New York: 1994. pp. 1213–1314. [Google Scholar]
- 17.Faddy MJ, Gosden RG. A model conforming the decline in follicle numbers to the age of menopause in women. Hum Reprod. 1996;11:1484–1486. doi: 10.1093/oxfordjournals.humrep.a019422. [DOI] [PubMed] [Google Scholar]
- 18.Cant MA, Johnstone RA. Reproductive conflict and the separation of reproductive generations in humans. Proc Natl Acad Sci USA. 2008;105:5332–5336. doi: 10.1073/pnas.0711911105. [DOI] [PMC free article] [PubMed] [Google Scholar]
- 19.Bean LL, Mineau GP, Anderton DL. Fertility Change on the American Frontier, Adaptation and Innovation. University of California Press; Berkeley: 1990. [Google Scholar]
- 20.Boesch C, Boesch-Achermann H. The Chimpanzees of the Tai Forest: Behavioural Ecology and Evolution. Oxford University Press; Oxford: 2000. [Google Scholar]
- 21.Wood JW. Fecundity and natural fertility in humans. Oxf Rev Reprod Biol. 1989;11:61–109. [PubMed] [Google Scholar]
- 22.Perls TT, Alpert L, Fretts RC. Middle aged mothers live longer. Nature (London) 1997;389:133. doi: 10.1038/38148. [DOI] [PubMed] [Google Scholar]
- 23.Müller HG, Chiou JM, Carey JR, Wang JL. Fertility and life span: late children enhance female longevity. J Gerontol A Biol Sci Med Sci. 2002;57:B202–B206. doi: 10.1093/gerona/57.5.b202. [DOI] [PubMed] [Google Scholar]
- 24.Smith KR, Mineau GP, Bean LL. Fertility and post-reproductive longevity. Soc Biol. 2002;49:185–205. [PubMed] [Google Scholar]
- 25.Jacobsen BK, Heuch I, Kvale G. Age at natural menopause and all cause mortality: a 37-year follow-up of 19,731 Norwegian women. Am J Epidemiol. 2003;157:923–929. doi: 10.1093/aje/kwg066. [DOI] [PubMed] [Google Scholar]
- 26.Gagnon A, et al. Is there a trade-off between fertility and longevity? A comparative study of women from three large historical databases accounting for mortality selection. Am J Hum Biol. 2009;21:533–540. doi: 10.1002/ajhb.20893. [DOI] [PMC free article] [PubMed] [Google Scholar]
- 27.Smith KR, et al. Familial aggregation of survival and late female reproduction. J Gerontol Biol Sci Med Sci. 2009;64:740–744. doi: 10.1093/gerona/glp055. [DOI] [PMC free article] [PubMed] [Google Scholar]
- 28.Hill K, et al. Mortality rates among wild chimpanzees. J Hum Evol. 2001;39:1–14. [Google Scholar]
- 29.Hawkes K, Smith KR, Robson SL. Mortality and fertility rates in humans and chimpanzees: how within-species variation complicates cross-species comparisons. Am J Hum Biol. 2009;21:578–586. doi: 10.1002/ajhb.20890. [DOI] [PMC free article] [PubMed] [Google Scholar]
- 30.Al-Azzawi F. The menopause and its treatment in perspective. Postgrad Med J. 2001;77:292–304. doi: 10.1136/pmj.77.907.292. [DOI] [PMC free article] [PubMed] [Google Scholar]
- 31.Lobo R. Potential options for preservation of fertility in women. N Engl J Med. 2005;353:64–73. doi: 10.1056/NEJMra043475. [DOI] [PubMed] [Google Scholar]
- 32.Leidy LE, Godfrey LR, Sutherland MR. Is follicular atresia biphasic? Fertil Steril. 1998;70:851–859. doi: 10.1016/s0015-0282(98)00316-1. [DOI] [PubMed] [Google Scholar]
- 33.Jones KP, et al. Depletion of ovarian follicles with age in chimpanzees: similarities to humans. Biol Reprod. 2007;77:247–251. doi: 10.1095/biolreprod.106.059634. [DOI] [PubMed] [Google Scholar]
- 34.Hansen KR, et al. A new model of reproductive aging: the decline in ovarian non-growing follicle number from birth to menopause. Hum Reprod. 2008;23:699–708. doi: 10.1093/humrep/dem408. [DOI] [PubMed] [Google Scholar]
- 35.Wood JW. Dynamics of Human Reproduction: Biology, Biometry, Demography. Aldine de Gruyter; New York: 1994. [Google Scholar]
- 36.Mineau GP, Bean LL, Skolnick M. Mormon demographic history II: the family life cycle and natural fertility. Pop Studies. 1979;33:429–446. [Google Scholar]
- 37.Coale AJ, Demeny P. Regional Model Life Tables and Stable Populations. 2. Princeton University Press; Princeton: 1983. [Google Scholar]
- 38.Te Velde ER, Pearson PL. The variability of female reproductive ageing. Hum Reprod Update. 2002;8:141–154. doi: 10.1093/humupd/8.2.141. [DOI] [PubMed] [Google Scholar]
- 39.Broekmans FJ, et al. Female reproductive ageing: current knowledge and future trends. Trends Endocrinol Metab. 2007;18:58–65. doi: 10.1016/j.tem.2007.01.004. [DOI] [PubMed] [Google Scholar]
- 40.Bongaarts J, Potter RG. Fertility, Biology, and Behavior: An Analysis of the Proximate Determinants. Academic Press; New York: 1983. [Google Scholar]
- 41.Dyke B, et al. Model life table for captive chimpanzees. Am J Primatol. 1995;37:25–37. doi: 10.1002/ajp.1350370104. [DOI] [PubMed] [Google Scholar]
- 42.Littleton J. Fifty years of chimpanzee demography at Taronga Park Zoo. Am J Primatol. 2005;67:281–298. doi: 10.1002/ajp.20185. [DOI] [PubMed] [Google Scholar]
- 43.Roof KA, et al. Maternal age, parity, and reproductive outcome in captive chimpanzees (Pan troglodytes) Am J Primatol. 2005;67:199–207. doi: 10.1002/ajp.20177. [DOI] [PMC free article] [PubMed] [Google Scholar]
- 44.Holman DJ, Wood JW. Pregnancy loss and fecundability in women. In: Ellison PT, editor. Reproductive Ecology and Human Evolution. Aldine de Gruyter; New York: 2001. pp. 15–38. [Google Scholar]
- 45.O’Connor KA, Holman DJ, Wood JW. Menstrual cycle variability and the perimenopause. Am J Hum Biol. 2001;13:465–478. doi: 10.1002/ajhb.1078. [DOI] [PubMed] [Google Scholar]
- 46.Sievert LL. Menopause: a Biocultural Perspective. Rutgers University Press; New Brunswick: 2006. [Google Scholar]
- 47.Block E. Quantitative morphological investigations of the follicular system in women: variations at different ages. Acta Anat. 1952;14:108–123. doi: 10.1159/000140595. [DOI] [PubMed] [Google Scholar]
- 48.Block E. A quantitative morphological investigation of the follicular system in newborn female infants. Acta Anat. 1953;17:201–206. doi: 10.1159/000140805. [DOI] [PubMed] [Google Scholar]
- 49.Richardson SJ, Senikas V, Nelson JF. Follicular depletion during the menopausal transition: evidence for accelerated loss and ultimate exhaustion. J Clin Endocrinol Metab. 1987;65:1231–1237. doi: 10.1210/jcem-65-6-1231. [DOI] [PubMed] [Google Scholar]
- 50.Gougeon A, Ecochard R, Thalabard J. Age-related changes of the population of human ovarian follicles: increase in the disappearance rate of non-growing and early-growing follicles in aging women. Biol Reprod. 1994;50:653–663. doi: 10.1095/biolreprod50.3.653. [DOI] [PubMed] [Google Scholar]
- 51.Graham CE. Reproductive function in aged female chimpanzees. Am J Phys Anthropol. 1979;50:291–300. doi: 10.1002/ajpa.1330500302. [DOI] [PubMed] [Google Scholar]
- 52.Tilly JL. Ovarian follicle counts—not as simple as 1,2,3. Reprod Biol Endocrinol. 2003;1:11. doi: 10.1186/1477-7827-1-11. [DOI] [PMC free article] [PubMed] [Google Scholar]
- 53.Gould KG, Flint M, Graham CE. Chimpanzee reproductive senescence: a possible model for evolution of the menopause. Maturitas. 1981;3:157–166. doi: 10.1016/0378-5122(81)90007-4. [DOI] [PubMed] [Google Scholar]
- 54.Lacreuse A, et al. Menstrual cycles continue into advanced old age in the common chimpanzee (Pan troglodytes) Biol Reprod. 2008;79:407–412. doi: 10.1095/biolreprod.108.068494. [DOI] [PMC free article] [PubMed] [Google Scholar]
- 55.Walker ML, Herndon JG. Menopause in nonhuman primates? Biol Reprod. 2008;79:398–406. doi: 10.1095/biolreprod.108.068536. [DOI] [PMC free article] [PubMed] [Google Scholar]
- 56.Videan EN, Fritz J, Heward CB, Murphy J. The effects of aging on hormone and reproductive cycles in female chimpanzees (Pan troglodytes) Comp Med. 2006;56:275–283. [PubMed] [Google Scholar]


