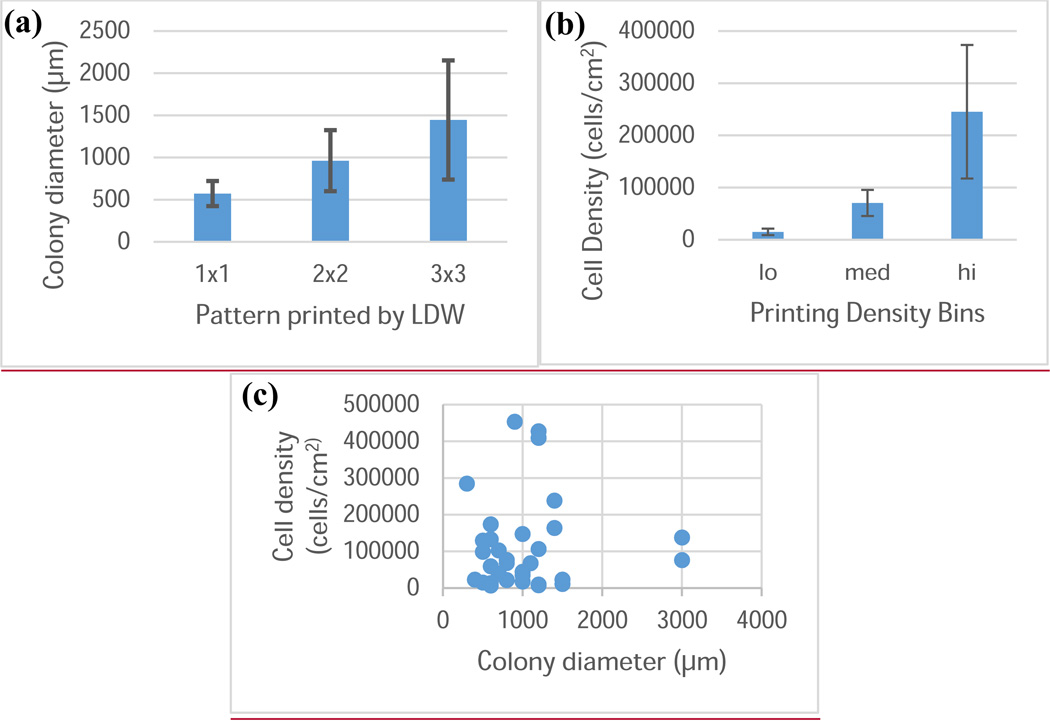
Figure 3.
Control of colony diameter and cell density using LDW. (a) Plot of mESC colony diameter against the pattern printed by LDW. The diameter of the printed colony is controlled by LDW printing parameters, independent of the printing density (error bars: ±1 standard deviation). (b) Plot of mESC density in printed colonies, and the binning for analysis. Bins were “low” (cells/cm2 < 25,000; n=10), “medium” (25,000 ≤ cells/cm2 < 125,000; n=11), or “high” (cells/cm2 ≥ 125,000; n=11) density (error bars: ±1 standard deviation). (c) Plot of the cell density within a colony against the colony diameter for experiments in this study. These factors can be controlled independently.

