

Abstract
Aldehyde dehydrogenase 3A1 (ALDH3A1) plays an important role in many cellular oxidative processes, including cancer chemo-resistance by metabolizing activated forms of oxazaphosphorine drugs such as cyclophosphamide (CP) and its analogues such as mafosfamide (MF), ifosfamide (IFM), 4-hydroperoxycyclophosphamide (4-HPCP). Compounds that can selectively target ALDH3A1 may permit delineation of its roles in these processes and could restore chemosensitivity in cancer cells that express this isoenzyme. Here we report the detailed kinetic and structural characterization of an ALDH3A1 selective inhibitor, CB29, previously identified in a high throughput screen. Kinetic and crystallographic studies demonstrate that CB29 binds within the aldehyde substrate-binding site of ALDH3A1. Cellular proliferation of ALDH3A1-expressing lung adenocarcinoma (A549) and glioblastoma (SF767) cell lines, as well as the ALDH3A1 non-expressing lung fibroblast cells, CCD-13Lu, is unaffected by treatment with CB29 and its analogues alone. However, the sensitivity toward the anti-proliferative effects of mafosfamide is enhanced by treatment with CB29 and its analogue in the tumour cells. In contrast, the sensitivity of CCD-13Lu cells toward mafosfamide was unaffected by the addition of these same compounds. CB29 is chemically distinct from the previously reported small molecule inhibitors of ALDH isoenzymes and does not inhibit ALDH1A1, ALDH1A2, ALDH1A3, ALDH1B1 or ALDH2 isoenzymes at concentrations up to 250 μM. Thus, CB29 is a novel small molecule inhibitor of ALDH3A1, which may be useful as a chemical tool to delineate the role of ALDH3A1 in numerous metabolic pathways, including sensitizing ALDH3A1-positive cancer cells to oxazaphosphorines.
Keywords: kinetics, enzyme, inhibitors, x-ray crystallography, cancer chemoresistance
Introduction
Aldehyde dehydrogenases (ALDH) comprise a family of NAD(P)+ dependent isoenzymes that catalyze the oxidation of aldehydes to their corresponding carboxylic acids. These enzymes participate in cellular homeostasis by metabolizing aldehyes from endogenous as well as exogenous sources. There are at least 19 functional members of ALDH gene family in the human genome.[1] Some important functions of these diverse enzymes include ethanol oxidation, production of retinoic acid, folate metabolism, GABA biosynthesis, as well as proline and branched-chain amino acid metabolism.[1] Several family members possess polymorphisms that impact human health. For instance, the inactive form of ALDH2 (ALDH2*2; E487K or E504K) that is present in the East Asian population is associated with impaired ethanol metabolism, [2] as well as lower efficacy for nitroglycerin.[3 ,4, 5] Modulation of ALDH2 activity can also influence cocaine addiction [6] and ischemia reperfusion injury following myocardial infarction.[7,8,9] Sjogren-Larson syndrome (SLS) is associated with an underlying genetic deficiency of ALDH3A2 [10] and mutation of ALDH4A1 is associated with type II hyperprolinemia.[11, 12] ALDH family members are also implicated in cancer biology, with ALDH1A1 identified as a biomarker for cancer stem cells.[13,14,15] In addition, extensive research has linked the expression of ALDH3A1 and ALDH1A1 to cancer cell proliferation, as well as to reduced sensitivity toward cyclophosphamide.[16,17,18] ALDH expression in cancer cells render these cells resistant to cyclophosphamide and its derivatives by metabolizing the intermediate, aldophosphamide, to the less toxic compound, carboxyphosphamide.[17,18,19]
ALDH3A1 is involved in the oxidation of a variety of endogenous aldehydes, such as peroxidic and fatty aldehydes. It was originally designated as the tumor ALDH as it was found highly expressed in some human tumors such as hepatoma, lung adenocarcinoma, myeloma, breast cancer and stem cell populations.[20,21,22,23] It is also expressed in some normal human tissues such as cornea and keratinocytes.[18,24] Despite being present in normal cells, studies have shown that Aldh3a1(-/-) knockout mice are viable.[25] High ALDH3A1 activity in normal cells protects these cells from the products of lipid peroxidation,[26] but can lead to drug resistance in tumor cells.[27] Indeed, RNAi-mediated knockdown of ALDH1A1 and ALDH3A1 in the lung adenocarcinoma cell line (A549) revealed that both enzymes contribute to the resistance against 4-hydroperoxycyclophosphamide, an analog of cyclophosphamide.[17] Cultured human colon carcinoma cell line, Colon C that expresses high levels of ALDH3A1 is 10-fold less sensitive to mafosfamide than either the lower expressing, RCA or HCT 116b colon cancer cell lines. However, all three cell lines were equally sensitive to the final activated DNA alkylating agent; phosphoramide mustard.[22] Colon C cancer cells were more sensitive when mafosfamide treatment was performed in the presence of the competitive substrate, benzaldehyde.[22] When ALDH3A1 expression was induced in MCF-7 cells by treatment with catechol (MCF-7/CAT), cells were over 35-fold more resistant to mafosfamide compared to control (MCF-7) cells,[20] but sensitivity toward mafosfamide could be restored by inhibition of ALDH3A1 with analogs of chlorpropamide.[23] MCF-7 cells electroporated with ALDH3A1 were 16-fold less sensitive toward mafosfamide than control cells.[28]
In addition, recent study has shown that ALDH3A1 is one of the downstream targets of metadherin (MTDH), a gene involved in multidrug chemoresistance.[29] In this study, authors demonstrated that fibroblastoid mammary carcinoma (LM2) cell line engineered to express an inducible shRNA for conditional knockdown of ALDH3A1 were more sensitive to chemotherapeutic agents such as paclitaxel, doxorubicin and 4-hydroxycyclophosphamide when ALDH3A1 was knocked down. Conversely, overexpression of ALDH3A1 in these cells increased the chemoresistance to paclitaxel, doxorubicin and 4-hydroxycyclophosphamide.[29] These effects may result from the initiation of apoptosis in tumors via induction of oxidative stress following generation of lipid peroxidation products. Since ALDH3A1 is an important contributor in metabolizing lipid peroxidation products, it may facilitate drug resistance under those circumstances.[18,30,31] These studies highlight the role of ALDH3A1 in a broad-spectrum of cancer chemoresistance and support the development of selective and potent small molecule inhibitors.
Our laboratory recently showed that non-selective inhibition of ALDH isoenzymes enhances mafosfamide sensitivity in A549 cells.[30] However, the extent to which ALDH3A1 contributed to the observed resistance remains unknown and somewhat controversial.[17,22,28,31,32,33] We reasoned that selective inhibition of ALDH3A1 using selective small molecule inhibitors could enhance the sensitivity of chemotherapeutic agents such as cyclophosphamide as well as determine its contributions to aldophosphamide metabolism in tumor cells. In this study, we report the detailed characterization of a highly selective inhibitor for ALDH3A1, designated CB29, previously identified through the use of chemical library screening.[34] Kinetic and crystallographic studies indicate that this compound binds only to ALDH3A1 through its aldehyde binding site and does not inhibit either ALDH1A1, ALDH1A2, ALDH1A3, ALDH1B1 or ALDH2 up to 250 μM concentration. Structural alignment of ALDH isoenzymes helped us analyze the rationale behind selectivity pattern shown by this class of compounds. Chemosensitivity experiments showed that treatment of the ALDH3A1 expressing lung adenocarcinoma (A549) and glioblastoma (SF767) cell lines with mafosfamide in the presence of CB29, or closely related analogs, enhanced the killing effects of mafosfamide, while treatment with the compounds alone had little effect on cell proliferation. Interestingly, treatment of normal lung fibroblasts (CCD-13Lu), which do not express ALDH3A1, with mafosfamide in the presence of CB29 and its analogs, did not show mafosfamide chemosensitivity.
Results
CB29 is a selective ALDH3A1 inhibitor
Among all the 101,000 compounds that were screened, CB29 (Figure 1A) emerged as a selective inhibitor of ALDH3A1 (Figure S1 and supplementary table 1).[34] CB29 has a molecular mass of 349 Daltons and has little structural similarity to any known inhibitors of aldehyde dehydrogenase isoenzymes. The compound has reasonable potency for an initial hit compound against ALDH3A1 (IC50 is 16 μM) and good selectivity toward ALDH3A1 demonstrating no inhibition (<5%) toward ALDH1A1, ALDH1A2, ALDH1A3, ALDH1B1 or ALDH2 up to 250 μM. Steady-state kinetic experiments are consistent with CB29 binding competitively to the aldehyde binding site, with a Ki of 4.7 ± 0.3 μM (Figure 1B).
Figure 1.

CB29 and its mode of inhibition. (A) The chemical name of CB29 is N-[4-{(4-(methylsulfonyl)-2-nitrophenyl)-4-amino}-phenyl]-acetamide and has a molecular weight of 349 Daltons. (B) Lineweaver-Burk representation of the non-linear fit to the competitive inhibition equation for CB29 versus varied benzaldehyde at fixed coenzyme concentration. Initial velocities were measured using 10 nM ALDH3A1 and 1.5 mM NADP+ by co-varying benzaldehyde (50 - 800 μM) and various CB29 concentrations (1-12 μM). The plot is a representative single experiment of three separate experiments that were performed.
Structure of the ALDH3A1-CB29 complex
In order to understand the specificity for ALDH3A1 and provide a structural context for the kinetic studies, we determined the crystal structure of CB29 bound to ALDH3A1. Triclinic crystals were obtained that diffracted up to 2.5 Å resolution (Table 1). Four independent dimers are present in the asymmetric unit. The presence of CB29 within the active site of ALDH3A1 was confirmed through examination of the original figure-of-merit, σA-weighted, electron density maps (Figure 2A). The active site of each subunit of ALDH3A1 in the asymmetric unit is fully occupied by CB29. A Ramachandran plot of the final model demonstrates greater than 97% of all residues in the most favored regions. There are four residues Cys243, Val244, Glu61 and Asn114 that contribute hydrogen bonding interactions with CB29 (Figure 2B). The two sulfonyl oxygens and the amino group linking the two benzene rings mediate these hydrogen bonds whereas the terminal benzylacetamide moiety contribute mostly hydrophobic and van der Waals interactions (Figure 2B). One of the sulfonyl oxygens forms a hydrogen bond with the peptide nitrogen of Val244. The second sulfonyl oxygen is positioned similar to the oxyanion formed during catalysis and lies in proximity to the peptide nitrogen of Cys243 and the side chain amide nitrogen of Asn114. The nitrogen linking the two substituted benzene rings in CB29 donates a hydrogen bond to the peptide carbonyl oxygen of Glu61. The methyl associated with the sulfonyl group forms a hydrophobic interaction with Phe401 and the nitro-benzene ring forms hydrophobic pi-stacking interactions with Tyr115. The side chains of Ile394 and Thr242 also contribute hydrophobic interactions with the nitro-benzene ring. The benzylacetamide ring forms hydrophobic interactions with Tyr65 and Thr395 on one side, while the opposing face interacts with the Cβ and Cγ side chain atoms of Glu61 and the side chain of Met237. The terminal acetamide group is within van der Waals contact of Tyr65, Trp233, Thr395, Val 392 and Arg441 (Figure 2B).
Table 1.
Data collection and refinement statistics
| Data collection | ALDH3A1-CB29 complex |
|---|---|
| Space group | P1 |
| Cell dimensions | |
| a,b,c [Å] | 89.1, 95.4, 117.2 |
| α,β,γ [°] | 112.4, 91.7, 91.0 |
| R merge | 0.067 (0.25) |
| I/σI | 10.4 (3.1) |
| Completeness | 93.6 |
| Redundancy | 2.2 |
| Refinement | |
| Resolution [Å] | 50-2.5 |
| No. of reflections | 109,547 |
| Rwork/Rfree | 0.23/0.25 |
| No of atoms | |
| Protein | 28003 |
| Ligand | 192 |
| Water | 218 |
| B-factor (overall) | 25.2 |
| RMSD Bond angles [Å] | 1.15 |
| RMSD Bond Length [A] | 0.008 |
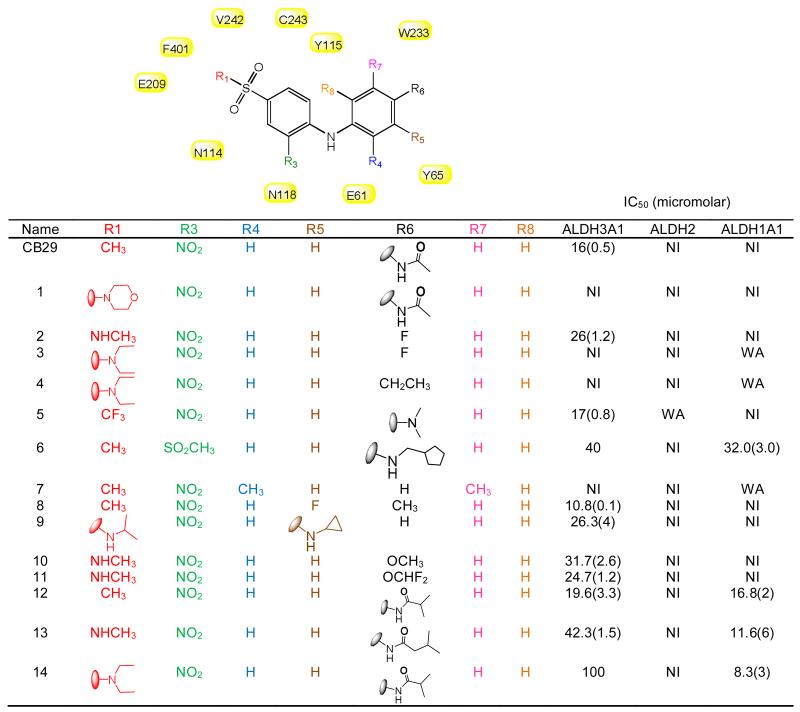
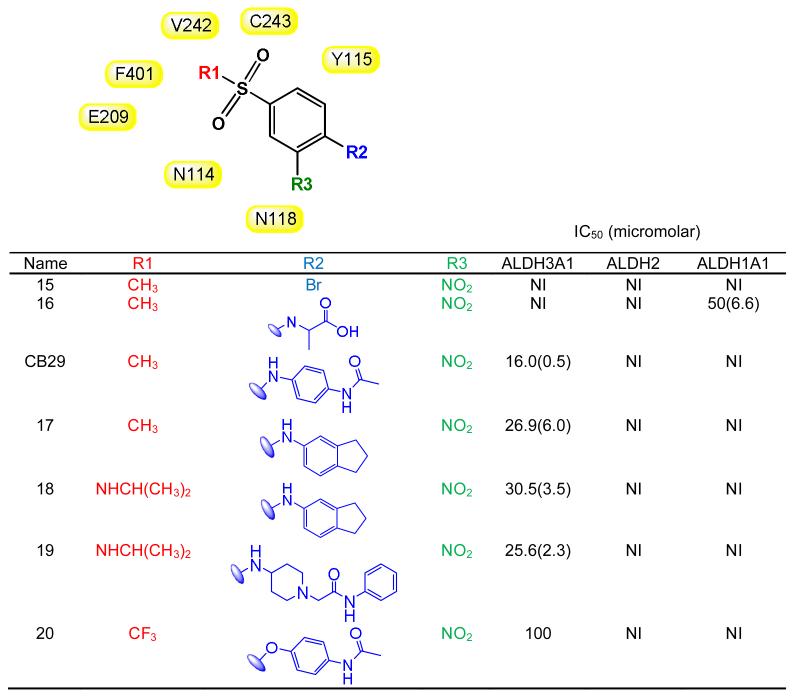
Our results showed that an aniline at the R2 position was required for inhibition of ALDH3A1 [Table 3, compare 15 (NI), 16 (NI) with CB29 (IC50 = 16 μM), 17 (IC50 = 27 μM) and 18 (IC50 = 30 μM)]. Even the substitution of an ether linkage greatly reduced potency [Table 3, compare CB29 (IC50 = 16 μM) with 20 (IC50 = 100 μM)]. We evaluated a series of anilines at the R2 position with substitutions at the ortho, meta and para positions. Compounds with substituents at the ortho position (R4/R8) lost all activity toward ALDH3A1 [Table 2, 7 (NI)]. Compounds with substitutions at the meta positions (R5/R7) showed similar potencies to CB29 [Table 2, 8 (IC50 = 10 μM) and 9 (IC50 = 26 μM)]. Finally, we examined substitutions at the para (R6) position. Since our parent compound CB29 had an acetamide at this position, we looked for analogs having ether instead of amine linkage at the corresponding position (10 and 11). This substitution yielded compounds with similar potencies [10 (IC50 = 31 μM), 11 (IC50 = 24 μM)], which is consistent with the structural data that shows no hydrogen bonding from this nitrogen to the enzyme. We next looked larger amide substitutions at the R6 position. Here a surprising pattern was seen, when the acetamide was substituted with isobutyramide (12) or isopentanamide (13), these two compounds were inhibitory towards both ALDH1A1 and ALDH3A1 (Table 2). In addition, analogs with larger amides at the R6 position and larger substitutions at the R1 position (14) showed greater potency toward ALDH1A1 than toward ALDH3A1 (Table 2). In contrast, as mentioned above when the acetamide group was held constant and the larger morpholine was introduced at the R1 position (1), the compound lost all inhibitory potency toward either ALDH1A1or ALDH3A1. Interestingly, none of the compounds tested, except for 13, showed any inhibitory effect on ALDH1A2, ALDH1A3 and ALDH1B1 activity. Compound 13 showed some inhibitory effect on ALDH1A2 activity (~50% at 100 μM concentration) with no effect on ALDH1A3, ALDH1B1, or ALDH2. Based on SAR study, we chose compound CB29, 17, 2, 18, 19, 11, 8, 9 and 10 for phenotypic studies since these compounds were selective toward ALDH3A1 and showed no inhibition toward ALDH1A1, ALDH1A2, ALDH1A3, ALDH1B1 and ALDH2 activity in vitro.
Figure 2.

Structure of human ALDH3A1 with CB29. (A) The active site of ALDH3A1. The electron density maps displayed are the original figure of merit (σ-A weighted) Fo-Fc map contoured at 2.5 standard deviations (green) and the original figure-of-merit weighted 2Fo-Fc map contoured at 1 standard deviation (blue) superimposed on the final refined model of CB29 bound in the enzyme active site. (B) Two dimensional representation of the important contacts between CB29 and residues within the active site of ALDH3A1. The pink dotted lines represent potential hydrogen bonding interactions. The distance shown is the average of the distances observed in the eight subunits of the asymmetric unit. Hydrophobic and van der Waals contacts are represented by radiating arcs radiating towards the ligand. This figure was generated using PyMol for Windows, version 0.99 and ChemBioDraw Ultra 12.0, respectively.
SAR study on CB29 derivatives
We purchased 64 different compounds that showed at least 90% structural similarity in their atomic positions with CB29. These compounds were tested for their potency as inhibitors of ALDH3A1 and for their selectivity versus ALDH1-class isoenzymes and ALDH2 (Table 2 and 3).
Table 2.
SAR for CB29-based compounds. (A) SAR study for analogs having aniline at R3 position but with ortho, meta and para substitutions at various positions (R4, R5, R6, R7 and R8). Also included are compounds with substitutions at R1 and R3 positions. Two dimensional figures are generated using ChemBioDraw Ultra 12.0. Values in parentheses are S.D. for three independent assays. NI stands for no inhibition at 100 μM inhibitor concentration. WA represents (30-50) % activation shown by 100 μM compound to respective enzymes. Shaded in yellow are the residues of ALDH3A1 that are in close proximity of CB29. None of the listed analogs, except compound 13, showed inhibition (<5%) to ALDH1A2, ALDH1A3 or ALDH1B1 up to 100 μM concentration.
|
Table 3.
SAR for CB29-based compounds. (B) SAR showing the effect of first set of analogs that had substitutions other than aniline at R2 position (such as halogen, glycine and ethers). Two dimensional structures for the subgroups are generated using ChemBioDraw Ultra 12.0. Values in parentheses are S.D. for three independent assays. NI stands for no inhibition at 100 μM inhibitor concentration. Shaded in yellow are the residues of ALDH3A1 that are in close proximity with of CB29 at the respective positions. None of the listed analogs showed inhibition (<5%) to ALDH1A2, ALDH1A3 or ALDH1B1 up to 100 μM concentration.
|
SF767 cells also demonstrated robust ALDH3A1 expression, but lacked detectable expression of ALDH1A1 (Figure 3A & 3B). The antibodies utilized for detection of ALDH1A1 also detect ALDH1A2, ALDH1A3, ALDH1B1, and ALDH2 (Figure 3C), therefore SF767 appears devoid of all ALDH1 subtypes, as well as ALDH2. CCD-13Lu cells had no detectable expression of either ALDH1A1 or ALDH3A1 by immunoblot.
ALDH3A1 and ALDH1A1 expression in cancer cells
We examined various cancer cell lines to determine the basal level of ALDH1A1 and ALDH3A1 expression as potential cell models for assessing the contributions of ALDH3A1 toward aldophosphamide metabolism. As previously reported,[17] we found A549 cells express both ALDH1A1 and ALDH3A1 (Figure 3A and 3B). When we quantitated the relative expression levels of each isoenzyme by reference to purified recombinant enzyme, we find that A549 cells express ALDH1A1 at about 1% and ALDH3A1 at about 2% of total cellular protein (Figure S3).
Figure 3.

Expression and activity of ALDH1A1 and ALDH3A1 in A549, SF767, and CCD-13Lu cells. Lysates from various cancer cell lines (A549, SF767and CCD-13Lu) were examined for (A) ALDH3A1 expression and (B) ALDH1A1 expression. (C) Western blot of purified human ALDH1 and ALDH2 isoenzymes using the Abcam (ab-23375) ALDH1A1 antibody. Each lane was loaded with between 50 and 70 ng of the purified recombinant human ALDH1A1, ALDH1A2, ALDH1A3, ALDH1B1 and ALDH2 isoenzymes, respectively. (D) Recombinant ALDH3A1, A549, SF767 and CCD-13Lu cell lysate activity were tested in the presence of 1.5 mM NADP+ and 1 mM Benzaldehyde and in the presence and absence of 50 μM CB29 for 3 minutes. Unlike A549 and SF767 cells, CCD-13Lu cell lysate did not have dehydrogenase activity. The p values were calculated using the Student’s t test comparing activity in the absence and presence of inhibitor (CB29) (*, p < 0.001, n=3).
To confirm that protein expression correlates with ALDH activity, we performed activity assays. While benzaldehyde is a substrate for many ALDH isoenzymes, only ALDH3A1 uses NADP+ as a cofactor to oxidize benzaldehyde (Figure 3D). Enzyme activity assays on A549 cell lysates using NADP+ and benzaldehyde had an activity of 282 nmol/min/mg. Based on the specific activity of recombinantly ALDH3A1 purified in our lab (32 μmol/min/mg), the activity assay was within a factor of 2 of the immunoblot and demonstrated that ALDH3A1 is active and present at 1-2% of total lysate protein. Similarly, in SF767 cells, western blot analysis and enzyme assays show that ALDH3A1 is expressed at 1% of total cellular protein (Figure 3D and Figure S3). Finally, CCD-13Lu cells had no detectable ALDH1A1 or ALDH3A1 activity (Figure 3A, 3B and 3D). The three cell lines provide a convenient system to investigate the potentiation of mafosfamide by ALDH3A1 inhibition as A549 express both ALDH3A1 and ALDH1A1, SF767 express predominantly ALDH3A1, and CCD-13Lu, primary lung fibroblasts, do not express detectable levels of several ALDH isoforms.
The ability of CB29 to inhibit ALDH3A1 activity in cell lysates was examined using this activity assay (Figure 3D). When CB29 is incubated with A549 and SF767 cell lysates, the ALDH3A1 activity is diminished significantly: (>95% in A549; >90% in SF767, right panel). The activity of recombinant ALDH3A1 also decreased by ~97% after treatment with CB29 (Figure 3D, left panel). Lysate from CCD-13Lu cells did not exhibit ALDH3A1 associated activity (<2 nmol/min/mg). This is consistent to our western blot results showing no expression of ALDH1A1 or ALDH3A1 in CCD-13Lu cells (Figure 3A and 3B). These data demonstrate that tumor cell possess robust ALDH3A1 activity, and that CB29 can inhibit the activity of ALDH3A1 in tumor whole cell lysates (Figure 3D).
Evaluation of the contribution of ALDH3A1 toward aldophosphamide metabolism
Next we needed a model cell system with which to evaluate the ability of CB29 and selected analogs to penetrate the cell and influence an observable phenotype that is ALDH3A1-dependent. ALDH3A1 has been shown to directly influence cellular sensitivity to the effects of cyclophosphamide treatment.[17,22,27] We used the A549 (ALDH1A1 and ALDH3A1 expressing), SF767 (ALDH3A1 expressing) and CCD-13Lu (ALDH non-expressing) cells to assess the overall cytotoxicity and ability of CB29 analogs to enhance the sensitivity of cyclophosphamide and its derivatives.[20,24] The ED50 values for mafosfamide on A549 and SF767 cells were 125 μM and 150 μM, respectively, while primary cells, CCD-13Lu were more sensitive to mafosfamide with an ED50 of 40 μM (Figure S2). CB29 as well as compounds 17, 2, 18, 19, 11, 8, 9 and 10 were chosen because they were selective toward ALDH3A1 and showed no inhibitory potential toward ALDH1A1, ALDH1A2, ALDH1A3, ALDH1B1 and ALDH2 activity in vitro. In addition, these compounds could easily form a homogeneous 100 μM solution in the presence of 0.25% DMSO and did not inhibit cellular proliferation as single agents with doses as high as 100 μM. Treatment of all cell lines with mafosfamide decreased cell proliferation (Figure 4A and 4B, DMSO control vs. mafosfamide, 59% ± 14% (A549), p < 0.001, 68% ± 4% (SF767), p<0.001). ALDH3A1 inhibitors 17, 2, 18, 19, 11, 8, 10 and CB29 had little effect on cell proliferation (Figure 4A and 4B, grey bars) as single agents. However, compound 9 was cytotoxic in both cancer cell lines (66 ± 7% in A549, and 69 ± 3% in SF767) at 50 μM concentration, suggesting that it may have off-target effects at this concentration and was not pursued further.
Figure 4.
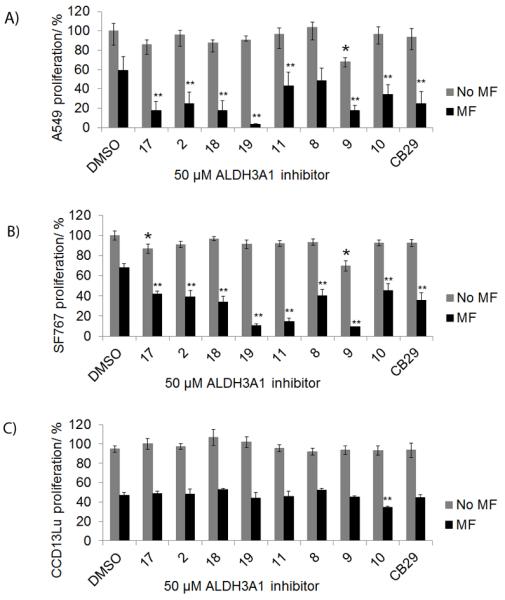
Sensitization of tumor cells to mafosfamide with ALDH3A1 inhibitors. Cells were simultaneously treated with mafosfamide (MF) in combination with ALDH3A1 inhibitors (50 μM). A549 (A) and SF767 (B) cells were treated with mafosfamide (125 μM) for 19 hours. (C) CCD-13Lu cells treated with 40 μM mafosfamide for 19 hours. Cell proliferation was determined was determined using the MTT assay. The DMSO concentration was limited to 0.25% (v/v). P values were calculated by comparing the cellular proliferation of DMSO treated cells versus ALDH3A1 inhibitor treated cells (*, p<0.05, n = 15) or mafosfamide (MF) treated cells versus (MF + 50 μM Inhibitor) treated cells (**, p<0.005, n = 15). Grey bars represent ALDH3A1 inhibitor treatment alone and black bars represent ALDH3A1 inhibitor and mafosfamide treatment. Each bar represents the mean value ± SE.
Treatment of A549 cells with mafosfamide in the presence of compounds 17, 2, 18, 19, 11, and CB29 showed marked increase in mafosfamide sensitivity: 17 and 18 (3-fold, p<0.005);19 (12-fold, p<0.005); 2, 10 and CB29 (2-fold, p<0.005) (Figure 4A). Similar experiments on SF767 cells demonstrated dramatic increase in chemosensitivity with analogues 19 (6-fold, p<0.005), and 11 (4-fold, p<0.005), whereas inhibitor 17, 2, 18, 8, 10, CB29 increased chemosensitivity by nearly 2-fold (p<0.005). Similar experiments were performed with CCD-13Lu cells and the ALDH3A1 inhibitors were neither cytotoxic nor did they significantly enhance mafosfamide sensitivity (Figure 4C). Inhibitor 19 was strongly enhanced chemosensitivity in both A549 and SF767 cells, whereas inhibitor 11 was efficient only on SF767 cell line. Overall, inhibitor 17, 2, 18, 19, 11, 10, and CB29 showed mafosfamide chemosensitivity on both cell lines. However, inhibitor 18, 19, and CB29 relatively showed the highest amount chemosensitivity on both cell lines.
Since SF767 cells only express ALDH3A1, we used these cells to investigate the potentiation of mafosfamide following increasing amounts of ALDH3A1 inhibitors, CB29 as well as analogs 18 and 19. We chose these three analogs based on the potent enhancement of mafosfamide cytotoxicity shown in Figure 4A and 4B. We observed a dose-dependent enhancement in mafosfamide sensitivity as the concentration of compounds 18, 19 and CB29 increase (Figure 5A). To further demonstrate the potentiation of mafosfamide cytotoxicity, we treated SF767 cells with increasing amounts of mafosfamide in the presence or absence of CB29, 18 and 19 in SF767 cells. Results demonstrated that in the presence of CB29, 18 or 19, the ED50 value of mafosfamide decreases by 1.6-fold, 1.4-fold, and 1.6-fold, respectively [ED50: 146 ± 2 μM (MF) vs. 92 ± 4 μM (MF + CB29), 108 ± 6 μM (MF + 18), 94 ± 5 μM (MF + 19)] (Figure 5B). This experiment confirms that selective ALDH3A1 inhibitors can increase mafosfamide chemosensitivity.
Figure 5.

Inhibition of ALDH3A1 with CB29 or analogs 18, 19 enhances mafosfamide cytotoxicity in a dose-dependent manner. (A) SF767 cells were treated with increasing concentrations of 18, 19, or CB29 and either in the presence or absence of 125 μM mafosfamide (n= 10-15). P values were calculated by comparing the cellular proliferation of DMSO treated cells versus ALDH3A1 inhibitor treated cells (*, p<0.05, n = 15) or mafosfamide (MF) treated cells versus (MF + ALDH3A1 Inhibitor) treated cells (**, p<0.005, n = 15). Grey bars represent ALDH3A1 inhibitor treatment alone and black bars represent ALDH3A1 inhibitor in combination with mafosfamide treatment. Each bar represents the mean value ± SE. (B) SF767 cells (10,000 cells/well) were treated with CB29, 18 or 19 (50 μM) with increasing concentrations of mafosfamide (0 μM - 250 μM). Cell proliferation was determined using MTT assay and plot for percent (%) proliferation was created using the SigmaPlot (v11, StatSys). Shaded circles (●) show SF767 cell proliferation treated with mafosfamide in the absence of inhibitors. Open circles (o), inverted shaded triangles (▼) and open triangles (△) show cell proliferation with mafosfamide in the presence of inhibitors CB29, 19, and 18 respectively. The solid trend lines [MF + DMSO (black), MF + CB29 (red), MF + 19 (pink), MF + 18 (green)] represent the fits to the 3-parameter logistics equation. DMSO concentration was limited to 0.25% (v/v) (n = 15). Figures were generated using SigmaPlot, v 11.0.
Discussion
During the last decade there has been renewed interest in aldehyde dehydrogenases as their contributions to underlying biological phenotypes have been illuminated. Of particular interest has been the association of ALDH1 and ALDH3 with particular neoplastic characteristics, such as metastatic propensity [29] and stem-cell properties.[13,15] However, it is also clear that the field lacks selective and potent chemical probes with which to determine if these associations are functional or simply a consequence of a general switch in gene expression. Compounds such as DEAB are not selective for ALDH1A1 versus 1A2 or 1A3 or even ALDH3A1, for that matter. Consequently, the discovery and development of novel and selective inhibitors for ALDH isoenzymes would be of tremendous value for investigators seeking to determine the roles of these ALDH isoenzymes in these biological outcomes. One of the most well characterized roles for both ALDH1A1 and ALDH3A1 is their involvement in the metabolic inactivation of cyclophosphamide derivatives.[17,22,27] Cyclophosphamide, a chemotherapeutic drug, when acted on by P450 forms 4-hydroxycyclophosphamide, which is in tautomeric equilibrium with aldophosphamide. Spontaneous beta-elimination of aldophosphamide forms acrolein and phosphoramide mustard, the latter compound is the DNA-alkylating agent that targets rapidly dividing cells. ALDH isoenzymes and ALDH1A1, in particular, are known for their ability to confer resistance to derivatives of cyclophosphamide by oxidizing aldophosphamide to the considerably less toxic compound, carboxyphosphamide.[17,18,19] The contribution of ALDH3A1 toward cyclophosphamide resistance is more controversial, with some studies supporting a role and others refuting.[17,22,28,31,32,33] We have previously shown that non-selective covalent inhibitors of ALDH family members can sensitize A549 cells to the cytotoxic effects of aldophosphamide,[30] which is consistent with earlier studies in which siRNA knockdown of both ALDH1A1 and ALDH3A1 were required for maximal sensitivity to aldophosphamide.[17] What is clear from both in vitro and cell-based work is that ALDH1A1 exhibits greater catalytic efficiency toward aldophosphamide than ALDH3A1, although purified recombinant ALDH3A1 (identical to that used in these studies) exhibited “considerable activity” toward aldophosphamide.[33] These authors concluded that only upon high level of expression, does ALDH3A1 play a significant role in conferring resistance to derivatives of cyclophosphamide,[33] something that both A549 and SF767 cells exhibit.
Consequently, selective inhibitors for ALDH3A1, and/or ALDH1A1 that are cell permeable and show phenotypic effects may provide a means to understand their individual contributions toward aldophosphamide metabolism. Consistent with the ability of ALDH3A1 to metabolize aldophosphamide, several of the ALDH3A1 selective inhibitors reported here enhance the anti-proliferative effects of mafosfamide in SF767 cells, which express only ALDH3A1. In fact, in the presence of ALDH3A1 inhibitors– CB29, 18, and 19, the ED50 value of mafosfamide dropped from 146 ± 2 μM to 92 ± 4 μM, 108 ± 6 μM, and 94 ± 5 μM respectively (Figure 5B). Of more interest is that fact that selective inhibition of ALDH3A1 in A549 cells also enhances mafosfamide sensitivity, even with the contributions of ALDH1A1 intact. This result is consistent with the RNA-knockdown studies in these same cells, where both isoenzymes appear to contribute equally to resistance.[17] In SF767 cells, where ALDH3A1 appears to the sole target, this enhancement of sensitivity increases in a dose-dependent manner (Figure 5A). In our hands, the antibodies utilized for detection of ALDH1A1 also detect ALDH1A2, ALDH1A3, ALDH1B1, and ALDH2 (Figure 3C), therefore SF767 appears devoid of all ALDH1 subtypes, as well as ALDH2, and is thus a good model system to study the contribution of ALDH3A1 in aldophosphamide metabolism. Lastly, the dose-response in SF767 cells matches reasonably the in vitro IC50 data in which both assays produced values between 15 and 50 μM (Table 2, Table 3 and Figure 5A).
Our steady state kinetic experiments showed that CB29 is a competitive inhibitor with respect to benzaldehyde, which is consistent with our crystallographic data where CB29 is found within the substrate-binding site. We compared the structure of ALDH3A1 catalytic site to that of ALDH2 and sheep ALDH1A1 by structural alignment to understand the selectivity of CB29 toward ALDH3A1. In particular, the structure of ALDH2 bound to daidzin (PDB accession code 2vle) provides a good basis for comparison.[35] Daidzin has a central planar isoflavone ring (Figure 6A, shown in blue color) linked by a single bond to a phenol moiety. This scaffold is optimal for the nearly cylindrical substrate site in ALDH2 (Figure 6C), whereas the bent conformation conferred by the amine linkage between the two aromatic rings in CB29 is better suited to the curved nature of the ALDH3A1 site (Figure 6B). In fact, the amine nitrogen linking the two substituted benzene rings in CB29 donates a hydrogen bond to the peptide carbonyl oxygen of Glu61 (Figure 6D). It is interesting that substitution of the linking amine group in CB29 with an ether linkage is deleterious to potency. This difference confirms that the angle and distance geometry of the amine linkage is critical for CB29 selectivity as well contributing to its potency through hydrogen bond donation.
Figure 6.

Comparison of ALDH3A1 inhibitor CB29 to ALDH2 inhibitors. (A) Structure of daidzin. Blue region shows the planar isoflavone ring. (B) CB29 (sky-blue) bound with the catalytic pocket of ALDH3A1. (C) Daidzin (yellow) bound within the cylindrical pocket of ALDH2. (D) Position of CB29 within the ALDH2 substrate site based on superimposition of the ALDH3A1 and ALDH2 structure (RCSB code 1O00). This figure shows the potential steric clashes that could occur between CB29 (sky-blue) and the ALDH2 substrate site. (E) Position of CB29 within the sheep ALDH1A1 substrate site based on superimposition of the ALDH3A1 and sheep ALDH1A1 (RCSB code 1BXS) structures. This view shows the larger available space for CB29 (sky-blue) within the ALDH1 active site. Figures were generated using PyMol for Windows, version 0.99.
In order to understand the specificity of CB29 for ALDH3A1 over ALDH1A1, we examined the substrate-binding site of sheep liver ALDH1A1 (PDB accession code 1bxs) and superimposed this structure with the human ALDH3A1 structure. Based on this alignment, we found that the substrate-binding site in human ALDH1A1 is much larger than either ALDH3A1 or ALDH2 due to the substitution of Phe459 by Val and Met124 by Gly, which widens the entrance to the substrate site considerably (Figure 6E). We surmise that this larger substrate binding site does not sufficiently constrain CB29 for stable binding. However, analogs of CB29 with larger substituents at the R1 and R2 positions, such as 12, 13, 14 and 6, showed inhibitory activity toward ALDH1A1. Unlike ALDH1A1, ALDH3A1 cannot tolerate larger substituents at the R1 position without decreasing inhibitory potency [4, 3, 14, 1]. This trend is likely due to steric clashes that would occur with the side chains of Leu119, Tyr412 and Phe401 in this region. Our structure demonstrates that all the hydrogen bonding interactions are contributed by the substituents on the nitrobenzene ring, while the latter half of the molecule contributes primarily hydrophobic interactions (Figure 2B). We propose that the development of more potent compounds should exploit potential hydrogen bonding interactions with the side chains of Asn118, Gln122, and His413, which would create a more even distribution of hydrogen bonding interactions along the length of the substrate-binding site.
Conclusion
Since many exogenously administered drugs are active in their aldehyde form, identification of isoenzyme selective inhibitors for various ALDH isoenzymes will help us investigate their individual contribution toward drug metabolism. It will also help us understand the individual contribution of different forms of ALDH towards metabolism of numerous cytotoxic aldehydes, including those linked to cellular differentiation, detoxication of peroxidic aldehydes, as well as metabolism of neurotransmitters. In this study, we characterized a selective inhibitor of ALDH3A1, an enzyme implicated in aldophosphamide metabolism. Even though, the catalytic efficiency of ALDH3A1 is 1/7th than that of ALDH1A1 for aldophosphamide in vitro,[33] the expression levels in some cancer cell lines are such that its impact on aldophosphamide metabolism cannot be ignored. Indeed, some cells such as the (SF767) glioblastoma cell line only express ALDH3A1 and have ED50 values similar to those cells in which both enzymes are expressed in similar levels (A549). Our study showed that cancer cell lines that express ALDH3A1 (SF767 and A549) can be sensitized to mafosfamide in the presence of our inhibitors whereas normal cell lines that lack ALDH3A1 expression (CCD-13Lu) are not. Our current inhibitor is of modest potency (Ki of 4 μM) and future work will focus on increasing the potency of new derivatives. Our ability to combine our structural kinetic data will facilitate the design and synthesis of more potent compounds such that a similar phenotypic effect can be elicited at lower concentrations. These selective inhibitors can be used to manipulate the contributions of ALDH3A1 toward aldophosphamide metabolism, as well as other biologically relevant aldehydes.
Experimental Section
Materials
Benzaldehyde, propionaldehyde, para-nitrophenylacetate, NAD+, NADP+ and buffers were all purchased from Sigma Aldrich unless otherwise stated. The chemical libraries for performing high throughput screening were purchased from ChemDiv Corp. and ChemBridge Corp. Mafosfamide was bought from Niomech-IIT GmbH, Bielefeld, Germany. Primary ALDH3A1 antibody was purchased from Santa Cruz Biotechnology (sc-67310); primary ALDH1A1 antibody was purchased from Abcam (ab-23375) and primary GAPDH antibody was purchased from Abcam (ab9484).
Cloning and purification of ALDH1A1, ALDH1A2, ALDH1A3, ALDH1B1, ALDH2, ALDH3A1
Human ALDH1A1, ALDH2 and ALDH3A1 were expressed and purified as described elsewhere.[30,34,36] The full length cDNA of human ALDH1A2, ALDH1A3 and ALDH1B1 was purchased from Open Biosystems and subcloned into the pT7-7 (ALDH1A1 and ALDH1A3) and pET15B (ALDH1B1) expression plasmids. These plasmids were used to transform BL21DE3 (ALDH1A2), BL21DE3 (ALDH1A3) and TunerDE3 (ALDH1B1) cells and the resulting cells were grown in LB medium in the presence of Ampicillin (100 μg/mL) at 37°C. Cells were induced with IPTG (0.1 mM final concentration) when absorbance at 600 nm reached 0.6. Cells were incubated at 16°C for 16 hours. The cells pellets were harvested using ultracentrifugation. ALDH1A2 cells pellet was resuspended in Buffer A (100 mM NaH2PO4, 2 mM EDTA, 1 mM benzamidine, 1 mM DTT, pH 7.0) and lysed using a Microfluidics Model 110L Microfluidizer. The lysate was clarified by centrifugation at 100,000*g for 45 minutes at 4°C. The supernatant was collected and dialyzed against Buffer A overnight at 4°C. The lysate supernatant was loaded onto a DEAE column and the fractions were eluted using gradient of Buffer B (100 mM NaH2PO4, 2 mM EDTA, 1 mM benzamidine, 250 mM NaCl, 1 mM DTT, pH 7.0). Fractions containing ALDH1A2 were dialyzed against Buffer C (20 mM NaH2PO4, 1 mM EDTA, 50 mM NaCl, 1 mM DTT, pH 7.5) overnight. The DEAE pool was loaded to HAP column and eluted using Buffer D (10mM 4-hydroxyacetophenone, 20 mM NaH2PO4, 1 mM EDTA, 50 mM NaCl, 1 mM DTT, pH 7.5). Fractions containing the protein were pooled together, dialyzed against storage buffer (10 mM ACES, 2 mM DTT, pH 6.6) twice, concentrated, flash frozen and stored at -80°C. ALDH1A3 was purified and stored almost identically as ALDH1A2 except for buffer A and Buffer B both of which had a pH of 8.0. ALDH1A1 and ALDH1A3 did not have any expression tags whereas ALDH1B1 had an N-terminal His-tag as a result of which the expression protocol was altered. The cell pellet of ALDH1B1 expressing cells was resuspended using Buffer E (20 mM HEPES, 500 mM NaCl, 10 mM Imidazole, pH 8.0) and lysed using the Microfluidizer. The lysate was centrifuged and supernatant was loaded to Ni-NTA column. Protein was initially washed with Buffer E followed by wash with Buffer F (20 mM HEPES, 500 mM NaCl, 60 mM Imidazole, 10 mM β-mercaptoethanol, pH 8.0). Protein was eluted using a gradient of Buffer G (20 mM HEPES, 500 mM NaCl, 250 mM Imidazole, 10 mM β-mercaptoethanol, pH 8.0). The protein containing fractions were pooled together and dialyzed against Buffer H (20 mM HEPES, 50 mM NaCl, 2 mM DTT, 1mM EDTA, pH 7.5) at 4°C. Dialyzed protein was loaded onto the HAP column and initially washed with Buffer H. Protein was eluted using Buffer I (10 mM 4-hydroxyacetophenone, 20 mM HEPES, 50 mM NaCl, 2 mM DTT, 1mM EDTA, pH 7.5). Protein was dialyzed against Buffer J (10 mM ACES, 2 mM DTT, pH 7.4) at 4°C overnight and concentrated to 200 μL. This fraction was loaded to Sephadex 200 10/300Gl column in the presence of Buffer J. Eluted fractions were concentrated, flash frozen and stored at -80°C.
Activity measurement of ALDH enzymes
The specific activities of the purified proteins were 1.9 (ALDH1A1), 0.8 (ALDH1A2), 0.44 (ALDH1A3), 0.2 (ALDH1B1), 3.8 (ALDH2) and 32 (ALDH3A1) μmole/min/mg. The enzymatic activity of ALDH1A1, ALDH2 and ALDH3A1 were monitored by calculating the increase in absorbance at 340 nm due to NAD(P)H formation (molar extinction coefficient of 6220 M−1 cm−1) as described elsewhere.[30,34,36,37,38] ALDH1A2, ALDH1A3 and ALDH1B1 activity assays are measured spectrophotometrically in reaction solution containing 1 mM propionaldehyde, 1.5 mM NAD+, and respective enzymes all in the presence of 25 mM BES buffer, pH 7.5.
Inhibitors
CB29, one of the selective ALDH3A1 inhibitors discovered in our initial chemical screen,[34] was purchased from ChemBridge Corp. A structural search was performed using Pubchem in order to identify commercially available analogs with at least 90% structural similarity to CB29. Over 60 compounds were purchased from ChemBridge Corp. and ENAMINE Ltd., Kiev, Ukraine and Indiana University Chemical Synthesis and Organic Drug Lead Development Core. The purity of the compounds according to the vendor was >95%. Compounds were dissolved and diluted in 100% DMSO and stored at -20°C. The analogs were tested for their selectivity against ALDH1A1 and ALDH2 and ALDH3A1 at 100 μM. Compounds that showed selectivity for ALDH3A1 were designated as follows; 1– (ENAMINE– T05126153), 2 – (ENAMINE– T5477154), 3-(ENAMINE– T6032083), 4– (ENAMINE– T5237743), 5– IUSC12415, 6– IUSC12416, 7– (ENAMINE– T6036772), 8 – (ENAMINE– T6241917), 9 – (ENAMINE– T6560452), 10– (ENAMINE– T5477155), 11 – (ENAMINE– T5655673), 12– (ENAMINE– T6245968), 13 – (ENAMINE– T6053724), 14– (ENAMINE– T6536700), 15– (Chembridge Corp.– 5119656), 16– (Chembridge Corp.– 6809058), 17 – (ENAMINE– T56333437), 18 – (ENAMINE– T5395179), 19– (ENAMINE– T5804455) and 20– IUSC12417.
IC50 determination and competition experiments
IC50 values were determined for CB29 and its analogs using propionaldehyde as the substrate for ALDH1A1 and ALDH2 or benzaldehyde as the substrate for ALDH3A1. The assays were performed on a Beckman DU-640 spectrophotometer at various concentrations of inhibitors ranging from 50 nM to 250 μM following a 1 minute pre-incubation. There was no pre-incubation time-dependence to the inhibition. All reactions were initiated by the addition of the aldehyde substrate. The inhibition curves were fit to the Logistic four parameter IC50 equation using the SigmaPlot (v11, StatSys). We characterized the mode of inhibition using steady-state kinetics through co-variation of inhibitor and substrate concentrations. The steady state kinetic measurements were performed in 100 mM Na2HPO4 buffer, pH 7.5. The reaction mixture contained 10 nM ALDH3A1, varied benzaldehyde (50 μM− 800μM; fixed NADP+, 1.5 mM) and varied inhibitor concentrations. In all cases- including the control reactions lacking inhibitors, the final reaction mixture contained 2% (v/v) DMSO. The reaction was initiated by addition of substrate and the initial rate of product formation was determined on a Beckman DU-640. All data were fit to the non-linear velocity expressions for competitive, non-competitive, mixed-type non-competitive and uncompetitive inhibition.[39] Appropriateness of the inhibition model was determined through analysis of goodness-of-fit and the residuals of those fits. Lineweaver-Burke plots were created using SigmaPlot (v11, StatSys) to visualize the inhibition patterns. All data represent the average of three independent experiments utilizing triplicate assays at each concentration point.
Preparation and crystallization of ALDH3A1 with CB29
ALDH3A1 crystals were grown from solutions containing 0.2 M potassium acetate, 20% PEG 3350 at 25°C. The enzyme concentration was between 3 and 3.5 mg/mL in 10 mM HEPES buffer, pH 7.5. Two crystal morphologies form under these conditions; orthorhombic plates and triclinic parallel-pipeds. The triclinic ALDH3A1 crystals were initially soaked with 2% DMSO for 24 hours followed by another 24 hour soak with 500 μM CB29 [2% (v/v) DMSO final]. Crystals were frozen directly in gaseous nitrogen stream at 100K without additional cryoprotectant. Datasets were collected at a wavelength of 0.9869 Å at 100 K at the Advanced Photon Source using the GM/CA-CAT beamline 23-ID located at Argonne National Laboratory. The diffraction data was indexed, integrated and scaled using the HKL3000 program.[40] All refinements were performed using the program package Refmac5 as implemented in the CCP4 program suite.[41] Structure of CB29 bound to ALDH3A1 was solved using the apo-form of ALDH3A1 structure as the search model (RCSB code 3SZA). Molecular replacement was performed using MolRep program provided by CCP4 Interface software. Initial maps showed clear electron density for the CB29 ligand bound on the active site of each monomer in the asymmetric unit. Atomic co-ordinate of CB29 was included in later stages of refinement. Water molecules were added after the addition of ligands in order to obtain an unbiased map for ligands. Ligand maps were sketched in Sketcher (provided by CCP4). This structure was used to create library description file and a coordinate file for the ligand, which were later used for refinement.
Cell culture and western blot analysis
A549, CCD-13Lu and SF767 cell lines were provided by Dr. Hua Lu, ATCC and Dr. Karen Pollok, respectively. A549 and CCD13Lu cells were cultured in DMEM (Cellgro, Mediatech Inc) supplemented with 10% FBS (Gibco, Invitrogen) and 100 units/mL of penicillin and 10 μg/mL of streptomycin. SF767 cells were cultured in IMDM (Gibco, Invitrogen) supplemented with 10% FBS and 100 units/mL of penicillin and 10 μg/mL of streptomycin. Cells were cultured until they were 80-90% confluent and cell viability was >95%. A549 and SF767 cells were passaged every 3-4 days whereas CCD13Lu cells were passaged every 10-12 days. Cells (A549, SF767 and CCD-13Lu) were washed with ice cold PBS to remove residual media. 400 μL of RIPA buffer (Cell signaling technologies) containing 1 mM PMSF (Sigma Aldrich) was added to each 10 cm dish. Plates were incubated on ice for 5 minutes, scraped and lysates were collected. Lysates were centrifuged for 10 minutes at 16,000xG in a micro-centrifuge at 4°C. Protein concentrations were measured using the Bradford reagent (Biorad Laboratories). A549, SF767 and CCD-13Lu cell lysates were resolved in 10% SDS-PAGE. ALDH3A1 antibody was used at a dilution of 1:5000 and ALDH1A1 antibody was used at a dilution of 1:1000. GAPDH (1:5000) was used as a loading control. Proteins bound to antibodies were visualized using a HRP chemiluminescence blot detection solution prepared in our lab.
Cell lysate activities in the presence and absence of CB29
A549, SF767 and CCD-13Lu cell lysates were collected exactly the same way as described before and 50 μg of cell lysate was used in the activity assay. ALDH3A1 activity in cell lysates were measured in 100 mM Na2HPO4 buffer at pH 7.5, with 1.5 mM NADP+, 1 mM benzaldehyde. Activity assay was also performed with 1 μg of recombinant ALDH3A1 in the presence and absence of CB29. All assays contained 1% (v/v) DMSO. CB29 was tested at 50 μM concentration to monitor the extent of ALDH inhibition in these cell lysates and purified ALDH3A1. Lysates were treated with CB29 for 1 minute before the substrate was added.
Colorimetric MTT assay for mafosfamide sensitivity
The MTT assay was used to measure the extent of mafosfamide chemosensitivity. Mafosfamide was used for this study primarily because it is an analog of cyclophosphamide that does not require cytochrome P450 for its activation which is ideal for cell based studies.[42] The MTT assay was optimized for three cell lines such that the number of cells utilized for the experimental treatments corresponded to the linear range of the assay measurements. Three cell lines, A549, SF767 and CCD-13Lu were chosen for this study. These cell lines were chosen because our western blot results showed that A549 expresses ALDH1A1 and ALDH3A1, SF767 express only ALDH3A1 whereas CCD-13Lu expresses neither of these enzymes and are non-tumorigenic. CCD-13Lu was also relevant for this study because they are primary lung fibroblasts which serve as a proper control for A549, which is a tumorigenic cell line from lung. An optimization trial was performed for lung adenocarcinoma (A549), glioblastoma (SF767) and primary lung fibroblasts (CCD-13Lu) to find the approximate ED50 value of mafosfamide; 125 μM for A549 cells, 150 μM for SF767 cells and 40 μM for CCD-13Lu cells (Figure S2). Following optimization, A549 (5,000 cells/well), SF767 (10,000 cells/well) and CCD-13Lu (5,000 cells/well) cells were seeded in 96 well plates. After 29 hours, A549 and SF767 cells were treated with ALDH3A1 inhibitors (17, 2, 18, 19, 11, 8, 9, 10, CB29) in the absence or in the presence of 125 μM mafosfamide. The MTT assay was carried out following 19 hours of incubation with the inhibitors (0.25% DMSO) and/or mafosfamide. The relative percentage of cell proliferation was calculated in comparison to DMSO (0.25%) treated controls. The time points for treatment were chosen based on similar experiments performed earlier.[30]
Supplementary Material
Acknowledgements
We thank Dr. Lan Chen from Indiana University Chemical Genomics facility for the assistance provided for high throughput screening. We thank Dr. Samantha Perez Miller, Lanmin Zhai and Dr. Sulochanadevi Baskaran for technical assistance with production of ALDH3A1, Dr. Maureen Harrington for providing access to cell culture facility, Dr. Clark Wells for providing access to Spectromax. Results shown in this report are derived from work performed at the Argonne National Laboratory. The Argonne National Laboratory is operated by the University of Chicago Argonne, LLC, for the United States Department of Energy Office of Biological and Environmental Research under Contract DE-AC02-06CH11357. This research was supported by the U.S. National Institute of Health [Grants R01AA018123, R01AA019746] to TDH; and an IUSM Core Pilot grant to TDH, CA122298 and Ralph W. and Grace M. Showalter Research Trust Fund to MLF. Thomas D. Hurley holds significant financial equity in SAJE Pharma, LLC. However, none of the work described in this study is related to, based on or supported by the company.
Footnotes
Supplementary figures showing the list of compounds obtained from the screen, ED50 curves of mafosfamide on cells and immunoblots quantitating the amount of ALDH1A1 and ALDH3A1 on A549 and SF767 cells are included. Supplementary table 1 shows steps followed for screening. Supporting information for this article is available on the WWW under http://www.chembiochem.org or from the author.
PDB accession number: The atomic coordinates and the crystallographic structure factor of aldehyde dehydrogenase 3A1 in complex with CB29 have been deposited in the Protein Data Bank (http://www.rcsb.org/) with accession code 4H80.
References
- [1].Vasiliou V, Nerbert DW. Human Genomics. 2005;2:138–143. doi: 10.1186/1479-7364-2-2-138. [DOI] [PMC free article] [PubMed] [Google Scholar]
- [2].Harada S, Okubo T, Nakamura T, Fujii C, Nomura F, Higuchi S, Tsutsumi M. Alcohol Clinical and Experimental Research. 1999;23:958–962. [PubMed] [Google Scholar]
- [3].Larson HN, Zhou J, Chen Z, Stamler JS, Weiner H, Hurley TD. J. Biol. Chem. 2007;282(17):12940–19950. doi: 10.1074/jbc.M607959200. [DOI] [PMC free article] [PubMed] [Google Scholar]
- [4].Chen Z, Zhang J, Stamler JS. PNAS. 2002;99:8306–8311. doi: 10.1073/pnas.122225199. [DOI] [PMC free article] [PubMed] [Google Scholar]
- [5].Chen Z, Foster MW, Zhang J, Mao L, Rockman HA, Kawamoto T, Kitagawa K, Nakayama KI, Hess DT, Stamler JS. PNAS. 2005;102:12159–12164. doi: 10.1073/pnas.0503723102. [DOI] [PMC free article] [PubMed] [Google Scholar]
- [6].Yao L, Fan P, Arolfo M, Jiang Z, Olive MF, Zablocki J, Sun HL, Chu N, Lee J, Kim HY, Leung K, Shryock J, Blackburn B, Diamond I. Nature Medicine. 2010;16:1024–1028. doi: 10.1038/nm.2200. [DOI] [PMC free article] [PubMed] [Google Scholar]
- [7].Chen CH, Budas GR, Churchill EN, Disatnik MH, Hurley TD, Rosen DM. Science. 2008;321:1493–1495. doi: 10.1126/science.1158554. [DOI] [PMC free article] [PubMed] [Google Scholar]
- [8].Churchill EN, Disatnik MH, Mochly-Rosen D. Journal of Molecular and Cellular Cardiology. 2009;46:278–284. doi: 10.1016/j.yjmcc.2008.09.713. [DOI] [PMC free article] [PubMed] [Google Scholar]
- [9].Budas GR, Disatnik MH, Chen CH, Mochly-Rosen D. Journal of Molecular and Cellular Cardiology. 2010;48:757–764. doi: 10.1016/j.yjmcc.2009.10.030. [DOI] [PMC free article] [PubMed] [Google Scholar]
- [10].De LV, Rogers GR, Hamrock DJ, Marekov LN, Steinert PM, Compton JG, Markova N, Rizzo WB. Nature Genetics. 1996;12:52–57. doi: 10.1038/ng0196-52. [DOI] [PubMed] [Google Scholar]
- [11].Valle D, Goodman SI, Applegarth DA, Shih VE, Phang JM. Journal of Clinical Investigation. 1976;58:598–603. doi: 10.1172/JCI108506. [DOI] [PMC free article] [PubMed] [Google Scholar]
- [12].Geraghty MT, Vaughn D, Nicholson AJ, Lin WW, Jimenez-Sanchez G, Obie C, Flynn MP, Valle D, Hu CA. Human Molecular Genetics. 1998;7(9):1411–1415. doi: 10.1093/hmg/7.9.1411. [DOI] [PubMed] [Google Scholar]
- [13].Marcato P, Dean CA, Giacomantonio CA, Lee PW. Cell Cycle. 2011;10(9):1378–1384. doi: 10.4161/cc.10.9.15486. [DOI] [PubMed] [Google Scholar]
- [14].Moreb JS, Baker HV, Chang LJ, Amaya M, Lopez MC, Ostmark B, Chou W. Mol. Cancer. 2008;(7):87. doi: 10.1186/1476-4598-7-87. [DOI] [PMC free article] [PubMed] [Google Scholar]
- [15].Moreb JS. Current Stem Cell Research and Therapy. 2008;3(4):237–246. doi: 10.2174/157488808786734006. [DOI] [PubMed] [Google Scholar]
- [16].Sreerama L, Sladek NE. Biochemical Pharmacology. 1993;45(12):2487–2505. doi: 10.1016/0006-2952(93)90231-k. [DOI] [PubMed] [Google Scholar]
- [17].Moreb JS, Mohuczy D, Ostamark B, Zucali JR. Cancer Chemotherapy and Pharmacology. 2007;59:127–136. doi: 10.1007/s00280-006-0233-6. [DOI] [PubMed] [Google Scholar]
- [18].Muzio G, Maggiora M, Paiuzzi E, Oraldi M, Canuto RA. Free Radical Biology and Medicine. 2012;52(4):735–746. doi: 10.1016/j.freeradbiomed.2011.11.033. [DOI] [PubMed] [Google Scholar]
- [19].Emadi A, Jones RJ, Brodsky RA. Nat. Rev. Clin. Oncology. 2009;6(11):638–647. doi: 10.1038/nrclinonc.2009.146. [DOI] [PubMed] [Google Scholar]
- [20].Sreerama L, Rekha GK, Sládek NE. Biochemical Pharmacology. 1995;49:669–675. doi: 10.1016/0006-2952(94)00503-e. [DOI] [PubMed] [Google Scholar]
- [21].Sreerama L, Sladek NE. Clinical Cancer Research. 1997;3:1901–1914. [PubMed] [Google Scholar]
- [22].Rekha GK, Sreerama L, Sladek NE. Biochem. Pharmacol. 1994;48(10):1943–1952. doi: 10.1016/0006-2952(94)90593-2. [DOI] [PubMed] [Google Scholar]
- [23].Rekha GK, Devaraj VR, Sreerama L, Lee MJ, Nagasawa HT, Sladek NE. Biochem. Pharmcol. 1998;55(4):465–474. doi: 10.1016/s0006-2952(97)00475-9. [DOI] [PubMed] [Google Scholar]
- [24].Boesch JS, Lee C, Lindahl RG. J. Biol. Chem. 1996;271:5150–5157. doi: 10.1074/jbc.271.9.5150. [DOI] [PubMed] [Google Scholar]
- [25].Lassen N, Bateman JB, Estey T, Kuszak JR, Nees DW, Piatigorsky J, Duester G, Day BJ, Huang J, Hines LM, Vasiliou V. J. Biol. Chem. 2007;282(35):25668–76. doi: 10.1074/jbc.M702076200. [DOI] [PMC free article] [PubMed] [Google Scholar]
- [26].Estey T, Cantore M, Weston PA, Carpenter JF, Petrash JM, Vasiliou V. J. Biol. Chem. 2007;282:4382–92. doi: 10.1074/jbc.M607546200. [DOI] [PubMed] [Google Scholar]
- [27].Sladek NE, Kollander R, Sreerama L, Kiang DT. Cancer Chemotherapy Pharmacology. 2002;49:309–21. doi: 10.1007/s00280-001-0412-4. [DOI] [PubMed] [Google Scholar]
- [28].Sreerama L, Sladek NE. Drug Metabolism and Disposition. 1995;23(10):1080–1084. [PubMed] [Google Scholar]
- [29].Hu G, Chong RA, Yang Q, Wei Y, Blanco MA, Li F, Reiss M, Au JL, Haffty BG, Kang Y. Cancer Cell. 2009;15:9–20. doi: 10.1016/j.ccr.2008.11.013. [DOI] [PMC free article] [PubMed] [Google Scholar]
- [30].Khanna M, Chen CH, Kimble-Hill A, Parajuli B, Perez-Miller S, Baskaran S, Kim J, Vasiliou V, Mochly-Rosen D, Hurley TD. J. Biol. Chem. 2011;286(50):43486–43494. doi: 10.1074/jbc.M111.293597. [DOI] [PMC free article] [PubMed] [Google Scholar]
- [31].Sladek NE. Current Pharm. Design. 1999;5:607–625. [PubMed] [Google Scholar]
- [32].Moreb JS, Gabr A, Vartikar GR, Gowda S, Zucali JR, Mohuczy D. Journal of Pharm. Exp. Ther. 2005;312:339–345. doi: 10.1124/jpet.104.072496. [DOI] [PubMed] [Google Scholar]
- [33].Giorgianni F, Bridson PK, Sorrentino BP, Pohl J, Blakley RL. Biochem. Pharmcol. 2000;60(3):325–338. doi: 10.1016/s0006-2952(00)00344-0. [DOI] [PubMed] [Google Scholar]
- [34].Parajuli B, Kimble-Hill AC, Khanna M, Ivanova Y, Meroueh S, Hurley TD. Chem. Biol. Interactions. 2011;191:153–158. doi: 10.1016/j.cbi.2011.02.018. [DOI] [PMC free article] [PubMed] [Google Scholar]
- [35].Lowe ED, Gao GY, Johnson LN, Keung WM. J. Med. Chem. 2008;51:4482–4487. doi: 10.1021/jm800488j. W.M. [DOI] [PubMed] [Google Scholar]
- [36].Hammen PK, Allali-Hassani A, Hallenga K, Hurley TD, Weiner H. Biochemistry. 2002;41:7156–7168. doi: 10.1021/bi012197t. [DOI] [PubMed] [Google Scholar]
- [37].Perez-Miller S, Hurley TD. Biochemistry. 2003;42:7100–7109. doi: 10.1021/bi034182w. [DOI] [PubMed] [Google Scholar]
- [38].Weiner H, Hu JH, Sanny CG. J. Biol. Chem. 1976;251(13):3853–3855. [PubMed] [Google Scholar]
- [39].Segel IH. Enzyme Kinetics: Behavior and Analysis of Rapid Equilibrium and Steady-State Enzyme Systems. 1993:100–159. [Google Scholar]
- [40].Minor W, Cymborowski M, Otwinowski Z, Chruszcz M. Acta Crystallogr. D. Biol. Crystallography. 2006;62:859–866. doi: 10.1107/S0907444906019949. [DOI] [PubMed] [Google Scholar]
- [41].Emsley P, Cowtan K. Acta Crystallogr. D. Biol. Crystallography. 2004;60:2126–2132. doi: 10.1107/S0907444904019158. [DOI] [PubMed] [Google Scholar]
- [42].Blaney SM, Balis FM, Berg S, Arndt CAS, Heideman R, Geyer JR, Packer R, Adamson PC, Jaeckle K, Klenke R, Aikin A, Murphy R, McCully C, Poplack DG. Journal of Clinical Oncology. 2005;23(7):1555–1563. doi: 10.1200/JCO.2005.06.053. [DOI] [PubMed] [Google Scholar]
Associated Data
This section collects any data citations, data availability statements, or supplementary materials included in this article.