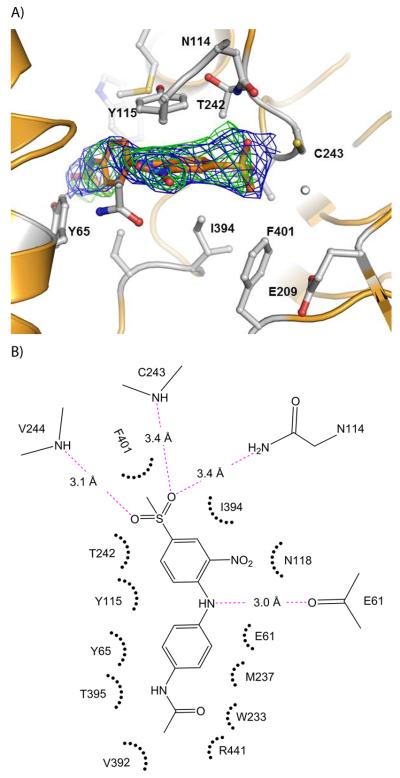
Figure 2.
Structure of human ALDH3A1 with CB29. (A) The active site of ALDH3A1. The electron density maps displayed are the original figure of merit (σ-A weighted) Fo-Fc map contoured at 2.5 standard deviations (green) and the original figure-of-merit weighted 2Fo-Fc map contoured at 1 standard deviation (blue) superimposed on the final refined model of CB29 bound in the enzyme active site. (B) Two dimensional representation of the important contacts between CB29 and residues within the active site of ALDH3A1. The pink dotted lines represent potential hydrogen bonding interactions. The distance shown is the average of the distances observed in the eight subunits of the asymmetric unit. Hydrophobic and van der Waals contacts are represented by radiating arcs radiating towards the ligand. This figure was generated using PyMol for Windows, version 0.99 and ChemBioDraw Ultra 12.0, respectively.

