
Figure 4.
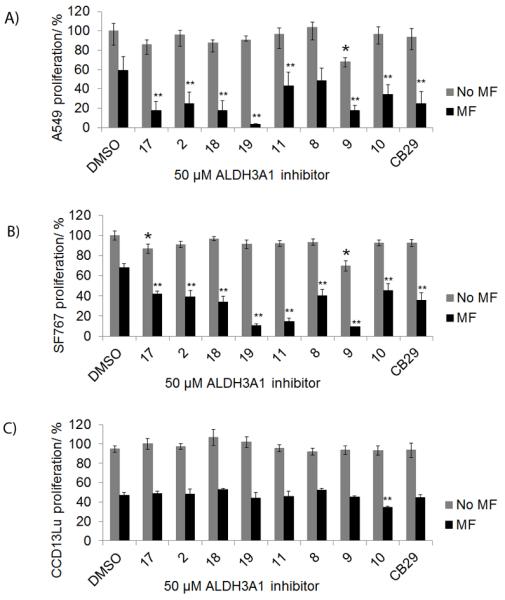
Sensitization of tumor cells to mafosfamide with ALDH3A1 inhibitors. Cells were simultaneously treated with mafosfamide (MF) in combination with ALDH3A1 inhibitors (50 μM). A549 (A) and SF767 (B) cells were treated with mafosfamide (125 μM) for 19 hours. (C) CCD-13Lu cells treated with 40 μM mafosfamide for 19 hours. Cell proliferation was determined was determined using the MTT assay. The DMSO concentration was limited to 0.25% (v/v). P values were calculated by comparing the cellular proliferation of DMSO treated cells versus ALDH3A1 inhibitor treated cells (*, p<0.05, n = 15) or mafosfamide (MF) treated cells versus (MF + 50 μM Inhibitor) treated cells (**, p<0.005, n = 15). Grey bars represent ALDH3A1 inhibitor treatment alone and black bars represent ALDH3A1 inhibitor and mafosfamide treatment. Each bar represents the mean value ± SE.