

Abstract
Combining datasets across independent studies can boost statistical power by increasing the numbers of observations and can achieve more accurate estimates of effect sizes. This is especially important for genetic studies where a large number of observations are required to obtain sufficient power to detect and replicate genetic effects. There is a need to develop and evaluate methods for joint-analytical analyses of rich datasets collected in imaging genetics studies. The ENIGMA-DTI consortium is developing and evaluating approaches for obtaining pooled estimates of heritability through meta-and mega-genetic analytical approaches, to estimate the general additive genetic contributions to the intersubject variance in fractional anisotropy (FA) measured from diffusion tensor imaging (DTI). We used the ENIGMA-DTI data harmonization protocol for uniform processing of DTI data from multiple sites. We evaluated this protocol in five family-based cohorts providing data from a total of 2248 children and adults (ages: 9–85) collected with various imaging protocols. We used the imaging genetics analysis tool, SOLAR-Eclipse, to combine twin and family data from Dutch, Australian and Mexican-American cohorts into one large “mega-family”. We showed that heritability estimates may vary from one cohort to another. We used two meta-analytical (the sample-size and standard-error weighted) approaches and a mega-genetic analysis to calculate heritability estimates across-population. We performed leave-one-out analysis of the joint estimates of heritability, removing a different cohort each time to understand the estimate variability. Overall, meta- and mega-genetic analyses of heritability produced robust estimates of heritability.
Keywords: Diffusion Tensor Imaging (DTI), Imaging Genetics, Heritability, Meta-analysis, Multi-site, Reliability
I. INTRODUCTION
Human brain mapping studies have shown substantial advantages of pooling data across multiple studies (Van Horn et al., 2004). Genetic analyses, particularly genome-wide association studies (GWAS), tend to be limited in statistical power as there is typically a small (< 0.5%, Flint and Munafo, 2013) contribution to complex phenotypic variability from individual, common genetic variants. This limitation is especially problematic for imaging genetic studies of human brain. The structure and function of the human brain is greatly influenced by genetics, but the proportion of the variance due to individual differences in the human genome depends on the brain structure and measure assessed (Kochunov et al., 2009; Kochunov et al., 2010).
A large number of neuroimaging traits with ever-increasing spatial resolution are becoming increasingly available to describe the regional complexity of brain variability. This presents a daunting challenge where the number of degrees of freedom, in both the imaging and genetics, can be overwhelming for any single imaging-genetic study. Therefore, data pooling strategies are crucial whereby data from multiple large imaging genetics studies can be analyzed together.
Imaging and genetics have both greatly advanced neuroscience in recent years. The two fields have developed in parallel but in the last decade, there was a push to merge them to fully capitalize on their power leading to development of the new field of imaging genetics. This field emerged as a variation of classical genetic analyses that related diagnostic, clinical and/or behavioral measures to locations and specific variants in the genome. This new field is thought to be able to provide new approaches to characterize, treat and potentially prevent some brain-related disorders. Insight into biological mechanisms that predispose individuals to these types of illnesses holds the promise of yielding potential new therapies and a significant reduction of this considerable burden. Advantages of imaging genetics include the presumed greater biological proximity to genetic variation and the quantitative nature of imaging phenotypes, which ideally suited for partitioning phenotypic variance into variance explained by genetic and environmental factors. Therefore, the statistical power of genetic analysis depends on both the closeness of a phenotype to the action of the gene and the precision of the measurements. Modern MRI offers phenotypic measurements that may provide a more detailed description of the disorder than clinical symptoms or neuropsychological assessments, and many of these measures have high precision and reproducibility. Our experience and that of others indicate that the inter-session, scan-rescan variability of many common imaging measurements can be low, in the range of 1–5% (Agartz et al., 2001; Julin et al., 1997; Kim et al., 2005; Kochunov and Duff Davis, 2009; Kochunov et al., 2012b; Lemieux et al., 1999; Lerch and Evans, 2005). Therefore, the imaging genetics approach may help ascertain effects of specific genetic variants on the human brain and may also discover genetic variants associated with neurological or psychiatric illnesses (Braskie et al., 2011; Chen et al., 2012; Glahn et al., 2007; Glahn et al., 2010; Hasler and Northoff, 2011; Thompson et al., 2001; van den Heuvel et al., 2012).
In imaging genetic studies, up to a million voxel-based imaging traits may be analyzed. The required correction for multiple comparisons may limit the statistical power for gene discovery, even in the largest individual imaging studies of hundreds or even thousands of subjects. One solution is collaborative data sharing and pooling through consortia such as Enhancing Neuroimaging Genetics through Meta-Analysis (ENIGMA) Consortium (http://enigma.ini.usc.edu). Recent examples highlight the potential of large, meta-analyses of genome-wide association studies (GWAS) to uncover genetic loci that are reliably and consistently associated with MRI-based phenotypes in worldwide datasets, including hippocampal volumes (Bis et al., 2012; Stein et al., 2012), intracranial volumes (Ikram et al., 2012; Stein et al., 2012), and head circumference (Taal et al., 2012). Recently, the ENIGMA-DTI Consortium working group was organized to develop methods to facilitate multi-site approaches to study genetic influences on white matter microarchitecture and integrity, assessed using diffusion tensor imaging (DTI). Here we specifically focus on the fractional anisotropy (FA) as it is the most commonly analyzed scalar parameter extracted from DTI (Basser et al., 1994; Basser and Pierpaoli, 1996). The absolute FA values are sensitive to fiber coherence, myelination levels, and axonal integrity, and have been widely used as an index of white matter integrity (Thomason and Thompson, 2011). FA has emerged as a sensitive index of diffuse abnormalities in many brain disorders including Alzheimer’s disease (AD) (Clerx et al., 2012; Teipel et al., 2012); in many studies, it is related to cognitive performance (Penke et al., 2010a; Penke et al., 2010b) and is altered in numerous psychiatric disorders including major depressive disorder (Carballedo et al., 2012) and bipolar disorder (Barysheva et al., 2012; Sprooten et al., 2011). Patient-control differences in FA values are also among the most replicable and consistent neuroimaging findings in schizophrenia (Alba-Ferrara and de Erausquin, 2013; Friedman et al., 2008; Kochunov et al., 2012a; Mandl et al., 2012; Nazeri et al., 2012; Perez-Iglesias et al., 2011).
The goal of the ENIGMA-DTI Working Group is to develop generalizable analyses, methods, and techniques for extraction and combined genetic analysis of phenotypes from DTI data collected from imaging groups around the world, regardless of the imaging acquisition or specific population under study. Its overall aim is to discover genetic factors influencing or related to white matter architecture. The first step towards this goal was the development of homogenization protocols to reliably extract phenotypic measurements from data collected with different imaging equipment and parameters (Jahanshad et al., 2013b). The next step is to evaluate different statistical approaches for data pooling and specifically compare meta and mega analytical techniques to choose one approach that yields the greatest improvements in the power of genetic discovery while accommodating for potential for genetic diversity among samples. Two specific advantages of data pooling are the increased power for genetic discovery and the genetic diversity of the population sample. Data pooling makes it easier to identify genetic variants that exert only small individual effects (Zuk et al., 2012). However, pooling data may be confounded by variations in data acquisition across datasets, heterogeneities in study population, and other factors. Another limitation to data pooling arises from restrictions that can arise with sharing raw data (both ethical and regulatory), including either phenotypic or genetic information.
Here, we tested and compared the outcomes of three approaches to pool imaging genetic data from five separate cohorts worldwide, that had used various imaging acquisition parameters and population structures for analysis of heritability of the DTI-FA. Of course the ultimate goal is to detect specific variants on the genome that relate to DTI measures; but in the past we have found it boosts power in GWAS to first rank phenotypes by heritability, discarding the least promising ones for data and dimensionality reduction (Jahanshad et al., 2013b).
Two different approaches were used to perform aggregation of heritability estimates derived from each cohort individually, known as meta-analytical pooling, where no raw data were shared between sites. One meta-analytic approach tested here weighted heritability estimates by the standard errors derived from the heritability estimates (MA-SE) (Borenstein et al., 2009); the other approach, although not optimal in this scenario as explained in the discussion, is commonly used for meta-analysis of heritability estimates of twin-only studies (Bergen et al., 2007; Rhee and Waldman, 2002) and therefore was used here for comparison; it involves weighting individual results by the total number of subjects per sample (MA-N). The third approach, the “mega-analytic” approach, individually normalizes each cohort to the same imaging template, and then pools together all data. For a mega-analytic GWAS all individual subject genotype information, or some imputed version of it, would commonly be shared. But in the case presented here, as we were not performing a genome-wide scan, the shared data included only the population and family structure of the cohort in addition to the FA images and covariate information.
All data was processed using the harmonization protocol previously developed by our group ((Jahanshad et al., 2013b) provided on-line at http://enigma.ini.usc.edu/ongoing/dti-working-group/). This included the use of the ENIGMA protocol for following the QA/QC steps for each site, registration to the ENIGMA-DTI target, extraction of white matter skeleton, followed by extraction of tract-average FA values. After processing all datasets with this protocol, we performed heritability analyses using the Sequential Oligogenic Linkage Analysis Routines (SOLAR) software package (http://www.nitrc.org/projects/se_linux) (Almasy and Blangero, 1998) for tract-average FA values as well as on a detailed voxel-wise level. The data pooling approaches we compared to assess power and stability in estimation.
As an extension of our prior paper, this paper presents much deeper view of DTI heritability in the largest sample ever analyzed. With an unprecedented sample size of over 2200 scans, which to the best of our knowledge is the largest for a DTI imaging genetics study – or any DTI study, for that matter - we show the ability to measure heritability consistently across populations in a multi-site manner and provide estimates with narrower confidence intervals, which is sorely needed in heritability analyses. We approximately double our previous sample size and extend our analyses to include populations of children. Our goal was to determine whether, regardless of population, we are able to prioritize targets for GWAS with respect to stability, reliability, and heritability estimates. We provide our combined heritability results online at http://enigma.ini.usc.edu/ongoing/dti-working-group/.
II. METHODS
2.1 Study Subjects and Imaging Protocols
Five datasets (GOBS, QTIM, TAOS, NTR, and BrainSCALE; the acronyms are detailed below) contributed data from 2203 subjects, aged 9–85 years (Table 1). All datasets were family-based studies that allowed for measurements of heritability.
Table 1.
Demographic and imaging information for the 5 cohorts used in this study are listed.
| GOBS | QTIM | TAOS | Adults NTR | BrainSCALE NTR | |
|---|---|---|---|---|---|
| Relatedness | Pedigree | Twins and siblings | Twins and siblings | Twins | Twins |
| Race/Ethnicity | Mexican-American | Caucasian | Caucasian | Caucasian | Caucasian |
| Number Subjects contributed | 859 | 625 | 319 | 246 | 199 |
| Sex | 351M/508F | 231M/394F | 158M/161F | 93M/153F | 100M/99F |
| Age range (yrs.) | 19–85 | 21–29 | 12–15 | 18–45 | 9–10 |
| Healthy | Yes | Yes | Yes | Yes | Yes |
| Scanner | Siemens | Bruker/ Siemens | Siemens | Intera | Achieva |
| N-acquisitions | 1 | 1 | 1 | 1 | 2 |
| Field Strength | 3T | 4T | 3T | 3T | 1.5T |
| Voxel size (mm) | 1.7x1.7x3.0 | 1.8x1.8x2 | 1.7x1.7x3.0 | 2.5x2.5x2.5 | 2.5x2.5x2.5 |
| N-gradients | 55 | 94 | 55 | 32 | 32 |
| N-b0 | 3 | 11 | 3 | 1 | 8 |
| b-value (s/mm2) | 700 | 1159 | 700 | 1000 | 1000 |
| Reference | Kochunov et al., 2011b | de Zubicaray et al., 2008 | Kochunov et al., 2011b | den Braber et al., 2013 | Brouwer et al., 2010 |
-
GOBS – Genetics of Brain Structure and Function study
Subjects: The sample comprised 859 (351M/508F, mean age: 43.2±15.0) Mexican-American individuals from 73 extended pedigrees (average size, 17.2 people, range = 1–247) from the San Antonio Family Study (Olvera et al., 2011). Only 814 subjects in the sample (350M/464F, mean age 43.1±15.2, ranging from 19 to 85 years) had a significant genetic relationship with other subjects and provided contribution to the heritability measurement. However, the entire sample was used to estimate the covariate effects. Individuals in this cohort have actively participated in research for over 18 years and were randomly selected from the community with the constraints that they are of Mexican-American ancestry, part of a large family, and live in the San Antonio region. All participants provided written informed consent on forms approved by the Institutional Review Boards at the University of Texas Health Science Center San Antonio (UTHSCSA) and Yale University before participating in any aspect of the study. Imaging: All imaging was performed at the Research Imaging Institute, UTHSCSA, on a Siemens 3T Trio scanner using a multichannel phased array head coil. A single-shot single refocusing spin-echo, echo-planar imaging sequence was used to acquire diffusion-weighted data with a spatial resolution of 1.7 × 1.7 × 3.0 mm. The sequence parameters were: TE/TR = 87/8000 ms, FOV = 200 mm, 55 isotropically distributed diffusion weighted directions, two diffusion weighting values, b = 0 and 700 s/mm2 and three b = 0 (non-diffusion-weighted) images.
-
QTIM – the Queensland Twin IMaging study
Subjects: The sample comprised of 625 young adult Australian twins and siblings (231M/394F, average age=22.9±2.1 year, range 21–29), all of European ancestry. The sample including 79 monozygotic (MZ) pairs, and 80 dizygotic (DZ) pairs and their siblings. Additional information on the cohort, inclusion and exclusion criteria, and the study goals may be found in (de Zubicaray et al., 2008).
Imaging: A high angular resolution diffusion imaging protocol was used, consisting of a 14.2-minute, 105-image acquisition, with a 4-Tesla Bruker Medspec MRI scanner. Imaging parameters were: TR/TE=6090/91.7 ms, FOV=23 cm, with a 128x128 acquisition matrix. Each 3D volume consisted of 55 2-mm thick axial slices with no gap and 1.8x1.8 mm2 in-plane resolution. 105 images were acquired per subject: 11 with no diffusion sensitization (i.e., T2-weighted b0 images) and 94 diffusion-weighted (DW) images (b = 1159 s/mm2) with gradient directions uniformly distributed on the hemisphere.
-
TAOS – the Teen Alcohol Outcomes Study.
Subjects: The sample comprised of 319 twin and sibling adolescent participants (158M/161F) residing in San Antonio, Texas. Subjects were aged 12 to 15 years, average age: 13.4 yr ± 0.96 SD at the time of imaging. The study consisted of 12 pairs of twins (MZ=4/DZ=8) and siblings with the average family size of 2.1±0.2. All subjects were healthy and free of drug abuse at the time of the imaging. All subjects and their parents signed informed assents and informed consents, respectively.
Imaging: Diffusion imaging was performed at the Research Imaging Center, UTHSCSA, on a Siemens 3T Trio scanner the same protocol as GOBS study.
-
NTR – Netherlands Twin Register
Subjects: Subjects: 246 adults (93/153 M/F; average age 33.9±10.1, range 19–57), mono and dizogotic twin pairs (72/48/6 MZ/DZ/Sibs), were recruited from the Netherlands Twin Registry. Exclusion criteria consisted of having any metal material in the head, having a pacemaker, a known history of any major medical condition or psychiatric illness.
Imaging: Diffusion tensor data were collected on a 3.0T Philips Intera MR scanner (32 diffusion-weighted volumes with different non-collinear diffusion directions with b-factor = 1000 s/mm2 and one b-factor = 0 s/mm2 image, flip angle = 90 degrees; 38 axial slices of 3.0 mm; no slice gap; voxel size, 2.0 × 2.0 × 3.0 mm; FOV = 230 mm; TE = 94 ms; TR = 4863 ms; no cardiac gating; and total scan duration = 185 s).
-
BrainSCALE–Brain Structure and Cognition: an Adolescent Longitudinal Twin Study into genetic Etiology
University Medical Center Utrecht and Netherlands Twin Register, Amsterdam
Subjects: 199 children (100M/99F; average age 9.2±0.1, range 9.0–9.6), mono and dizygotic twin pairs (42/57 MZ/DZ), were recruited from families participating in the BrainSCALE cohort (van Soelen et al., 2012) that was recruited from the Netherlands Twin Register (van Beijsterveldt et al., 2013). Imaging of this cohort was performed in the University Medical Center Utrecht (Peper et al., 2009). Exclusion criteria consisted of having any metal material in the head, having a pacemaker, a known history of any major medical condition or psychiatric illness. Zygosity was determined based on DNA polymorphisms, using 8–11 highly polymorphic di-, tri- and tetranucleotide genetic markers and confirmed by genome-wide single nucleotide polymorphism (SNP) data. All subjects and their parents signed informed assents and informed consents, respectively. The study was approved by the Central Committee on Research involving Human Subjects of the Netherlands (CCMO) and was in agreement with the Declaration of Helsinki (Edinburgh amendments).
Imaging: MRI data were collected on a 1.5 Philips Achieva MR scanner (32 diffusion-weighted volumes with different non-collinear diffusion directions with b-factor = 1000 s/mm2 and 8 diffusion-unweighted volumes with b-factor = 0 s/mm2; parallel imaging SENSE factor = 2.5; flip angle = 90 degrees; 60 slices of 2.5 mm; no slice gap; 96 × 96 acquisition matrix; reconstruction matrix 128 × 128; FOV = 240 mm; TE = 88 ms; TR = 9822 ms; two repetitions; no cardiac gating; and total scan duration = 296 s). More information may be found in (Brouwer et al., 2010; Brouwer et al., 2012).
2.2 ENIGMA-DTI processing
We used the ENIGMA-DTI protocols for multi-site processing and extraction of tract-wise average FA values as described in our prior work (Jahanshad et al., 2013b). Briefly, FA images from all subjects were non-linearly registered to ENIGMA target brain using FSL fnirt (Smith et al., 2006; Smith et al., 2007) as a default registration. This target was created from the images of the participating studies as the minimal deformation target as previously described (Jahanshad et al., 2013b). The data were then processed using the tract-based spatial statistics (TBSS) analytic method (Smith et al., 2006; Smith et al., 2007) modified to project individual FA values on the ENIGMA-DTI skeleton. Following the extraction of the skeletonized white matter and projection of individual FA values, ENIGMA-tract-wise regions of interest, derived from the Johns Hopkins University (JHU) white matter parcellation atlas (Mori et al., 2008), were transferred to extract the mean FA across the full skeleton and average FA values for twelve major white matter tracts, breaking down the corpus callosum into 3 regions, for a total of 15 ROIs. The regions analyzed are listed in Table 2. The full brain average FA values were calculated to include all voxels in the ENIGMA-DTI skeleton, not just those voxels in the segmented regions of interest, thereby also including peripheral white matter regions. The protocol, target brain, hand-segmented skeleton mask, source code and executables, are publicly available (http://enigma.ini.usc.edu/ongoing/dti-working-group/). Finally, we analyze the voxelwise FA value along the ENIGMA skeleton mask.
Table 2.
Regions of interest (ROIs) examined along the ENIGMA-DTI skeleton as defined by the JHU white matter parcellation atlas (Mori et al., 2008). Analyses for other JHU ROI are provided in the Supplement.
| Average Skeleton FA | |
|---|---|
| GCC | Genu of the corpus callosum |
| BCC | Body of corpus callosum |
| SCC | Splenium of corpus callosum |
| FX | Fornix |
| CGC | Cingulum (cingulate gyrus) - L and R combined |
| CR | Corona radiata - L and R anterior and posterior sections combined |
| EC | External capsule - L and R combined |
| IC | Internal capsule - L and R anterior limb, posterior limb, and retrolenticular parts combined |
| IFO | Inferior fronto-occipital fasciculus - L and R combined |
| PTR | Posterior thalamic radiation - L and R combined |
| SFO | Superior fronto-occipital fasciculus |
| SLF | Superior longitudinal fasciculus |
| SS | Sagittal stratum (include inferior longitudinal fasciculus and inferior fronto-occipital fasciculus) - L and R combined |
| CST | Corticospinal tract |
2.3 Single-site heritability estimation: Analysis of additive genetic variance
The variance components method, as implemented in the Sequential Oligogenic Linkage Analysis Routines (SOLAR) software package (http://www.nitrc.org/projects/se_linux) (Almasy and Blangero, 1998) was used for all individual cohort heritability estimations. Briefly, the algorithms in SOLAR employ maximum likelihood variance decomposition methods and are an extension of the strategy developed by (Amos, 1994). The covariance matrix Ω for a pedigree of individuals is given by:
| (1) |
where σg2 is the genetic variance due to the additive genetic factors, Φ is the kinship matrix representing the pair-wise kinship coefficients among all individuals, σe2 is the variance due to individual-specific environmental effects, and I is an identity matrix (under the assumption that all environmental effects are uncorrelated among family members). Narrow sense heritability is defined as the fraction of phenotypic variance σP2 attributable to additive genetic factors,
| (2) |
The variance parameters are estimated by comparing the observed phenotypic covariance matrix with the covariance matrix predicted by kinship (Almasy and Blangero, 1998). Significance of heritability is tested by comparing the likelihood of the model in which σg2 is constrained to zero with that of a model in which σg2 is estimated. Twice the difference between the loge likelihoods of these models yields a test statistic, which is asymptotically distributed as a 1/2:1/2 mixture of a χ2 variable with 1 degree-of-freedom and a point mass at zero. Prior to testing for the significance of heritability, phenotype values for each individual within the cohort were adjusted for covariates including sex, age, age2, age x sex interaction, age2 x sex interaction. Inverse Gaussian transformation was also applied to ensure normality of the measurements. Outputs from SOLAR include the heritability value, the significance value (p), and the standard error for each trait (ROI or voxel).
2.4 Mega-and-Meta genetic analysis of additive genetic variance
A mega-analysis function ‘polyclass’ was recently developed for the software package, SOLAR-Eclipse (Blangero et al., 2005). It was implemented in the LONI Pipeline infrastructure (Dinov et al., 2010) and used for both voxelwise and ROI-level analyses. This function 1) fitted a model for each of the sites separately, and 2) performed the mega-analysis where the data for all populations is fitted together using a single model. The processing steps for this function are shown in Figure 1. The trait average and variability values can vary by site due to study design and measurement biases as shown by non-overlapping histograms of average FA values (Figure 1A). Two data normalization steps are performed. In the first, the regression of covariates (as specified above) is performed, per site, and then followed by the per-site inverse Gaussian normalization of data (Figure 1B). Individual cohort heritability estimates are obtained by fitting a polygenic model per population. The heritability value, its significance, and standard error are tabulated for the meta-genetic analysis.
FIGURE 1.
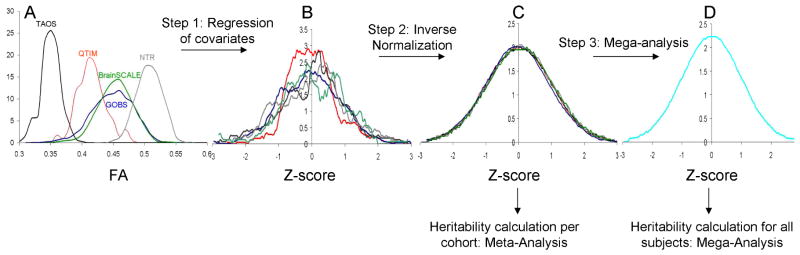
mega workflow
A mega-genetic analysis refers to analysis multiple cohorts combined into a single pedigree (Jahanshad et al., 2013b). In this step, a joint pedigree structure was created by merging the kinship matrices from all cohorts, and a polygenic model was then fit for the combined dataset. Meta-genetic analyses calculate weighted-mean heritability (h2) and standard error estimates based on measurements from individual cohorts (Li et al., 2003). We chose two methods to calculate the weights: by standard error (Sutton, 2000) and, for comparison with most other meta-analysis studies of heritability, by study sample1 (Verweij et al., 2010).
We weight the heritability from each study by the heritability standard error, as extracted from the variance component model of SOLAR. The heritability weighted by standard error (Sutton, 2000) is:
| (3) |
where v =1 to Nv indexes voxels or ROIs, and j = 1, …, 5 indexes site.
The mean heritability weighted by sample size is calculated as
| (4) |
As the heritability estimates for all datasets were computed with SOLAR, the standard error for the heritability at each voxel was also available. Therefore, we computed the joint standard error for each MA as follows:
| (5) |
| (6) |
Surprisingly, there is no standard method for calculating the significance, or p-value, for meta-analyses of such variance component estimates. The principal problem is the non-Normality of the heritability estimate, reflected in the fact that a variance component p-value cannot exceed ½. To demonstrate some possible approaches, we calculated the meta-analysis Z-score in two ways and compared results.
The first approach is based on individual cohort p-values; first they are transformed to cohort Z values according to zj(v) = Φ−1(pj(v)), where Φ represents the Gaussian normal transformation; if all p-values are strictly less than ½, this transformation is valid. These Z values are then combined into meta-analysis Z-scores following (Willer et al., 2010):
| (7) |
| (8) |
where, for the SE-weighted meta-analysis, each site’s effect is estimated as β̂j (v) = zj (v) × sej (v), which can be interpreted as z-scores in h2 SE units.
In the second approach for calculating p-values, the meta-analysis p-values are calculated from the meta-analysis heritability estimates and their standard error, without consulting individual cohort p-values. Specifically, these were found by computing z-scores for both MA-SE and MA-N methods, found as ratios of the and values (Eqs. (3) & (4)) with their standard errors (square root of Eqs. (5) & (6), respectively); from these z-scores, p-values were found based on the asymptotic Normality of maximum likelihood estimates (Lehmann and Casella, 1998).
2.5 Multiple comparisons correction
Multiple statistical tests performed across voxels and/or ROIs can increase the chance of reporting a false positive finding at a given significance threshold, unless steps are taken to control for multiple comparisons. We use the false discovery rate (FDR) (Benjamini and Hochberg, 1995; Genovese et al., 2002) approach for controlling false positives.
RESULTS
Heritability estimates for individual cohorts
Heritability analysis for the whole-brain average FA values demonstrated significant heritability for all five cohorts (Table 3, Figure 2). The highest heritability estimate was observed for the NTR cohort (h2=0.84±.03; p<10−10), while the lowest heritability was observed for the youngest cohort, BrainSCALE (h2=0.27±.13; p=.02); there were no significant differences between samples in the heritability estimates for the average FA values (1-way ANOVA p=0.07). The heritability for tract-wise average FA measurements were significant for all cohorts with exception of the TAOS cohort where heritability estimates for six tracts (EC, FX, IFO, SFO, SS, CST) had p>0.05. When correcting for multiple comparisons across all regions, the BCC and SCC were also not significant in TAOS. The CST was also not significantly heritable in QTIM or BrainSCALE cohorts; the SFO was alson not significantly heritable in BrainSCALE. Also of note is that with the exception of the two youngest cohorts (TAOS and BrainSCALE), the standard errors for regional measurements were similar for the three remaining cohorts (e.g., 0.06, 0.07, 0.07, vs 0.12 and 0.26 for GOBS, QTIM, NTR, vs. BrainSCALE and TAOS, for average FA respectively).
Table 3.
Individual cohort heritability results (and significance (p) values) for each ROI are listed along with the results for the joint analytic approaches. Meta-analysis p-values were computed in two ways as described in the Methods section, both of which are reported here. The first p-value presented in the MA columns uses individual cohort level data while the second is found directly from the MA heritability and SE values.
| GOBS | QTIM | TAOS | BrainSCALE | NTR |
Meta Analysis (SE) |
Meta Analysis (N) |
Mega Analysis |
|
|---|---|---|---|---|---|---|---|---|
| Whole-brain | 0.41±0.08 (5.98E-09) | 0.61±.05 (p<10−10) | 0.49±0.24 (0.04) | 0.27±0.13 (0.02) | 0.84±0.03 (p<10−10) | 0.71±0.03 (0, p<10− 10) | 0.51±0.05 (p<10−10, p<10−10) | 0.67±0.03 (p<10−10) |
| BCC | 0.49±0.08 (p<10−10) | 0.69±0.05 (p<10−10) | 0.69±0.19 (0.004) | 0.49±0.11 (7.70E-05) | 0.72±0.05 (p<10−10) | 0.65±0.03 (0, p<10− 10) | 0.60±0.04 (p<10−10, p<10−10) | 0.69±0.03 (p<10−10) |
| GCC | 0.48±0.09 (5.62E-10) | 0.59±0.06 (p<10−10) | 0.82±0.13 (4.01E-04) | 0.40±0.12 (9.54E-04) | 0.84±0.03 (p<10−10) | 0.75±0.02 (0, p<10− 10) | 0.60±0.04 (p<10−10, p<10−10) | 0.66±0.03 (p<10−10) |
| SCC | 0.56±0.09 (p<10−10) | 0.57±0.06 (p<10−10) | 0.52±0.17 (0.007) | 0.37±0.12 (0.002) | .78±.05 (p<10−10) | 0.66±0.03 (0, p<10− 10) | 0.57±0.05 (p<10−10, p<10−10) | 0.62±0.03 (p<10−10) |
| FX | 0.21±0.08 (8.23E-04) | 0.62±0.06 (p<10−10) | 0.50±0.29 (0.077) | 0.45±0.13 (0.001) | 0.53±0.08 (2.29E07) | 0.49±0.04 (0, p<10− 10) | 0.43±0.05 (p<10−10, p<10−10) | 0.56±0.04 (p<10−10) |
| CGC | 0.41±0.08 (2.16E-08) | 0.65±0.05 (p<10−10) | 0.78±0.20 (0.002) | 0.47±0.11 (1.14E-04) | 0.76±0.05 (p<10−10) | 0.66±0.03 (0, p<10− 10) | 0.58±0.05 (p<10−10, p<10−10) | 0.63±0.03 (p<10−10) |
| CR | 0.50±0.08 (p<10−10) | 0.77±0.04 (p<10−10) | 0.76±0.16 (.006) | 0.49±0.12 (3.03E-04) | 0.77±0.05 (p<10−10) | 0.73±0.03 (0, p<10− 10) | 0.64±0.04 (p<10−10, p<10−10) | 0.75±0.03 (p<10−10) |
| EC | 0.49±0.08 (4.03E-10) | 0.78±0.03 (p<10−10) | 0.02±0.37 (0.40) | 0.46±0.13 (7.68E-04) | 0.83±0.03 (p<10−10) | 0.77±0.02 (0, p<10− 10) | 0.54±0.06 (p<10−10, p<10−10) | 0.75±0.03 (p<10−10) |
| IC | 0.46±0.08 (5.55E-10) | 0.67±0.05 (p<10−10) | 0.62±0.21 (0.02) | 0.48±0.11 (1.26E-04) | 0.81±0.04 (p<10−10) | 0.71±0.03 (0, p<10− 10) | 0.58±0.05 (p<10−10, p<10−10) | 0.71±0.03 (p<10−10) |
| IFO | 0.37±0.09 (1.54E-06) | 0.68±0.05 (p<10−10) | 0.26±0.44 (0.22) | 0.65±0.08 (4.26E-08) | 0.81±0.04 (p<10−10) | 0.71±0.03 (0, p<10− 10) | 0.51±0.07 (p<10−10, p<10−10) | 0.73±0.03 (p<10−10) |
| PTR | 0.38±0.08 (2.48E-09) | 0.72±0.04 (p<10−10) | 0.48±0.19 (0.01) | 0.39±0.12 (0.002) | 0.86±0.03 (p<10−10) | 0.76±0.02 (0, p<10− 10) | 0.54±0.04 (p<10−10, p<10−10) | 0.69±0.03 (p<10−10) |
| SFO | 0.36±0.08 (1.16E-07) | 0.67±0.05 (p<10−10) | 0.29±0.23 (0.10) | 0.39±0.13 (0.02) | 0.73±0.05 (p<10−10) | 0.62±0.03 (0, p<10− 10) | 0.48±0.05 (p<10−10, p<10−10) | 0.64±0.03 (p<10−10) |
| SLF | 0.57±0.09 (p<10−10) | 0.78±0.03 (p<10−10) | 0.51±0.29 (0.05) | 0.41±0.13 (0.002) | 0.88±0.03 (p<10−10) | 0.82±0.02 (0,0) | 0.64±0.06 (p<10−10, p<10−10) | 0.77±0.02 (p<10−10) |
| SS | 0.44±0.08 (1.04E-09) | 0.74±0.04 (p<10−10) | 0.05±0.31 (0.50) | 0.25±0.14 (0.03) | 0.70±0.06 (p<10−10) | 0.66±0.03 (0, p<10− 10) | 0.48±0.06 (p<10−10, p<10−10) | 0.65±0.03 (p<10−10) |
| CST | 0.33±0.08 (1.72E-06) | 0.25±0.10 (0.008) | 0.29±0.39 (0.23) | 0.37±0.13 (0.004) | 0.61±0.06 (p<10−10) | 0.44±0.04 (0, p<10− 10) | 0.33±0.07 (p<10− 10,2.54E-06) | 0.42±0.04 (p<10−10) |
Figure 2.

Individual site heritability plot
The significance of voxelwise measurements of heritability varied substantially per cohort (Table 3). Following multiple comparisons correction across all voxels using FDR, we observed that the QTIM cohort had the highest fraction (79%) of significant voxels, while TAOS cohort had the lowest (1.6%) fraction (Table 4).
Table 4.
Voxelwise multiple comparisons correction using FDR was performed for each heritability map based on the resulting p-values. The percent of the skeleton that was significantly heritable, along with the FDR critical p-value and minimum p-value along the image are listed.
| % significantly heritable (FDR)* | FDR-critical p-value | minimum p-value | |
|---|---|---|---|
| GOBS | 59.09 | 0.0295 | p<10−10 |
| QTIM | 79.10 | 0.0395 | p<10−10 |
| TAOS | 1.61 | 0.0008 | 3.0x10⁻⁷ |
| BrainSCALE | 16.36 | 0.0082 | 2.1x10⁻¹⁰ |
| NTR | 40.22 | 0.0201 | p<10−10 |
total voxels in mask = 116524
Meta- and Mega-analysis
The results for the three approaches for pooling data and obtaining overall estimates of heritability are shown in Table 3 and Figure 3. The SE-weighted meta-analysis yielded the highest estimate (h2=0.71±0.06; p<10−10) for the average FA across the whole skeleton, while the N-weighted meta-analysis produced the lowest (h2=0.51±0.06; p<10−10) heritability estimate.. The mega-genetic approach produced an intermediate heritability estimate but with the lowest standard error and the highest significance (h2=0.67±0.04; p<10−10). The tract-wise heritability estimates for the SE-weighted meta- with mega-genetic analyses were highly correlated (r=0.76, p=0.002) (Table 5), however the correlations of the tract-wise estimates for the N-weighted approach with the SE-weighted approach and with the mega-analytical approach, were not significant (r=0.48, p=0.11; r=0.41, p=0.15).
Figure 3.

joint analyses heritability plot + forest plot
Table 5.
Result of the linear correlation analysis (r-coefficients) between tract-wise heritability measurements for three data pooling methods and five cohorts. The tract-wise heritability estimates of the N-weighted meta-analysis was highly correlated with the estimates from the TAOS sample (r=0.84, p=0.0006), while the results of the SE-weighted meta-analysis was strongly correlated with the NTR cohort (r=0.89, p=0.0001). The ROI results of the mega-analysis were more correlated with QTIM, NTR, and BrainSCALE (r=0.74, 0.54 and 0.50, respectively).
| GOBS | QTIM | TAOS | Brain- SCALE | NTR | Meta Analysis (SE) | Meta Analysis (N) | Mega Analysis | |
|---|---|---|---|---|---|---|---|---|
| GOBS | 0.11 | 0.23 | −0.21 | 0.24 | 0.36 | 0.49 | 0.24 | |
| QTIM | 0.11 | −0.44 | −0.01 | 0.11 | 0.50 | 0.00 | 0.73 | |
| TAOS | 0.23 | −0.44 | 0.20 | 0.13 | 0.00 | 0.84 | 0.11 | |
| BrainSCALE | −0.21 | −0.01 | 0.20 | 0.23 | 0.13 | 0.34 | 0.50 | |
| NTR | 0.24 | 0.11 | 0.13 | 0.23 | 0.89 | 0.46 | 0.54 | |
| Meta Analysis (SE) | 0.36 | 0.50 | 0.00 | 0.13 | 0.89 | 0.48 | 0.76 | |
| Meta Analysis (N) | 0.49 | 0.00 | 0.84 | 0.34 | 0.46 | 0.48 | 0.41 | |
| Mega Analysis | 0.24 | 0.73 | 0.11 | 0.50 | 0.54 | 0.76 | 0.41 |
The tract-wise heritability estimates of the N-weighted meta-analysis was highly correlated with the estimates from the TAOS sample (r=0.84, p=0.0006), while the results of the SE-weighted meta-analysis was strongly correlated with the NTR cohort (r=0.89, p=0.0001). The ROI results of the mega-analysis were more correlated with QTIM, NTR, and BrainSCALE (r=0.74, 0.54 and 0.50, respectively).
Voxelwise, all three data pooling analytic approaches produced a similar spatial pattern of heritability (Figure 4). The meta-analysis weighted by N (top) showed the lowest overall voxelwise heritability. The meta-analysis weighted by SE (middle) showed a more similar pattern to the mega- analysis (bottom), although the mega-analysis appeared to have a smoother spatial distribution of heritability. Notably, all three methods produced a significant number of voxel-wise estimates that would pass the most stringent, Bonferroni, correction for multiple testing (Table 6). Both methods of calculating p-values for meta-analysis produced a significant number of heritable voxels. The SE-MAs included many voxels whose p-values were exceedingly low (0). Despite this, the mega-analytic analysis was the only one to show a majority of voxels surviving Bonferroni correction.
Figure 4.

voxelwise maps of meta and mega slices
Table 6.
Multiple comparisons corrections for joint analyses using the most stringent Bonferroni correction. All three methods have produced a significant number of voxel-wise estimates that would pass the most stringent, Bonferroni, correction for multiple testing. Meta-analysis p-values were computed in two ways as described in the Methods section, and values for both corrections are listed below.
| % significantly heritable* | Bonferroni crtitical p-value* | minimum p-value | |
|---|---|---|---|
| Meta-SE | 34.87, 49.86 | 4.3*10−7 | p<10−10 |
| Meta-N | 10.15, 35.75 | 4.3*10−7 | p<10−10 |
| Mega | 53.1 | 4.3*10−7 | p<10−10 |
total voxels in mask = 116524
We note a high voxel-wise correlation of heritability values 0.87–0.90 between the different joint approaches (Figure 5). Meta-analyses show a correlation of 0.87. Additionally, when the mega-analysis is compared to the SE-weighted meta-analysis, a similar high correlation of 0.87 is obtained (Figure 5b). A slightly higher correlation is observed when comparing the mega-analysis to the meta-analysis weighted by N (Figure 5c).
Figure 5.
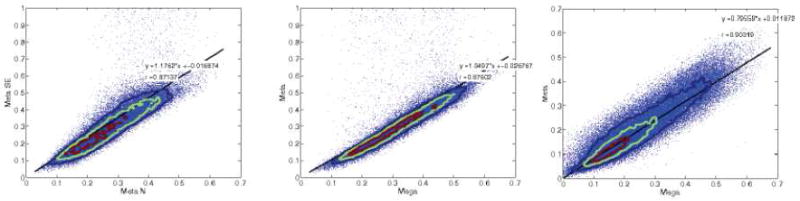
3 scatter correlation plots
Leave-one-cohort out analysis
Finally, the stability of the joint heritability estimates was ascertained in the regions of interest using a leave-one-out analysis. The aim was to study how the joint heritability estimate depended on the contribution from any one dataset. For the whole brain average FA values, removing one cohort resulted in different results for each type of joint analysis. On average, the SE-weighted meta-analysis approach produced the highest heritability estimate, yet with the widest range of results h2=0.69 (for average FA for example; range 0.51 to 0.74) while the N-weighted meta-analysis approach produced the lowest heritability estimate h2=0.52 with a narrower range of results (range 0.47 to 0.57). For both meta-analytic approaches, the highest h2 estimate was observed when leaving out the GOBS cohort and the lowest was observed following removal of the NTR cohort. However, for the SE-weighted meta-analysis, the removal of the NTR cohort led to a substantially different heritability estimate than removal of each of the others, while for the N-weighted meta-analysis, removal of NTR was similar to removing QTIM, and differences in estimations were more subtle. Mega-analysis produced an intermediate estimate h2=0.67 (cumulative h2 estimates ranging from 0.58 to 0.77). The highest h2 estimate was observed following removal of the BrainSCALE cohort and the lowest following removal of the QTIM cohort (Figure 6).
Figure 6.

leave one out for average FA values all joint analyses
The tract-wise, leave-one-cohort-out analysis produced mainly stable results consistent with the full group analysis, with one notable exception. The N-weighted and mega-analyses produced consistent estimates that followed the trend of the full group analysis (r=0.91–0.99) (Figure 7). The SE-weighted meta-analysis however, appeared to be most influenced by exclusion of the NTR dataset, which had the highest individual heritability and lowest SE. Removal of that dataset led to substantially lower heritability estimates across the ROIs and lowered the correlation with the results from the complete dataset (r=0.79). Another notable observation is that the mega-analytic approach (Figure 7) produced generally higher heritability estimates with a narrower error margin compared to both the meta analytical methods. Genetic analyses for other regions of the Johns Hopkins DTI atlas are provided in supplement (see Supplement).
Figure 7.


3 plots -- leave one out for all ROIS all joint analyses
IV. DISCUSSION
We evaluated three data-pooling strategies for performing a multi-site analysis of additive genetic contributions to variability in the fractional anisotropy (FA) of cerebral white matter (WM). The ENIGMA-DTI data harmonization protocol, presented in our prior work (Jahanshad et al., 2013b) served as the foundation for this analysis. This protocol was used to assemble and homogenize data collected at five sites, using diverse imaging protocols and cohorts that varied in age (9–85 years) and the family structure (twins, twins and siblings, and extended family). Our efforts aim to identify FA measurements that are significantly heritable regardless of age, ethnicity, family structure, and methodological variations. To summarize our findings, we observed that (as expected) the heritability estimates do vary across cohorts. Datasets with smaller numbers of subjects, or less familial relationships, were more likely to produce heritability estimates not representative of the pooled trend. Nonetheless, including these datasets improves the overall outcome of the joint analysis. We also observe that three analytical approaches for data pooling vary in the both the estimates and the significance of pooled heritability and these estimates may be sensitive to inclusion/exclusion of specific datasets. Overall, our study concluded that despite methodological differences, combining genetically informative datasets using meta-and/or-mega-genetic approaches led to a significant improvement of the statistical significance. Overall, the pooled heritability estimates across the brain showed high heritability, with additive genetic factors explaining over 50% of intersubject variance in FA values across most regions.
This manuscript extends and validates the ENIGMA-DTI harmonization protocol (Jahanshad et al., 2013b) to a wider range of cohorts. This protocol ensures that imaging data from multiple sites can be harmonized for a pooled analysis by transforming them in the common space (a custom spatial normalization template derived from four diverse high-resolution datasets) and extracting regional measures; it includes the processing steps necessary to prepare DTI data for quantitative genetic analysis, including extraction of tract-wise average and voxel-wise FA data, as well as data quality control and assurance procedures. Ideally, harmonization of data collection should occur at the onset of the multicenter imaging study as demonstrated by the efforts of the Alzheimer’s Disease Neuroimaging Initiative (Weiner et al., 2012) and others (Teipel et al., 2011; Zhan et al., 2012). Clearly, this is only applicable to data that has yet to be collected. The ENIGMA-DTI harmonization effort was developed as a post hoc solution to help prepare existing data for pooled genetic analyses to facilitate the search for genetic associations with DTI-extracted traits. This manuscript evaluated the ENIGMA-DTI protocol by testing its ability to reproduce and replicate findings of significant additive genetic contribution to FA values in data collected at five sites.
The contribution of additive genetic variation (i.e., heritability) to individual variability was calculated for the whole brain skeleton and regional FA values in five cohorts. The five cohorts were diverse in both the age of participants (9–85 years) and family structure (twin, twins + siblings, extended families). Heritability is a property of a population sample and may vary from sample to sample. It should not serve as the single parameter to estimate and compare across various populations. However, for certain planned collaborative efforts to search the genome and discover individual variants contributing to basic white matter properties, it is desirable to establish patterns of heritability that are common regardless of the population under study. Despite differences in age, structure and ethnicity among our cohorts, there was no significant difference in the average heritability estimates. While this does not signify that the same genes contribute to the level of heritability in the different populations, we can be confident that each of the regions has the potential to serve as a promising endophenotype to discover genes that exert controls over white matter structure in general. Our experiments demonstrate that heritability estimates from smaller cohorts with non-twin sibling family structures (TAOS) may be underpowered, particularly for smaller regions, and possibly not be representative of the group at large compared to those of extended pedigrees or primarily twin based cohorts. Despite these variations, we show joint analytic procedures have limited sensitivity to such differences and can still benefit from the addition of individually underpowered cohorts.
The cohorts that yielded the highest and the lowest heritability estimates for the full skeleton (NTR and BrainSCALE, respectively) were twin samples recruited from the same twin register in The Netherlands. Moreover, the two populations were imaged using similar DTI-protocols implemented on Philips MRI scanners. The low heritability estimate in the BrainSCALE cohort may be due to a combination of factors. Its original study suggested that the low heritability estimate might have been due to the young age of the sample (average age=9.2±0.1 years) (Brouwer et al., 2010). It hypothesized that the on-going cerebral myelination may lead to higher intersubject variance, thereby reducing heritability estimates. Unsurprisingly, the subject’s age was not a significant covariate in this cohort (p>0.5) and this may be responsible for the inflation of the overall variance in FA values (Brouwer et al., 2010). While potentially masked by differences is pedigree structure, the trends in heritability across cohorts do not appear to be due to the young age in the cohort. The next youngest cohort, TAOS, was also collected in adolescent subjects with a narrow age window (average age=13.4 yr ± 0.96) where the subject’s age was also a non-significant covariate (p=0.41). However, the heritability estimates from this cohort were nearly twice that observed in the BrainSCALE sample (h2=0.49 vs. 0.27). The heritability estimates in the TAOS cohort had a low significance. This is because it was composed of siblings and therefore had a lower statistical power compared to twin cohorts. Clearly, this topic of age-by-heritability change during cerebral development deserves further study. These said, in this study, the variation in heritability estimates for cohorts with small subject number is likely to be caused by subject selection rather than methodological issues and/or biases.
The three data pooling methods succeeded in producing similar estimates of heritability using data from all five cohorts. However, there were a few notable differences. The two-meta-analytical approaches produced the lowest and the highest heritability estimates for the average FA values (h2=0.51, p<10−10 and 0.71, p <10−10 for N- and SE-weighted approaches, respectively), while mega-genetic analysis produced intermediate heritability estimates with the highest significance (h2=0.67, p=<10−10). A similar pattern was observed for the tract-wise and voxel-wise measurements: over 50% of the voxel-wise estimates obtained by the mega-genetic approach satisfied even the strictest Bonferroni threshold for multiple comparisons. Importantly, the voxel-wise correlation of heritability estimates showed high levels of shared regional variance (r=0.87–0.90), suggesting a high concordance among the three data-pooling approaches. Importantly, aggregated heritability estimates presented here showed a high level of concordance with previous estimates calculated in the GOBS and only the twin pairs from the QTIM cohorts (N=1151)(Jahanshad et al., 2013b). For instance, the average FA heritability estimate by the mega-genetic approach was nearly identical to a mega-genetic estimate obtained in the prior study h2=0.67, p=7.6·10−49 vs. h2=0.68, p=1.9·10−11, for present and past mega-genetic estimates. While the present meta-genetic heritability estimates here were higher than these obtained in the previous sample (h2=0.51 and 0.71 vs. 0.42 and 0.43 for the N- and SE-weighted estimates for present and previous studies) (Jahanshad et al., 2013b), the by-tract correlations of current (N=2203) vs past (N=1151) analysis showed high consistency (r=0.70–.86; p≤0.01) for all three data pooling methods (Table 7).
Table 7.
Correlation between our past (Jahanshad et al., 2013b) and present by-tract heritability estimates.
| Past Estimates | Present N-Weighted | Present SE-Weighted | Present Mega |
|---|---|---|---|
| N-Weighted | 0.77 | 0.86 | 0.80 |
| SE-Weighted | 0.69 | 0.86 | 0.86 |
| Mega | 0.70 | 0.84 | 0.86 |
Meta-analysis methods approximate global effect-size by computing a weighted estimate of the effect-sizes from individual studies. The weighs, or scaling factors, for effect sizes are assigned based on the precision of the effect size estimates per study. Studies with more precise estimate of the effect size may therefore be given higher weights. In general, the precision of the effect-size is directly related to the study’s sample size (N). The sample size, or N-weighted, meta-analysis is, therefore, a commonly used approach. On the other hand, the design of genetic studies also plays an important role in affecting the precision of the estimate (Borenstein et al., 2009). Particularly in the case of variance-component derived heritability estimates, different family based study designs may have different correlation structures such that the sample size may not directly reflect the estimate precision. For instance, matched twin studies provide more precise estimates of heritability than populations with the same number of more distantly related relatives. On the other hand, the latter type provides a better estimate of covariate effects and thereby may provide more precise estimates of genetic effects (Blangero et al., 2013).
The N-weighted meta-analytic approach used in this study was developed for meta-analysis of twin data (Li et al., 2003; Rhee and Waldman, 2002; Verweij et al., 2010). Here it was used for a meta-analysis of both twin and family population. This may be a limitation as scaling of statistical power per subject may be different for family-based versus twin-based studies. However, we believe that in our case it is a minor limitation. To test this, we used power calculation methods implemented in SOLAR-Eclipse (Blangero et al., 2013) to model the statistical power for detecting heritability in each of the five samples. We observed that for the range of expected heritability estimates (h2=0.3–0.7), the statistical power per cohort was directly proportional to the sample size (r=~0.9), supporting the basic assumption of N-weighted meta-analysis. Further, we compared the estimates from N-weighted approach to these derived using the standard-error weighted meta and mega-genetic analyses. The estimates derived from the N-weighted meta-analysis overlapped with the confidence intervals of the other approaches, suggesting that it homed in on appropriate heritability estimates. Furthermore, a single weighting scheme of a meta-analysis may not be available for every condition and it is also possible that the difference weighting may have minimal effects (Brannick et al., 2011). Nonetheless, this limitation signifies the urgent need for development of more universal meta-genetic analytical approaches for an effective sample-size estimate based on within and between family variance. For instance, simulation modeling of statistical power based on the study designs (Blangero et al., 2013) may become a promising novel approach to derive the scaling factors.
The leave-one-out analysis was performed to test the stability of the pooled heritability estimates on inclusion and exclusion of specific cohorts. The average FA heritability estimates following the removal of each of the five cohorts were similar to the overall pooled heritability estimate for the both the N-weighted meta- and mega-genetic analyses (h2=0.51 and 0.67, respectively). The N-weighted meta-analysis showed the smallest variability in heritability estimates because the cohorts with the highest and lowest heritability estimates (NTR and BrainSCALE) had the two smallest numbers of subjects and this limited their contribution to this pooled heritability estimate. Nonetheless, the N-weighted meta-analysis was shown to be most sensitive to removal of the GOBS cohort (Figure 7A). Removal of this cohort led to a change in the heritability estimate from h2=0.51 to 0.57. This was expected since the GOBS cohort had the largest number of subjects and thereby exerted the highest weight in the N-weighted combined heritability estimate. On the other hand, the SE-weighted approach was sensitive to removal of the NTR cohort. The removal of this cohort reduced the pooled MA-SE heritability estimate from h2=0.71 to 0.51. This led to the highest standard deviation in pooled heritability estimates among the three methods (std dev = 0.10, 0.07 and 0.05 for SE-weighted, mega and N-weighted approaches, respectively). This was also expected, as the NTR cohort had the highest heritability estimates with the lowest standard error. The highest change in mega-genetic analysis h2=0.67 to 0.78 (for average FA) was observed following the exclusion of the BrainSCALE cohort due to its lowest heritability estimates and its twin-design that produced population structure with high statistical power. While overall, the pooled estimates are exceedingly similar across regions of interest and voxelwise FA measurements, when data-sharing is not a viable option for mega-analysis, careful consideration of cohort structure and inherent power should be taken into account for meta-analytic approaches.
Overall, we observed that regional heritability estimates varied among individual cohorts and to a lesser degree between the joint analyses methods. As the heritability of a phenotype is dependent on the study population, we would not expect to see the same heritability estimates across geographically and ethnically diverse cohorts. Pooling diverse datasets and populations through joint analytical approach of variance-components analysis provides global means of heritability across a variety of populations. As no standards exist for jointly analyzing such data, we provided results from three different types of analyses and observe the variability between these joint estimators. In addition, we used leave-one out analyses to evaluate stability of each method and its sensitivity to individual cohorts. These stability tests suggest that adequately powered independent studies will likely produce heritability estimates that will fall within the range derived from the set of joint analyses. However, given that only 5 cohorts were used in this study and 4 out of 5 were of children or young adults, and common environmental effects were not assessed, it is also possible that heritability estimates of an independent cohort will be significantly different. The ENIGMA-DTI protocols available online (http://enigma.ini.usc.edu/ongoing/dti-working-group/), and the joint analytical methods described here, may now be used by others to expand upon the joint heritability analyses. Ideally, with enough cohorts, joint estimation of heritability will be analyzed using random-effects modeling (Normand 1999) to further account for underlying differences and similarities between cohorts.
CONCLUSION
Here we test the reliability of the FA endophenotypes measured from DTI data and extensively evaluated three data pooling approaches to study the additive genetic contribution to variability in FA. This step of optimizing methods and protocols brings us closer to fulfilling the overall aim of the ENIGMA Consortium -- using imaging phenotypes studies to help discover genes that associate with brain structure and may in turn be associated with, behavior, cognition, and neuropsychiatric disorders. We used five datasets of various ages, ethnicities and family structure to demonstrate that data pooling approaches provide robust estimates of FA heritability in almost all white matter regions, suggesting that despite differences in acquisition and cohort structure, data pooling is feasible. We showed that both global and regional heritability estimates from pooled approaches were much more similar than heritability estimates derived from individual cohorts were to each other. We determined stability in the pooling approaches by showing the differences in pooled estimates, using subsets of the data. While we generally showed that mega-analytic approaches have greater stability and highest power for jointly analyzing data, we note that meta-analytic approaches are comparable when full individual-level data sharing is not feasible, although caution and careful evaluation of cohort trends should be taken when making the choice of a meta-analytic approach. We provide our joint heritability results online at http://enigma.ini.usc.edu/ongoing/dti-working-group/ to serve as a voxelwise heritability atlas for future studies.
Supplementary Material
Highlights.
Data pooling using analytical approaches leads to improved power of genetic analyses
In the largest DTI study to date we evaluated three meta analytical methods
Data from 2248 subjects were normalized using ENIGMA-DTI protocol
Heritability estimates varied substantially for five cohort that contributed subjects
Meta-analyses boosted power and improved stability of heritability estimates
Acknowledgments
This study was supported by R01 EB015611 to PK, R01 HD050735 to PT, MH0708143 and MH083824 grants to DCG and by MH078111 and MH59490 to JB. Additional support for algorithm development was provided by NIH R01 grants EB008432, EB008281, and EB007813 (to PT). JES is supported by a Clinical Research Training Fellowship from the Wellcome Trust (087727/Z/08/Z). AMM is supported by a NARSAD Independent Investigator Award and by a Scottish Funding Council Senior Clinical Fellowship.
The GOBS study (PI DG and JB) was supported by the National Institute of Mental Health Grants MH0708143 (Principal Investigator [PI]: DCG), MH078111 (PI: JB), and MH083824 (PI: DCG & JB).
The QTIM study was supported by National Health and Medical Research Council (NHMRC 486682), Australia. GdZ is supported by an ARC Future Fellowship (FT0991634).
The TAOS study (PI DEW) was supported by the National Institute on Alcohol Abuse and Alcoholism (R01AA016274) - “Affective and Neurobiological Predictors of Adolescent-Onset AUD” and the Dielmann Family.
The NTR study (PI DvtE) was supported by the The Netherlands Organisation for Scientific Research (NWO) [Medical Sciences (MW): grant no. 904-61-193; Social Sciences (MaGW): grant no. 400-07-080; Social Sciences (MaGW): grant no. 480-04-004].
The BrainSCALE study (PI HH and DB) was supported by grants from the Dutch Organization for Scientific Research (NWO) to HEH (051.02.061) and HEH, DIB and RSK (051.02.060).
Data collection for the Bipolar Family Study was supported by an Academy of Medical Sciences/Health Foundation Clinician Scientist Fellowship to AMM.
Footnotes
The Verweij et al (2010) study specifically focused on twin studies. Weighting a mix of family studies by sample size should be approached with caution as sample sizes in different family based studies do not reflect the same power. A certain sample size in a twin study may be more powerful in picking up heritability effects than that same sample size in a large extended pedigree due to lower degrees of shared genetic information between more distant relatives. Please see discussion for a more detailed explanation.
Publisher's Disclaimer: This is a PDF file of an unedited manuscript that has been accepted for publication. As a service to our customers we are providing this early version of the manuscript. The manuscript will undergo copyediting, typesetting, and review of the resulting proof before it is published in its final citable form. Please note that during the production process errors may be discovered which could affect the content, and all legal disclaimers that apply to the journal pertain.
References
- Agartz I, Okuguwa G, Nordstrom M, Greitz D, Magnotta V, Sedvall G. Reliability and reproducibility of brain tissue volumetry from segmented MR scans. Eur Arch Psychiatry Clin Neurosci. 2001;251:255–261. doi: 10.1007/pl00007542. [DOI] [PubMed] [Google Scholar]
- Alba-Ferrara LM, de Erausquin GA. What does anisotropy measure? Insights from increased and decreased anisotropy in selective fiber tracts in schizophrenia. Front Integr Neurosci. 2013;7:9. doi: 10.3389/fnint.2013.00009. [DOI] [PMC free article] [PubMed] [Google Scholar]
- Almasy L, Blangero J. Multipoint quantitative-trait linkage analysis in general pedigrees. Am J Hum Genet. 1998;62:1198–1211. doi: 10.1086/301844. [DOI] [PMC free article] [PubMed] [Google Scholar]
- Amos CI. Robust variance-components approach for assessing genetic linkage in pedigrees. Am J Hum Genet. 1994;54:535–543. [PMC free article] [PubMed] [Google Scholar]
- Barysheva M, Jahanshad N, Foland-Ross L, Altshuler LL, Thompson PM. White matter microstructural abnormalities in bipolar disorder: A whole brain diffusion tensor imaging study. 2012. [DOI] [PMC free article] [PubMed] [Google Scholar]
- Basser PJ, Mattiello J, LeBihan D. MR diffusion tensor spectroscopy and imaging. Biophysical Journal. 1994;66:259–267. doi: 10.1016/S0006-3495(94)80775-1. [DOI] [PMC free article] [PubMed] [Google Scholar]
- Basser PJ, Pierpaoli C. Microstructural and physiological features of tissues elucidated by quantitative-diffusion-tensor MRI. J Magn Reson B. 1996;111:209–219. doi: 10.1006/jmrb.1996.0086. [DOI] [PubMed] [Google Scholar]
- Benjamini Y, Hochberg Y. Controlling the False Discovery Rate - a Practical and Powerful Approach to Multiple Testing. Journal of the Royal Statistical Society Series B-Methodological. 1995;57:289–300. [Google Scholar]
- Bergen SE, Gardner CO, Kendler KS. Age-related changes in heritability of behavioral phenotypes over adolescence and young adulthood: a meta-analysis. Twin Res Hum Genet. 2007;10:423–433. doi: 10.1375/twin.10.3.423. [DOI] [PubMed] [Google Scholar]
- Bis JC, Decarli C, Smith AV, van der Lijn F, Crivello F, Fornage M, Debette S, Shulman JM, Schmidt H, Srikanth V, Schuur M, Yu L, Choi SH, Sigurdsson S, Verhaaren BF, Destefano AL, Lambert JC, Jack CR, Jr, Struchalin M, Stankovich J, Ibrahim-Verbaas CA, Fleischman D, Zijdenbos A, den Heijer T, Mazoyer B, Coker LH, Enzinger C, Danoy P, Amin N, Arfanakis K, van Buchem MA, de Bruijn RF, Beiser A, Dufouil C, Huang J, Cavalieri M, Thomson R, Niessen WJ, Chibnik LB, Gislason GK, Hofman A, Pikula A, Amouyel P, Freeman KB, Phan TG, Oostra BA, Stein JL, Medland SE, Vasquez AA, Hibar DP, Wright MJ, Franke B, Martin NG, Thompson PM, Nalls MA, Uitterlinden AG, Au R, Elbaz A, Beare RJ, van Swieten JC, Lopez OL, Harris TB, Chouraki V, Breteler MM, De Jager PL, Becker JT, Vernooij MW, Knopman D, Fazekas F, Wolf PA, van der Lugt A, Gudnason V, Longstreth WT, Jr, Brown MA, Bennett DA, van Duijn CM, Mosley TH, Schmidt R, Tzourio C, Launer LJ, Ikram MA, Seshadri S. Common variants at 12q14 and 12q24 are associated with hippocampal volume. Nat Genet. 2012;44:545–551. doi: 10.1038/ng.2237. [DOI] [PMC free article] [PubMed] [Google Scholar]
- Blangero J, Diego VP, Dyer TD, Almeida M, Peralta J, Kent JW, Williams JT, Almasy L, Goring HHH. A Kernel of Truth: Statistical Advances in Polygenic Variance Component Models for Complex Human Pedigrees. Advances in Genetics. 2013;81:1–31. doi: 10.1016/B978-0-12-407677-8.00001-4. [DOI] [PMC free article] [PubMed] [Google Scholar]
- Blangero J, Goring HH, Kent JW, Jr, Williams JT, Peterson CP, Almasy L, Dyer TD. Quantitative trait nucleotide analysis using Bayesian model selection. Hum Biol. 2005;77:541–559. doi: 10.1353/hub.2006.0003. [DOI] [PubMed] [Google Scholar]
- Borenstein M, Hedges LV, Higgins JPT, Rothstein HR. Introduction to meta-analysis. John Wiley & Sons; Chichester, U.K: 2009. [Google Scholar]
- Brannick MT, Yang LQ, Cafri G. Comparison of Weights for Meta-Analysis of r and d Under Realistic Conditions. Organizational Research Methods. 2011;14:587–607. [Google Scholar]
- Braskie MN, Ringman JM, Thompson PM. Neuroimaging measures as endophenotypes in Alzheimer’s disease. Int J Alzheimers Dis. 2011;2011:490140. doi: 10.4061/2011/490140. [DOI] [PMC free article] [PubMed] [Google Scholar]
- Brouwer RM, Mandl RC, Peper JS, van Baal GC, Kahn RS, Boomsma DI, Hulshoff Pol HE. Heritability of DTI and MTR in nine-year-old children. Neuroimage. 2010;53:1085–1092. doi: 10.1016/j.neuroimage.2010.03.017. [DOI] [PubMed] [Google Scholar]
- Brouwer RM, Mandl RC, Schnack HG, van Soelen IL, van Baal GC, Peper JS, Kahn RS, Boomsma DI, Hulshoff Pol HE. White matter development in early puberty: a longitudinal volumetric and diffusion tensor imaging twin study. PLoS One. 2012;7:e32316. doi: 10.1371/journal.pone.0032316. [DOI] [PMC free article] [PubMed] [Google Scholar]
- Carballedo A, Amico F, Ugwu I, Fagan AJ, Fahey C, Morris D, Meaney JF, Leemans A, Frodl T. Reduced fractional anisotropy in the uncinate fasciculus in patients with major depression carrying the met-allele of the Val66Met brain-derived neurotrophic factor genotype. Am J Med Genet B Neuropsychiatr Genet. 2012;159B:537–548. doi: 10.1002/ajmg.b.32060. [DOI] [PubMed] [Google Scholar]
- Chen CH, Gutierrez ED, Thompson W, Panizzon MS, Jernigan TL, Eyler LT, Fennema-Notestine C, Jak AJ, Neale MC, Franz CE, Lyons MJ, Grant MD, Fischl B, Seidman LJ, Tsuang MT, Kremen WS, Dale AM. Hierarchical genetic organization of human cortical surface area. Science. 2012;335:1634–1636. doi: 10.1126/science.1215330. [DOI] [PMC free article] [PubMed] [Google Scholar]
- Clerx L, Visser PJ, Verhey F, Aalten P. New MRI markers for Alzheimer’s disease: a meta-analysis of diffusion tensor imaging and a comparison with medial temporal lobe measurements. J Alzheimers Dis. 2012;29:405–429. doi: 10.3233/JAD-2011-110797. [DOI] [PubMed] [Google Scholar]
- de Zubicaray GI, Chiang MC, McMahon KL, Shattuck DW, Toga AW, Martin NG, Wright MJ, Thompson PM. Meeting the Challenges of Neuroimaging Genetics. Brain Imaging Behav. 2008;2:258–263. doi: 10.1007/s11682-008-9029-0. [DOI] [PMC free article] [PubMed] [Google Scholar]
- den Braber A, de Geus EJ, Boomsma DI, van’t Ent D. Obsessive-compulsive symptoms and related sex differences in brain structure: an MRI study in Dutch twins. Twin Res Hum Genet. 2013;16:516–524. doi: 10.1017/thg.2013.10. [DOI] [PubMed] [Google Scholar]
- den Braber A, Ent D, Blokland GA, van Grootheest DS, Cath DC, Veltman DJ, de Ruiter MB, Boomsma DI. An fMRI study in monozygotic twins discordant for obsessive-compulsive symptoms. Biol Psychol. 2008;79:91–102. doi: 10.1016/j.biopsycho.2008.01.010. [DOI] [PubMed] [Google Scholar]
- den Braber A, van’t Ent D, Boomsma DI, Cath DC, Veltman DJ, Thompson PM, de Geus EJ. White matter differences in monozygotic twins discordant or concordant for obsessive-compulsive symptoms: a combined diffusion tensor imaging/voxel-based morphometry study. Biol Psychiatry. 2011;70:969–977. doi: 10.1016/j.biopsych.2011.03.029. [DOI] [PubMed] [Google Scholar]
- den Braber A, van’t Ent D, Cath DC, Veltman DJ, Boomsma DI, de Geus EJ. Brain activation during response interference in twins discordant or concordant for obsessive compulsive symptoms. Twin Res Hum Genet. 2012;15:372–383. doi: 10.1017/thg.2012.2. [DOI] [PubMed] [Google Scholar]
- Dinov I, Lozev K, Petrosyan P, Liu Z, Eggert P, Pierce J, Zamanyan A, Chakrapani S, Van Horn J, Parker DS, Magsipoc R, Leung K, Gutman B, Woods R, Toga A. Neuroimaging study designs, computational analyses and data provenance using the LONI pipeline. PLoS One. 2010:5. doi: 10.1371/journal.pone.0013070. [DOI] [PMC free article] [PubMed] [Google Scholar]
- Friedman JI, Tang C, Carpenter D, Buchsbaum M, Schmeidler J, Flanagan L, Golembo S, Kanellopoulou I, Ng J, Hof PR, Harvey PD, Tsopelas ND, Stewart D, Davis KL. Diffusion tensor imaging findings in first-episode and chronic schizophrenia patients. Am J Psychiatry. 2008;165:1024–1032. doi: 10.1176/appi.ajp.2008.07101640. [DOI] [PubMed] [Google Scholar]
- Genovese CR, Lazar NA, Nichols T. Thresholding of statistical maps in functional neuroimaging using the false discovery rate. Neuroimage. 2002;15:870–878. doi: 10.1006/nimg.2001.1037. [DOI] [PubMed] [Google Scholar]
- Glahn DC, Thompson PM, Blangero J. Neuroimaging endophenotypes: strategies for finding genes influencing brain structure and function. Hum Brain Mapp. 2007;28:488–501. doi: 10.1002/hbm.20401. [DOI] [PMC free article] [PubMed] [Google Scholar]
- Glahn DC, Winkler AM, Kochunov P, Almasy L, Duggirala R, Carless MA, Curran JC, Olvera RL, Laird AR, Smith SM, Beckmann CF, Fox PT, Blangero J. Genetic control over the resting brain. Proc Natl Acad Sci U S A. 2010;107:1223–1228. doi: 10.1073/pnas.0909969107. [DOI] [PMC free article] [PubMed] [Google Scholar]
- Hasler G, Northoff G. Discovering imaging endophenotypes for major depression. Mol Psychiatry. 2011;16:604–619. doi: 10.1038/mp.2011.23. [DOI] [PubMed] [Google Scholar]
- Ikram MA, Fornage M, Smith AV, Seshadri S, Schmidt R, Debette S, Vrooman HA, Sigurdsson S, Ropele S, Taal HR, Mook-Kanamori DO, Coker LH, Longstreth WT, Jr, Niessen WJ, DeStefano AL, Beiser A, Zijdenbos AP, Struchalin M, Jack CR, Jr, Rivadeneira F, Uitterlinden AG, Knopman DS, Hartikainen AL, Pennell CE, Thiering E, Steegers EA, Hakonarson H, Heinrich J, Palmer LJ, Jarvelin MR, McCarthy MI, Grant SF, St Pourcain B, Timpson NJ, Smith GD, Sovio U, Nalls MA, Au R, Hofman A, Gudnason H, van der Lugt A, Harris TB, Meeks WM, Vernooij MW, van Buchem MA, Catellier D, Jaddoe VW, Gudnason V, Windham BG, Wolf PA, van Duijn CM, Mosley TH, Jr, Schmidt H, Launer LJ, Breteler MM, DeCarli C. Common variants at 6q22 and 17q21 are associated with intracranial volume. Nat Genet. 2012;44:539–544. doi: 10.1038/ng.2245. [DOI] [PMC free article] [PubMed] [Google Scholar]
- Jahanshad N, Kochunov PV, Sprooten E, Mandl RC, Nichols TE, Almasy L, Blangero J, Brouwer RM, Curran JE, de Zubicaray GI, Duggirala R, Fox PT, Hong LE, Landman BA, Martin NG, McMahon KL, Medland SE, Mitchell BD, Olvera RL, Peterson CP, Starr JM, Sussmann JE, Toga AW, Wardlaw JM, Wright MJ, Hulshoff Pol HE, Bastin ME, McIntosh AM, Deary IJ, Thompson PM, Glahn DC. Multi-site genetic analysis of diffusion images and voxelwise heritability analysis: A pilot project of the ENIGMA-DTI working group. Neuroimage. 2013b;81:455–469. doi: 10.1016/j.neuroimage.2013.04.061. [DOI] [PMC free article] [PubMed] [Google Scholar]
- Kochunov P, Duff Davis M. Development of structural MR brain imaging protocols to study genetics and maturation. Methods. 2009;50:136–146. doi: 10.1016/j.ymeth.2009.08.002. [DOI] [PMC free article] [PubMed] [Google Scholar]
- Kochunov P, Glahn D, Fox PT, Lancaster J, Saleem K, Shelledy W, Zilles K, Thompson P, Coulon O, Blangero J, Fox P, JR Genetics of primary cerebral gyrification: Heritability of length, depth and area of primary sulci in an extended pedigree of Papio baboons. Neuroimage. 2009;15:1126–1132. doi: 10.1016/j.neuroimage.2009.12.045. [DOI] [PMC free article] [PubMed] [Google Scholar]
- Kochunov P, Glahn D, Lancaster J, Wincker P, Smith S, Thompson P, Almasy L, Duggirala R, Fox P, Blangero J. Genetics of microstructure of cerebral white matter using diffusion tensor imaging. Neuroimage. 2010;15:1109–1116. doi: 10.1016/j.neuroimage.2010.01.078. [DOI] [PMC free article] [PubMed] [Google Scholar]
- Kochunov P, Glahn DC, LMR, Olvera R, Wincker P, Yang D, Sampath H, Carpenter W, Duggirala R, Curran J, Blangero J, Hong LE. Testing the hypothesis of accelerated cerebral white matter aging in schizophrenia and major depression. Biol Psychiatry. 2012a doi: 10.1016/j.biopsych.2012.10.002. [DOI] [PMC free article] [PubMed] [Google Scholar]
- Kochunov P, Rogers W, Mangin JF, Lancaster J. A library of cortical morphology analysis tools to study development, aging and genetics of cerebral cortex. Neuroinformatics. 2012b;10:81–96. doi: 10.1007/s12021-011-9127-9. [DOI] [PMC free article] [PubMed] [Google Scholar]
- Lemieux L, Hagemann G, Krakow K, Woermann FG. Fast, accurate, and reproducible automatic segmentation of the brain in T1-weighted volume MRI data. Magn Reson Med. 1999;42:127–135. doi: 10.1002/(sici)1522-2594(199907)42:1<127::aid-mrm17>3.0.co;2-o. [DOI] [PubMed] [Google Scholar]
- Lerch JP, Evans AC. Cortical thickness analysis examined through power analysis and a population simulation. Neuroimage. 2005;24:163–173. doi: 10.1016/j.neuroimage.2004.07.045. [DOI] [PubMed] [Google Scholar]
- Li MD, Cheng R, Ma JZ, Swan GE. A meta-analysis of estimated genetic and environmental effects on smoking behavior in male and female adult twins. Addiction. 2003;98:23–31. doi: 10.1046/j.1360-0443.2003.00295.x. [DOI] [PubMed] [Google Scholar]
- Mandl RC, Rais M, van Baal GC, van Haren NE, Cahn W, Kahn RS, Hulshoff Pol HE. Altered white matter connectivity in never-medicated patients with schizophrenia. Hum Brain Mapp. 2012 doi: 10.1002/hbm.22075. [DOI] [PMC free article] [PubMed] [Google Scholar]
- Nazeri A, Mallar Chakravarty M, Felsky D, Lobaugh NJ, Rajji TK, Mulsant BH, Voineskos AN. Alterations of Superficial White Matter in Schizophrenia and Relationship to Cognitive Performance. Neuropsychopharmacology. 2012 doi: 10.1038/npp.2013.93. [DOI] [PMC free article] [PubMed] [Google Scholar]
- Olvera RL, Bearden CE, Velligan DI, Almasy L, Carless MA, Curran JE, Williamson DE, Duggirala R, Blangero J, Glahn DC. Common genetic influences on depression, alcohol, and substance use disorders in Mexican-American families. American journal of medical genetics. Part B, Neuropsychiatric genetics : the official publication of the International Society of Psychiatric Genetics. 2011;156B:561–568. doi: 10.1002/ajmg.b.31196. [DOI] [PMC free article] [PubMed] [Google Scholar]
- Penke L, Munoz Maniega S, Houlihan LM, Murray C, Gow AJ, Clayden JD, Bastin ME, Wardlaw JM, Deary IJ. White matter integrity in the splenium of the corpus callosum is related to successful cognitive aging and partly mediates the protective effect of an ancestral polymorphism in ADRB2. Behav Genet. 2010a;40:146–156. doi: 10.1007/s10519-009-9318-4. [DOI] [PubMed] [Google Scholar]
- Penke L, Munoz Maniega S, Murray C, Gow AJ, Hernandez MC, Clayden JD, Starr JM, Wardlaw JM, Bastin ME, Deary IJ. A general factor of brain white matter integrity predicts information processing speed in healthy older people. J Neurosci. 2010b;30:7569–7574. doi: 10.1523/JNEUROSCI.1553-10.2010. [DOI] [PMC free article] [PubMed] [Google Scholar]
- Perez-Iglesias R, Tordesillas-Gutierrez D, McGuire PK, Barker GJ, Roiz-Santianez R, Mata I, de Lucas EM, Rodriguez-Sanchez JM, Ayesa-Arriola R, Vazquez-Barquero JL, Crespo-Facorro B. White matter integrity and cognitive impairment in first-episode psychosis. Am J Psychiatry. 2011;167:451–458. doi: 10.1176/appi.ajp.2009.09050716. [DOI] [PubMed] [Google Scholar]
- Rhee SH, Waldman ID. Genetic and environmental influences on antisocial behavior: a meta-analysis of twin and adoption studies. Psychol Bull. 2002;128:490–529. [PubMed] [Google Scholar]
- Smith SM, Jenkinson M, Johansen-Berg H, Rueckert D, Nichols TE, Mackay CE, Watkins KE, Ciccarelli O, Cader MZ, Matthews PM, Behrens TE. Tract-based spatial statistics: voxelwise analysis of multi-subject diffusion data. Neuroimage. 2006;31:1487–1505. doi: 10.1016/j.neuroimage.2006.02.024. [DOI] [PubMed] [Google Scholar]
- Smith SM, Johansen-Berg H, Jenkinson M, Rueckert D, Nichols TE, Miller KL, Robson MD, Jones DK, Klein JC, Bartsch AJ, Behrens TE. Acquisition and voxelwise analysis of multi-subject diffusion data with tract-based spatial statistics. Nat Protoc. 2007;2:499–503. doi: 10.1038/nprot.2007.45. [DOI] [PubMed] [Google Scholar]
- Sprooten E, Sussmann JE, Clugston A, Peel A, McKirdy J, Moorhead TW, Anderson S, Shand AJ, Giles S, Bastin ME, Hall J, Johnstone EC, Lawrie SM, McIntosh AM. White matter integrity in individuals at high genetic risk of bipolar disorder. Biol Psychiatry. 2011;70:350–356. doi: 10.1016/j.biopsych.2011.01.021. [DOI] [PubMed] [Google Scholar]
- Stein JL, Medland SE, Vasquez AA, Hibar DP, Senstad RE, Winkler AM, Toro R, Appel K, Bartecek R, Bergmann O, Bernard M, Brown AA, Cannon DM, Chakravarty MM, Christoforou A, Domin M, Grimm O, Hollinshead M, Holmes AJ, Homuth G, Hottenga JJ, Langan C, Lopez LM, Hansell NK, Hwang KS, Kim S, Laje G, Lee PH, Liu X, Loth E, Lourdusamy A, Mattingsdal M, Mohnke S, Maniega SM, Nho K, Nugent AC, O’Brien C, Papmeyer M, Putz B, Ramasamy A, Rasmussen J, Rijpkema M, Risacher SL, Roddey JC, Rose EJ, Ryten M, Shen L, Sprooten E, Strengman E, Teumer A, Trabzuni D, Turner J, van Eijk K, van Erp TG, van Tol MJ, Wittfeld K, Wolf C, Woudstra S, Aleman A, Alhusaini S, Almasy L, Binder EB, Brohawn DG, Cantor RM, Carless MA, Corvin A, Czisch M, Curran JE, Davies G, de Almeida MA, Delanty N, Depondt C, Duggirala R, Dyer TD, Erk S, Fagerness J, Fox PT, Freimer NB, Gill M, Goring HH, Hagler DJ, Hoehn D, Holsboer F, Hoogman M, Hosten N, Jahanshad N, Johnson MP, Kasperaviciute D, Kent JW, Jr, Kochunov P, Lancaster JL, Lawrie SM, Liewald DC, Mandl R, Matarin M, Mattheisen M, Meisenzahl E, Melle I, Moses EK, Muhleisen TW, Nauck M, Nothen MM, Olvera RL, Pandolfo M, Pike GB, Puls R, Reinvang I, Renteria ME, Rietschel M, Roffman JL, Royle NA, Rujescu D, Savitz J, Schnack HG, Schnell K, Seiferth N, Smith C, Steen VM, Valdes Hernandez MC, Van den Heuvel M, van der Wee NJ, Van Haren NE, Veltman JA, Volzke H, Walker R, Westlye LT, Whelan CD, Agartz I, Boomsma DI, Cavalleri GL, Dale AM, Djurovic S, Drevets WC, Hagoort P, Hall J, Heinz A, Jack CR, Jr, Foroud TM, Le Hellard S, Macciardi F, Montgomery GW, Poline JB, Porteous DJ, Sisodiya SM, Starr JM, Sussmann J, Toga AW, Veltman DJ, Walter H, Weiner MW, Bis JC, Ikram MA, Smith AV, Gudnason V, Tzourio C, Vernooij MW, Launer LJ, DeCarli C, Seshadri S, Andreassen OA, Apostolova LG, Bastin ME, Blangero J, Brunner HG, Buckner RL, Cichon S, Coppola G, de Zubicaray GI, Deary IJ, Donohoe G, de Geus EJ, Espeseth T, Fernandez G, Glahn DC, Grabe HJ, Hardy J, Hulshoff Pol HE, Jenkinson M, Kahn RS, McDonald C, McIntosh AM, McMahon FJ, McMahon KL, Meyer-Lindenberg A, Morris DW, Muller-Myhsok B, Nichols TE, Ophoff RA, Paus T, Pausova Z, Penninx BW, Potkin SG, Samann PG, Saykin AJ, Schumann G, Smoller JW, Wardlaw JM, Weale ME, Martin NG, Franke B, Wright MJ, Thompson PM. Identification of common variants associated with human hippocampal and intracranial volumes. Nat Genet. 2012;44:552–561. doi: 10.1038/ng.2250. [DOI] [PMC free article] [PubMed] [Google Scholar]
- Taal HR, St Pourcain B, Thiering E, Das S, Mook-Kanamori DO, Warrington NM, Kaakinen M, Kreiner-Moller E, Bradfield JP, Freathy RM, Geller F, Guxens M, Cousminer DL, Kerkhof M, Timpson NJ, Ikram MA, Beilin LJ, Bonnelykke K, Buxton JL, Charoen P, Chawes BL, Eriksson J, Evans DM, Hofman A, Kemp JP, Kim CE, Klopp N, Lahti J, Lye SJ, McMahon G, Mentch FD, Muller-Nurasyid M, O’Reilly PF, Prokopenko I, Rivadeneira F, Steegers EA, Sunyer J, Tiesler C, Yaghootkar H, Breteler MM, Decarli C, Debette S, Fornage M, Gudnason V, Launer LJ, van der Lugt A, Mosley TH, Jr, Seshadri S, Smith AV, Vernooij MW, Blakemore AI, Chiavacci RM, Feenstra B, Fernandez-Banet J, Grant SF, Hartikainen AL, van der Heijden AJ, Iniguez C, Lathrop M, McArdle WL, Molgaard A, Newnham JP, Palmer LJ, Palotie A, Pouta A, Ring SM, Sovio U, Standl M, Uitterlinden AG, Wichmann HE, Vissing NH, van Duijn CM, McCarthy MI, Koppelman GH, Estivill X, Hattersley AT, Melbye M, Bisgaard H, Pennell CE, Widen E, Hakonarson H, Smith GD, Heinrich J, Jarvelin MR, Jaddoe VW. Common variants at 12q15 and 12q24 are associated with infant head circumference. Nat Genet. 2012;44:532–538. doi: 10.1038/ng.2238. [DOI] [PMC free article] [PubMed] [Google Scholar]
- Teipel SJ, Reuter S, Stieltjes B, Acosta-Cabronero J, Ernemann U, Fellgiebel A, Filippi M, Frisoni G, Hentschel F, Jessen F, Kloppel S, Meindl T, Pouwels PJ, Hauenstein KH, Hampel H. Multicenter stability of diffusion tensor imaging measures: a European clinical and physical phantom study. Psychiatry Res. 2011;194:363–371. doi: 10.1016/j.pscychresns.2011.05.012. [DOI] [PubMed] [Google Scholar]
- Teipel SJ, Wegrzyn M, Meindl T, Frisoni G, Bokde AL, Fellgiebel A, Filippi M, Hampel H, Kloppel S, Hauenstein K, Ewers M. Anatomical MRI and DTI in the Diagnosis of Alzheimer’s Disease: A European Multicenter Study. J Alzheimers Dis. 2012 doi: 10.3233/JAD-2012-112118. [DOI] [PubMed] [Google Scholar]
- Thomason ME, Thompson PM. Diffusion imaging, white matter, and psychopathology. Annu Rev Clin Psychol. 2011;7:63–85. doi: 10.1146/annurev-clinpsy-032210-104507. [DOI] [PubMed] [Google Scholar]
- Thompson PM, Cannon TD, Narr KL, van Erp T, Poutanen VP, Huttunen M, Lonnqvist J, Standertskjold-Nordenstam CG, Kaprio J, Khaledy M, Dail R, Zoumalan CI, Toga AW. Genetic influences on brain structure. Nat Neurosci. 2001;4:1253–1258. doi: 10.1038/nn758. [DOI] [PubMed] [Google Scholar]
- van Beijsterveldt CE, Groen-Blokhuis M, Hottenga JJ, Franic S, Hudziak JJ, Lamb D, Huppertz C, de Zeeuw E, Nivard M, Schutte N, Swagerman S, Glasner T, van Fulpen M, Brouwer C, Stroet T, Nowotny D, Ehli EA, Davies GE, Scheet P, Orlebeke JF, Kan KJ, Smit D, Dolan CV, Middeldorp CM, de Geus EJ, Bartels M, Boomsma DI. The Young Netherlands Twin Register (YNTR): longitudinal twin and family studies in over 70,000 children. Twin Res Hum Genet. 2013;16:252–267. doi: 10.1017/thg.2012.118. [DOI] [PubMed] [Google Scholar]
- van den Heuvel MP, van Soelen IL, Stam CJ, Kahn RS, Boomsma DI, Hulshoff Pol HE. Genetic control of functional brain network efficiency in children. Eur Neuropsychopharmacol. 2012 doi: 10.1016/j.euroneuro.2012.06.007. [DOI] [PubMed] [Google Scholar]
- Van Horn JD, Grafton ST, Rockmore D, Gazzaniga MS. Sharing neuroimaging studies of human cognition. Nature neuroscience. 2004;7:473–481. doi: 10.1038/nn1231. [DOI] [PubMed] [Google Scholar]
- van Soelen IL, Brouwer RM, Peper JS, van Leeuwen M, Koenis MM, van Beijsterveldt TC, Swagerman SC, Kahn RS, Hulshoff Pol HE, Boomsma DI. Brain SCALE: brain structure and cognition: an adolescent longitudinal twin study into the genetic etiology of individual differences. Twin Res Hum Genet. 2012;15:453–467. doi: 10.1017/thg.2012.4. [DOI] [PubMed] [Google Scholar]
- Verweij KJ, Zietsch BP, Lynskey MT, Medland SE, Neale MC, Martin NG, Boomsma DI, Vink JM. Genetic and environmental influences on cannabis use initiation and problematic use: a meta-analysis of twin studies. Addiction. 2010;105:417–430. doi: 10.1111/j.1360-0443.2009.02831.x. [DOI] [PMC free article] [PubMed] [Google Scholar]
- Weiner MW, Veitch DP, Aisen PS, Beckett LA, Cairns NJ, Green RC, Harvey D, Jack CR, Jagust W, Liu E, Morris JC, Petersen RC, Saykin AJ, Schmidt ME, Shaw L, Siuciak JA, Soares H, Toga AW, Trojanowski JQ. The Alzheimer’s Disease Neuroimaging Initiative: a review of papers published since its inception. Alzheimers Dement. 2012;8:S1–68. doi: 10.1016/j.jalz.2011.09.172. [DOI] [PMC free article] [PubMed] [Google Scholar]
- Zhan L, Jahanshad N, Ennis DB, Jin Y, Bernstein MA, Borowski BJ, Jack CR, Jr, Toga AW, Leow AD, Thompson PM. Angular versus spatial resolution trade-offs for diffusion imaging under time constraints. Hum Brain Mapp. 2012 doi: 10.1002/hbm.22094. [DOI] [PMC free article] [PubMed] [Google Scholar]
- Zuk O, Hechter E, Sunyaev SR, Lander ES. The mystery of missing heritability: Genetic interactions create phantom heritability. Proceedings of the National Academy of Sciences of the United States of America. 2012;109:1193–1198. doi: 10.1073/pnas.1119675109. [DOI] [PMC free article] [PubMed] [Google Scholar]
Associated Data
This section collects any data citations, data availability statements, or supplementary materials included in this article.