

Abstract
Decline in executive function is the most common age-associated cognitive deficit and may be a risk factor for neurodegenerative disease. The antisaccade (AS) task involves inhibition of a prepotent visuomotor response and is a well-validated executive function test in aging and neurodegeneration. We investigated the functional connectivity of the cortical oculomotor network during successful AS performance in healthy elders. Elevated BOLD activity in the right lateral frontal eye field (rlatFEF), a region linked to volume loss in individuals with impaired AS performance, was associated with worse AS performance and weaker network efficiency. In contrast, hub integrity of the right dorsolateral prefrontal cortex (rDLPFC) and anterior cingulate cortex (rACC) was associated with better AS performance. These data suggest that while several right lateral frontal regions are central nodes in the oculomotor network, the rlatFEF demonstrates early neural aberrations and the rDLPFC and rACC continue to support inhibitory cognitive control in healthy elders. We conclude that alterations in AS task functional connectivity, quantified as hub and network efficiency, may be clinically-relevant biomarkers of cognitive decline in executive functioning.
Keywords: executive function, graph theory, aging, fMRI, antisaccade
1. Introduction
Aging is commonly associated with changes in cognitive function, which may reflect “normal aging” or an underlying neuropathological process. One of the earliest cognitive domains to exhibit age-related changes is executive function, which comprises higher-level cognitive control, such as planning, switching and inhibiting lower-level automatic functions (Stuss, 2007). Although age-related changes in executive function do not necessarily predict future cognitive decline, they may reflect underlying neuropathology of Alzheimer’s disease or other forms of dementia (Grady, 2012). Thus, understanding the mechanisms underlying executive dysfunction in aging is critical for improving assessment of individuals at risk for future cognitive decline.
The antisaccade (AS) task has emerged as a sensitive tool for evaluating executive function and was recently validated in a multicenter study of normal elders and individuals with neurological disease (Hellmuth et al., 2012). It is a simple oculomotor paradigm that is commonly used to study basic aspects of cognitive control and inhibition, as well as cognitive changes in aging and neurological disease (Hallet, 1978; Luna et al., 2008; Munoz and Everling, 2004). The task requires individuals to inhibit a prepotent, visually-guided saccade towards a peripheral target and to generate a voluntary saccade in the opposite direction. In healthy elders, impaired AS performance is strongly correlated with executive dysfunction and frontal oculomotor network brain volume (Mirsky et al., 2011). The AS task is also highly sensitive to changes in brain structure that occur with neurodegenerative diseases of aging (Boxer et al., 2006; Boxer et al., 2012; Garbutt et al., 2008), including the detection of presymptomatic neurodegeneration (Golding et al., 2006). Although a variety of studies have identified correlations between advancing age and declining AS performance (Klein et al., 2000; Luna et al., 2008; Olincy et al., 1997), there is considerable variability in AS performance in healthy elders. Elucidating the neural mechanisms responsible for this heterogeneous AS performance could lead to better stratification of healthy elders at risk of future cognitive decline or potentially new strategies for mitigating age-associated executive dysfunction.
Functional magnetic resonance imaging (fMRI) studies of the AS task in young adults have demonstrated greater activation of frontal and parietal lobe oculomotor control regions during AS conditions relative to reflexive, visually-guided prosaccade (PS) control conditions (Connolly et al., 2002; Curtis and D’Esposito, 2003). This is consistent with human lesion studies of AS task performance that implicated similar structures, particularly the dorsolateral prefrontal cortex (DLPFC) and anterior cingulate gyrus (ACC), as critical for correct performance (Hodgson et al., 2007; Pierrot-Deseilligny et al., 2003). In neurological diseases, such as schizophrenia, AS fMRI has elucidated neural mechanisms associated with executive dysfunction, revealing connectivity changes within the oculomotor network that correlate with impaired inhibition and error monitoring (Polli et al., 2008; Tu et al., 2010).
To investigate the neural mechanisms of executive function in healthy elders, we conducted an fMRI study of AS task performance to measure neural integrity in the cortical oculomotor network. Based on a previous study that found a significant relationship between volume loss in the right lateral frontal eye field (rlatFEF) and impaired AS task performance in patients (Boxer et al., 2006), we hypothesized that the rlatFEF would be an early site of executive dysfunction and that other key frontal regions, such as the DLPFC, would demonstrate compensatory activity to maintain performance in healthy elders.
2. Methods
2.1 Participants
Forty-five healthy elders (age 70.4 ± 7.1 years; range 57–85 years; 22 females) gave written informed consent to participate in this study, which was approved by the University of California, San Francisco Committee for Human Research. Two participants were removed from the group analysis due to poor data quality from excessive head motion. Participants were recruited from the University of California, San Francisco Memory and Aging center. Each participant underwent an extensive clinical evaluation including a detailed history, physical and neurological examination, neuropsychological testing, and study partner interview. The interview with the study partner involved the Clinical Dementia Rating (CDR) to assess functional abilities and the Neuropsychiatric Inventory (NPI) to evaluate behavior (Berg, 1988; Cummings et al., 1994). Screening for depression was done using the 30-item Geriatric Depression Scale (GDS) (Yesavage et al., 1983).
Participants had to have a CDR sum of boxes score of 0, a Mini-Mental State Examination (Folstein et al., 1975) score ≥ 28 and score within 1 SD of normative age and education-matched values on all neuropsychological tests. Of note, the selection of healthy elders without signs of cognitive impairment on traditional neuropsychological tests fits the study goal of examining subtle neural changes associated with executive function using a sensitive and validated AS task. Participants were excluded if they met criteria for mild cognitive impairment (Petersen et al., 1999) or dementia (McKhann et al., 2011), had a neurological disorder that could affect cognition, significant psychiatric illness, head trauma with loss of consciousness greater than 10 minutes, severe sensory deficits, substance abuse, or were taking medications that affect cognition.
2.2 Neuropsychological testing
Individuals were administered a comprehensive battery of neuropsychological tests assessing executive function, language, visuospatial skill, and memory. Tests of executive function included a modified Trailmaking Test (time to complete), DKEFS Design Fluency Condition 1 (number of unique designs in 60s), Stroop interference (number correct in 60s), letter fluency (D words in 60s), calculations (out of 5), abstractions (3 similarities, 3 proverbs), and backward digit span (longest length) (Kramer et al., 2003). Tests of language included a 15-item Boston Naming Test (number correct) (Kaplan et al., 1983) and Category fluency (number of animals in 60s) (Goodglass and Kaplan, 1983). Tests of visuospatial function included copy of the Benson figure and Number Location subtest from The Visual Object and Space Perception Battery (VOSP) (Warrington and James, 1991). Tests of memory included 20-minute delayed recall on California Verbal Learning Test-II (Delis et al., 2000) and 10-minute recall of the Benson figure (Possin et al., 2011).
2.3 Experimental design
Participants practiced a computerized version of the task prior to the fMRI scanning session to ensure their understanding of the task. Participants viewed the stimulus presentation monitor through a mirror located in front of their eyes. Stimuli were presented using E-Prime 2.0 software (Psychology Software Tools, Inc.: Pittsburgh, PA) (see Figure 1). Participants completed three sessions during the fMRI block-design study. Each session consisted of four randomized blocks of each condition (AS and PS). Each block consisted of 10 trials, for a total of 120 trials of each condition (3 sessions × 4 blocks × 10 trials). At the start of each block, the participant viewed instructions to “Follow the dot” (PS condition) or “Look away from the dot” (AS condition). Participants were presented with a central fixation spot containing a “+” symbol (PS condition) or “-” symbol (AS condition) for 300–500 ms. The fixation spot remained illuminated for 1300–1500 ms followed by a 200 ms gap. A target appeared 7 degrees to the right or left of the center for 1000 ms. Participants either looked at the eccentric target (PS condition) or in the opposite direction of the eccentric target (AS condition). A 1000 ms blank screen and 2000–6000 ms fixation period followed.
Figure 1. Saccade Experimental Paradigm and Scoring.

In the fMRI AS task paradigm, participants were instructed to “Follow the dot” (PS trial) or “Look away from the dot” (AS trial). The preparatory period of a variable was a 2 sec stage followed by a 2 sec response period and variable fixation interval. Eye position traces on six prosaccade trials for a single subject. Black lines indicate correct anti-saccade responses for the trial configuration shown here. Grey lines indicate trials where the subject made an erroneous saccade towards the target and then self-corrected. Trials are from the same session and subject.
2.4 fMRI eye tracking
Eye movements during the fMRI task were recorded with an MRI-compatible infrared eye tracking system (Applied Sciences Laboratory Eye-Trac 6). Eye movement data were sampled at 120 Hz. Eye movement traces were analyzed interactively offline using customized Matlab software (Mathworks, Natick, MA; release 2008b). To ensure fidelity of eye tracking data, all eye position traces were visually inspected for quality and any trials with unclear movements or missing data during the saccadic epoch were discarded. Direction was determined by marking the endpoint position of the first eye movement. Prosaccades were discarded if the eye movement was in the wrong direction. Antisaccades were considered correct if the first eye movement was in the direction opposite the target location. Self-corrected AS errors were recorded, but were not included in the AS task performance measure.
2.5 fMRI data acquisition
All fMRI data was collected on a Siemens 3T MAGNETOM Trio with stimuli presented on an LCD monitor positioned behind the head of the participants and viewed using a mirror rigidly attached to a 12-channel head coil. Echo planar imaging data were acquired (FA=77°, TE = 28 ms, TR = 2 s) with 29 interleaved axial slices and a 1.8 × 1.8 × 3 mm voxel size (FOV = 23 cm; 128 × 128 matrix). All pre-preprocessing of the data was conducted in SPM5 (Statistical Parametric Mapping, Wellcome Department of Imaging Neuroscience, London, England). Raw blood oxygen level dependent (BOLD) data was corrected offline for slice-timing acquisition and motion-artifacts. A 5 mm isotropic Gaussian smoothing kernel was applied prior to modeling the data. To aid in anatomical localizations of BOLD activity, high-resolution T1-MPRAGE images were acquired (1 × 1 × 1 mm voxel size; FOV = 160 × 240 × 256 mm, TR = 2300 ms, TE = 3 ms, FA = 9°).
Separate regressors were used to model the entire period of each stage (preparation and response) of the trial and convolved with a canonical Gaussian hemodynamic response function using SPM5. The single instruction period at the start of each block was removed from the analysis. In addition, three translational (X, Y, Z) and three rotational (pitch, roll, yaw) motion parameters were included in the GLM to account for motion-related artifacts. The resulting regression vector yielded scalar beta weights corresponding to the relative changes in signal strength associated with a particular trial stage. Correct and incorrect trials were modeled separately and only correct trials were subjected to further analysis. The preparation stage of the trial (cue, fixation and gap) was the focus of the analysis based on previous studies that demonstrated action planning occurs just prior to the presentation of the target in frontal and parietal regions (Brown et al., 2007; Curtis and Connolly, 2008).
2.6 fMRI whole-brain univariate analysis
Normalized statistical maps for each participant were subjected to second-order random effects analysis. Participants were included in the analysis if they had at least 40 correct AS trials and 40 correct PS trials. Regions of interest (ROI) were identified using the “All Good Trials > Fixation” contrast to identify regions involved in performing eye movements (PS or AS). This approach was used to avoid selection bias when identifying ROIs of the cortical oculomotor network, by not favoring activation patterns in support of a particular condition. Functionally- and anatomically-defined ROIs within the cortical oculomotor network were created using the whole brain group contrast maps (Matsuda et al., 2004; Miller et al., 2005; Pierrot-Deseilligny et al., 2005) and restricted by major structural landmarks to circumscribe regions when functional boundaries were unclear (Mirsky et al., 2011). We conducted Monte Carlo simulations of 1000 permutations using the AlphaSim function in AFNI to control for multiple tests and accepted a cluster-corrected threshold of p<0.05 on the whole brain level using the WFU Pickatlas toolbox (Maldjian et al., 2003). Sixteen ROI (8 bilateral pairs) were identified at the p<0.05, cluster-corrected threshold, including the frontal eye field (FEF), lateral frontal eye field (latFEF), inferior frontal gyrus (IFG), anterior cingulate cortex (ACC), and pre-supplementary motor area (pre-SMA), dorsal lateral prefrontal cortex (DLPFC), supplemental eye field (SEF), and parietal eye field (PEF) (Table 2). The BOLD signal (β) in each ROI from the preparation stage was extracted for each participant and subjected to further analysis.
Table 2. Cortical oculomotor network regions of interest.
Eight bilateral a priori regions of interest (ROI) of the cortical oculomotor network involved in saccadic movements. ROIs were anatomically- and functionally-constrained across participants and submitted to regional and network-level analyses. All ROIs survived cluster-correction for multiple comparisons at p<0.05.
| Cortical oculomotor network | LEFT | RIGHT | ||||||
|---|---|---|---|---|---|---|---|---|
|
| ||||||||
| Regions of Interest | x | y | z | mm3 | x | y | z | mm3 |
| Anterior Cingulate Cortex | −2 | 30 | 30 | 928 | 0 | 20 | 30 | 1176 |
| Dorsolateral Prefrontal Cortex | −14 | 52 | 30 | 296 | 20 | 52 | 34 | 952 |
| Lateral Frontal Eye Field | −50 | −8 | 52 | 1704 | 62 | 12 | 30 | 3920 |
| Frontal Eye Field | −28 | −6 | 68 | 3704 | 26 | 0 | 68 | 4632 |
| Inferior Frontal Gyrus | −58 | 8 | 6 | 1924 | 54 | 12 | 0 | 3144 |
| Pre-supplemental Motor Area | −10 | 22 | 58 | 1736 | 16 | 14 | 64 | 1696 |
| Supplemental Eye Field | −6 | −6 | 76 | 2008 | 8 | 8 | 64 | 3088 |
| Parietal Eye Field | −28 | −52 | 64 | 4736 | 38 | −50 | 56 | 6648 |
2.7 fMRI functional connectivity analysis
Functional connectivity values were generated for each ROI pair using the beta series correlation method computed using customized MATLAB scripts that call upon SPM5 functions (Gazzaley et al., 2004; Rissman et al., 2004). This method leverages the trial-by-trial variability for each stage of every trial across ROIs for each participant. Importantly, a new GLM design matrix is created that is distinct from the main effects univariate GLM used to identify the ROIs, which results in independent datasets. This GLM was constructed in which each stage from each trial was coded with a unique covariate. This process resulted in a total of 480 covariates of interest being entered into the GLM (2 stages per trial × 10 trials per block × 12 runs × 2 task conditions). This procedure produced a whole brain Pearson’s r-value map for each subject and a Fisher’s r-to-z transformation was applied. Single-subject maps were subsequently normalized to the custom template in MNI space (2 × 2 × 2 mm voxel size) and Gaussian smoothed (5 mm FWHM) for group analysis. Functional connectivity values were restricted to each ROI mask and averaged across all voxels in the ROI for each participant. The preparation stage of the AS condition was subjected to graph theory network analysis. Of note, the values for the BOLD signal and functional connectivity across subjects for each ROI are derived from distinct general linear models (i.e., univariate or beta series correlation), creating two independent datasets for analysis.
2.8 Graph-based network analysis
To understand the relative contribution of each ROI (therein referred to as “node”) to the oculomotor cortical network, we examined two graph theoretical metrics for every network node: betweenness centrality and total flow. Betweenness centrality was calculated as the fraction of shortest paths connecting any two nodes in the network that pass through a particular node (Iturria-Medina et al., 2008). A node with high betweenness centrality is considered a “connector hub” and serves to link network subsystems (Bullmore and Sporns, 2009; Honey et al., 2007). Total flow was calculated as the sum of the magnitudes of the weighted connections passing through each node. Nodes with higher total flow have more numerous and robust connections to other nodes and play a key role in “network efficiency” (Zhou et al., 2012).
Graph theoretical measures were computed using customized MATLAB scripts based on the publicly available Matlab BGL graph library (https://github.com/dgleich/matlab-bgl) and the associated mathematical notation (Rubinov and Sporns, 2010). First of all, un-thresholded participant-level functional connectivity matrices were generated, using the functional connectivity z-scores between node pairs as the weights of the undirected edges. A group-level network connectivity matrix was then derived using a one-sample t-test. Significant edges were determined by thresholding at p < 0.001, FDR-corrected (false discovery rate) for multiple comparisons across the matrix (Caeyenberghs et al., 2012; Zhou et al., 2012)).
Betweenness centrality and total flow were computed from the thresholded, corrected individual participant functional connectivity matrices to identify network hubs (Matlab BGL toolbox: Purdue University, Indiana). Individual subject ROI values were entered into subsequent analyses relating network connectivity to measures of fMRI BOLD signal, AS task performance. All relationships were assessed using partial correlations to control for age, gender, and education.
3. Results
3.1 Demographics and Neuropsychological testing
On all neuropsychological tests of executive function, the subjects performed within 1 SD of age- and education- matched normative values (Table 1).
Table 1. Participant demographics and executive function testing.
Demographics and executive function test performance. All participants performed within age- and education-matched normative values. The ApoE4 (apolipoprotein-E) status of one participant was unknown.
| Demographics (n=43) | Participants |
|---|---|
| Age (years) | 70.4 ± 7.1 |
| Gender (male/female) | 21/22 |
| Handedness (both/left/right) | 2/6/35 |
| Education (years) | 17.4 ± 2.2 |
| ApoE4 (non-carrier/carrier) | 31/11 |
| GDS (max 30) | 2.9 ± 3.0 |
| MMSE (max 30) | 29.6 ± 0.7 |
| CDR | 0 ± 0 |
| AS Performance (% correct) | 76.4 ± 11.5 |
|
| |
| Executive Function | |
|
| |
| Modified Trails Time (max 120 secs) | 24.4 ± 11.3 |
| Modified Trails Errors (max 14) | 0.21 ± 0.52 |
| Design Fluency (number correct in 60 secs) | 11.3 ± 4.2 |
| Stroop Inhibition (number correct in 60 secs) | 51.3 ± 13.5 |
| Stroop Color Naming (number correct in 60 secs) | 85.9 ± 18.4 |
| Abstraction (max 6) | 5.0 ± 2.0 |
| Backward Digit Span (length) | 5.3 ± 1.5 |
Values are shown as means and standard deviations.
3.2 AS task performance
Participants first completed the AS task outside of the scanner to become familiar with the task and to ensure similar performance during the fMRI scan. Participants completed the AS task outside of the scanner with 78.9±20.7% accuracy and the AS task inside of the scanner with 76.4±11.5% accuracy. There was high reliability of task performance across participants for the two testing environments (r=0.68, p<0.0001).
3.3 fMRI univariate whole-brain analysis
We computed whole-brain univariate statistical maps for the contrasts of Prosaccade>Fixation (PS) and Antisaccade>Fixation (AS) contrasts (Figure 2). In the PS and AS conditions, classic oculomotor regions encompassing frontal, parietal, and visual cortices were active (p<0.05, FDR-corrected).
Figure 2. Whole-brain activation maps for prosaccades and antisaccades.
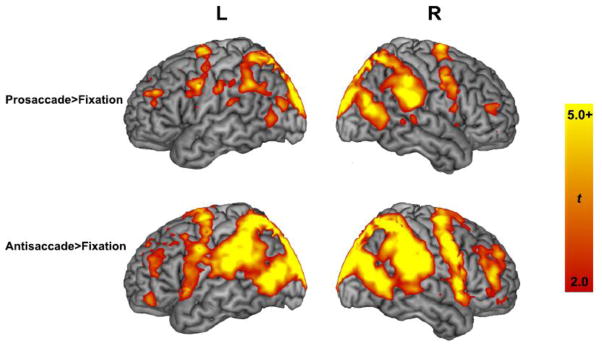
Whole brain activation patterns rendered onto a 3-dimension brain during the preparation of prosaccades relative to fixation and antisaccades relative to fixation. Activation maps are shown at a statistical threshold of p<0.05, FDR-corrected for multiple comparisons.
3.4 ROI BOLD activity and AS task performance
Consistent with the a priori hypothesis, there was an inverse correlation between ROI BOLD signal of the rlatFEF and AS task performance (% correct) (partial r = −0.37, p = 0.02), such that participants with greater BOLD signal in the rlatFEF, a reflection of regional hyperactivity, performed worse on the AS task.
3.5 Graph theoretical metrics
Color matrices of functional connectivity between each node pair (Figure 4A) and the correlation of each node pair to AS task performance (Figure 4B) are shown for display purposes. Graph theoretical metrics of betweenness centrality and total flow were evaluated using weighted nodes from the functional connectivity analysis. Betweenness Centrality: There was a significant one-way ANOVA for betweenness centrality across the sixteen ROIs [F(15,672)=17.72, p<0.0001]. Post-hoc comparisons revealed that the rlatFEF had the highest betweenness centrality, which was significantly greater than all network nodes at p<0.05, except the left latFEF and the right ACC, PEF, and DLPFC. Several right-lateralized ROIs had higher betweenness centrality (as illustrated by node size in Figure 4C) when compared to their left-lateralized homologues, including the right ACC, IFG, DLPFC, preSMA, and PEF (p<0.05). Total Flow: There was a significant one-way ANOVA for total flow across the sixteen ROIs [F(15,672)=28.81, p<0.0001]. Post-hoc comparisons revealed that the rlatFEF had the highest total flow across all network nodes (p<0.05), except the right PEF. There was a similar lateralized pattern for total flow, such that all right-lateralized regions, except the FEF, had greater total flow than their left-sided homologues (p<0.05) (as illustrated by node color in Figure 4C).
Figure 4. Graph Theoretical Representation of the Cortical Oculomotor Network.

(A) Network connectivity during antisaccade trials. The color matrix displays the node-to-node correlation of all node pairs of the oculomotor network across participants. (B) Network connectivity during antisaccade trials associated with AS performance. The color matrix displays the node pair correlation with AS task performance across participants. (C) Edge width represents the correlation between two nodes, with a thicker line indicating a higher correlation. Node size represents the betweenness centrality of a given node, with a larger size indicating a higher betweenness centrality. Node color represents the total flow of a given node, with a darker red indicating a higher total flow and lighter red indicating a lower total flow. The rlatFEF had the highest betweenness centrality and greatest total flow in the network. (D) Edge width represents the correlation between two nodes, with a thicker line indicating a higher correlation. Node size represents the correlation between the betweenness centrality of a given node and anti-saccade task performance, with a larger size indicating a higher correlation. Node color represents the sign of the correlation coefficient, with a darker red indicating a more positive correlation and a darker blue indicating a more negative correlation.
3.6 Graph theoretical metrics and AS task performance
Betweenness centrality of the rlatFEF did not significantly predict AS task performance (partial r = 0.17, p = 0.28), which may be a reflection of early functional aberrations in this node. In contrast, betweenness centrality of the rDLPFC significantly correlated with AS task performance (partial r = 0.34, p = 0.03). To examine the potential role of other nodes, the relationship between betweenness centrality and AS task performance was analyzed for the remaining 13 nodes. Right ACC (rACC) betweenness centrality was identified as having an inverse relationship with performance (partial r = −0.43, p = 0.005, corrected for multiple comparisons) (Figure 5), such that those with lower involvement of the rACC performed better on the AS task. No other nodes demonstrated a significant relationship involving betweenness centrality and task performance (Figure 4D). Furthermore, no nodes demonstrated a significant relationship between total flow and task performance.
Figure 5. Betweenness centrality and AS task performance.

A positive correlation between the betweenness centrality of the rDLPFC and AS task performance was observed across the participants, suggesting that individuals with greater integrity of the rDLPFC as a network hub performed better on the AS task. In contrast, an inverse relationship between the betweenness centrality of the rACC and AS task performance was observed, suggesting that individuals who were less connected to rACC performed better on the task. A partial correlation was performed to control for age, gender, and education.
3.7 Graph theoretical metrics and ROI BOLD activity
Because the regional hyperactivity in the rlatFEF resulted in worse AS performance (as shown in Figure 3), we predicted that the elevated BOLD signal would also impact network function. That is, those individuals with aberrantly elevated rlatFEF activity would have reduced total flow to this node. An inverse relationship between rlatFEF BOLD activity and rlatFEF total flow was observed, suggesting that elders with greater activity in the rlatFEF had reduced connectivity with the other nodes of the cortical oculomotor network (partial r = −0.39, p = 0.01) (Figure 6). Consistent with our previous finding, the reduction of functional network connectivity with the rlatFEF suggests a breakdown in the functional connectedness of this node to the overall network. This relationship was not found for the other nodes, suggesting that the rlatFEF may exhibit early selective vulnerability.
Figure 3. The rlatFEF BOLD signal is associated with AS Performance.

An inverse relationship between BOLD activation in the rlatFEF during the ASPS contrast and performance on the antisaccade task was observed, demonstrating that elders with greater activation had worse performance. A partial correlation was performed to control for age, gender, and education.
Figure 6. The relationship between rlatFEF BOLD activity and total flow.

An inverse relationship between BOLD activation in the rlatFEF during the ASPS contrast and total flow on the antisaccade task was observed, suggesting that elders with a greater activity in the rlatFEF have reduced connectivity with the other nodes of the oculomotor network. A partial correlation was performed to control for age, gender and education.
3.8 Traditional neuropsychological test and ROI BOLD activity
Our previous studies in healthy elders have identified a strong correlation between antisaccade performance and the inhibition condition of the Stroop neuropsychological test (Mirsky et al., 2011; Heuer et al., 2013). Consistent with these results, we found a correlation between the Stroop-inhibition and mean AS fMRI BOLD of the rlatFEF (partial r= −0.39, p=0.01), suggesting that those with more hyperactivity in the rlatFEF performed more poorly on the Stroop-inhibition test.
4. Discussion
The goal of this study was to determine the neural correlates of executive function performance in healthy elders, using the AS task as a tool to link brain function and connectivity to behavior within a well-defined cortical network. The rlatFEF, which had previously been identified as a selectively vulnerable node in structural neuroimaging studies, emerged in our study with a hyperactive BOLD signal that was associated with worse AS task performance in healthy elders. Using graph theoretical analysis, the rlatFEF was again identified as a critical hub in the AS network, with the highest absolute betweenness centrality and greatest total flow. Moreover, connectivity to an adjacent node, the rDLPFC, previously implicated as key regions in human lesion studies of AS task performance (Hodgson et al., 2007; Pierrot-Deseilligny et al., 2003), were positively correlated with AS task performance. In contrast, the rACC was negatively correlated with AS task performance, which may reflect its role in error monitoring and preparation for subsequent saccades (Brown et al., 2007; Ford et al., 2005). Lastly, the negative correlation between the rlatFEF BOLD and Stroop-inhibition, a widely-used assessment of inhibitory control, supports our interpretation that the rlatFEF is a site of early neural dysfunction, and is consistent with our result that the hyperactive rlatFEF hyperactive BOLD signal is associated with worse AS task performance. Collectively, these findings suggest that individual differences in executive control in healthy elders may emerge from altered activity within a fronto-parietal brain network. The striking similarity between the neuroanatomy of task-related BOLD alterations identified here in normal elders and structural brain alterations in patients with age-related neurodegenerative disease and focal brain lesions suggests that our methods may be useful tools to study early stages of neurodegeneration, a period when new disease-modifying interventions are most likely to be effective in preventing cognitive decline.
The main observations from this fMRI study of AS task performance in healthy elderly individuals suggests that task-related network alterations during correct AS trials are related to findings in patients with impaired AS function. The BOLD signal of the rlatFEF, a region previously implicated in studies of AS performance in neurodegenerative disease, was associated with overall task performance (percentage of correct AS responses). Interestingly, there was a negative correlation between overall task performance and rlatFEF BOLD activity during AS performance (AS > PS trials), suggesting that elevated signal reflects neural aberrations that are detrimental to performance. The rlatFEF lies in the lateral portion of BA 6, a region associated with top-down control in a visual attention in healthy young adults (Buchel et al., 1998) and overlaps with the inferior frontal junction (IFJ) (Derrfuss et al., 2012). The IFJ has been implicated in executive tasks requiring attentionally-mediated cognitive control (Demeter et al., 2011), and a recent study demonstrated that perturbation of IFJ activity using transcranial magnetic stimulation resulted in impaired executive control in healthy young adults (Zanto et al., 2011), concluding that the rlatFEF is an important network hub for executive control. Given the present findings, in combination with our previous studies that demonstrated AS task performance is correlated with executive function in healthy elders (Mirsky et al., 2011) and patients with neurological disease (Hellmuth et al., 2012), we conclude that altered AS task-related connectivity may be a clinically-relevant biomarker of cognitive decline.
Although BOLD activity within the rlatFEF was negatively correlated with task performance, nodal connectivity as measured by betweenness centrality, was positively correlated with task performance in the rDLPFC, a node adjacent to the rlatFEF. Notably, these nodes were previously implicated as key structures in human lesion studies of AS control in younger individuals (Hodgson et al., 2007; Pierrot-Deseilligny et al., 2003). Taken together, we conclude that the rlatFEF and rDLPFC are components of an important subnetwork for determining accurate AS performance in healthy elders and in fact, the rDLPFC may continue to function normally in the setting of early aberrations in the rlatFEF.
There is a broad literature in younger adults on the neural correlates of the AS task that are supportive of the findings in this healthy elder study. The right DLPFC and ACC, in addition to other regions, are commonly implicated in performing the AS task (Brown et al., 2006; Ettinger et al., 2008). These frontal regions, among others, play a significant role in the inhibitory control necessary for AS and become fully developed in adulthood (Hwang et al., 2010). Widespread involvement of a frontoparietal control network has been reported in healthy young adults during the preparation of saccadic movement and is consistent with the regions of interest investigated in the current study (Curtis and Connolly, 2008; Ford et al., 2005). Notably, Raemaekers and colleagues (Raemaekers et al., 2006) conducted an AS fMRI study across three age ranges from 18 to 72 years and found that healthy adults recruited more frontal oculomotor regions with increasing and advanced age, supporting our conclusion that frontal regions, such as the rlatFEF and rDLPFC, are critical network hubs for AS performance and may be selectively vulnerable with age. Because the previous study did not identify a significant relationship between regional BOLD signal and AS task performance in individual subjects, our study provides new insights into the underlying mechanisms responsible for the elevated BOLD signal in older individuals.
The reported results are similar to fMRI studies in individuals at risk for Alzheimer’s disease. During associative memory tasks, individuals with mild cognitive impairment (MCI), have an elevated BOLD signal in the hippocampus as compared to healthy elders, which is believed to reflect either compensatory action or early neuronal dysfunction (Dickerson and Sperling, 2008). Whether the elevated signal is beneficial and compensatory or portends future decline is still under investigation (Jagust and Mormino, 2011). The present finding that individuals with greater rlatFEF activation demonstrated poorer AS task performance and weakened functional network hub integrity may reflect a similar biological process as that seen with increased hippocampal BOLD signal in MCI.
This study suggests that aberrations in brain regions, such as the rlatFEF, may be a sensitive clinical marker of early cognitive dysfunction. Addressing the feasibility and utility of fMRI as a biomarker is important and has been discussed previously (Sperling, 2011). While there are several potential advantages of using fMRI as a clinical biomarker, such as targeting specific cognitive domains, there are significant limitations that would need to be addressed before widespread clinical utility. In particular, the fMRI approach and design would need to be simplified and optimized for both execution and analysis. In addition, a range of parameters, such as the optimal number of trials needed for reliability, reproducibility, sensitivity and power, would need to be evaluated.
One potential limitation of this study’s experimental design is the close temporal relationship between the preparation and response stages of the task. Because of the slow, temporal lag of the fMRI BOLD signal, there is the potential of carry-over from the preparation stage into the response stage. However, previous studies have used a similar design and report results that distinguish preparation and response activity (Polli et al., 2008; Tu et al., 2010).
4.1 Conclusion
Using the AS task, a well-validated executive function task, allowed us to examine changes that occur in healthy aging and a time when neurodegenerative diseases are likely to be developing in some individuals, but have few clinical correlates. We found convergent evidence suggesting that right lateral nodes, centered on the rlatFEF, are critical hubs of the cortical oculomotor network. Hub and network efficiency may be important determinants of maintenance of executive functioning in aging, and in turn, alterations in key frontal regions may serve as a clinical biomarker of subsequent cognitive decline.
Highlights.
We examined functional connectivity of the cortical oculomotor network
Integrity of key frontal regions were differentially related to task performance
The rlatFEF demonstrated early aberrant neural activity in healthy elders
The rDLPFC and rACC serve as compensatory network hubs to maintain task performance
Antisaccade task connectivity may be a clinical biomarker of cognitive decline
Acknowledgments
This work was supported by the National Institutes of Health (R01AG031278 to A.L.B., K01AG034175 to J.P., and P50AG023501 B.L.M.), John Douglas French Foundation, and Larry L. Hillblom Foundation. We thank our research participants for their invaluable contribution to this work.
Footnotes
Publisher's Disclaimer: This is a PDF file of an unedited manuscript that has been accepted for publication. As a service to our customers we are providing this early version of the manuscript. The manuscript will undergo copyediting, typesetting, and review of the resulting proof before it is published in its final citable form. Please note that during the production process errors may be discovered which could affect the content, and all legal disclaimers that apply to the journal pertain.
References
- Berg L. Clinical Dementia Rating (CDR) Psychopharmacol Bull. 1988;24:637–639. [PubMed] [Google Scholar]
- Boxer AL, Garbutt S, Rankin KP, Hellmuth J, Neuhaus J, Miller BL, Lisberger SG. Medial versus lateral frontal lobe contributions to voluntary saccade control as revealed by the study of patients with frontal lobe degeneration. J Neurosci. 2006;26:6354–6363. doi: 10.1523/JNEUROSCI.0549-06.2006. [DOI] [PMC free article] [PubMed] [Google Scholar]
- Boxer AL, Garbutt S, Seeley WW, Jafari A, Heuer HW, Mirsky J, Hellmuth J, Trojanowski JQ, Huang E, DeArmond S, Neuhaus J, Miller BL. Saccade abnormalities in autopsy-confirmed frontotemporal lobar degeneration and Alzheimer disease. Archives of neurology. 2012;69:509–517. doi: 10.1001/archneurol.2011.1021. [DOI] [PMC free article] [PubMed] [Google Scholar]
- Brown MR, Goltz HC, Vilis T, Ford KA, Everling S. Inhibition and generation of saccades: rapid event-related fMRI of prosaccades, antisaccades, and nogo trials. Neuroimage. 2006;33:644–659. doi: 10.1016/j.neuroimage.2006.07.002. [DOI] [PubMed] [Google Scholar]
- Brown MR, Vilis T, Everling S. Frontoparietal activation with preparation for antisaccades. J Neurophysiol. 2007;98:1751–1762. doi: 10.1152/jn.00460.2007. [DOI] [PubMed] [Google Scholar]
- Buchel C, Josephs O, Rees G, Turner R, Frith CD, Friston KJ. The functional anatomy of attention to visual motion. A functional MRI study. Brain. 1998;121 (Pt 7):1281–1294. doi: 10.1093/brain/121.7.1281. [DOI] [PubMed] [Google Scholar]
- Bullmore E, Sporns O. Complex brain networks: graph theoretical analysis of structural and functional systems. Nat Rev Neurosci. 2009;10:186–198. doi: 10.1038/nrn2575. [DOI] [PubMed] [Google Scholar]
- Caeyenberghs K, Leemans A, Heitger MH, Leunissen I, Dhollander T, Sunaert S, Dupont P, Swinnen SP. Graph analysis of functional brain networks for cognitive control of action in traumatic brain injury. Brain. 2012;135:1293–1307. doi: 10.1093/brain/aws048. [DOI] [PubMed] [Google Scholar]
- Connolly JD, Goodale MA, Menon RS, Munoz DP. Human fMRI evidence for the neural correlates of preparatory set. Nat Neurosci. 2002;5:1345–1352. doi: 10.1038/nn969. [DOI] [PubMed] [Google Scholar]
- Cummings JL, Mega M, Gray K, Thompson-Rosenberg J, Carusi DA, Gornbein J. The Neuropsychiatric Inventory: Comprehensive assessment of psychopathology in dementia. Neurology. 1994;44:2308–2314. doi: 10.1212/wnl.44.12.2308. [DOI] [PubMed] [Google Scholar]
- Curtis CE, Connolly JD. Saccade preparation signals in the human frontal and parietal cortices. J Neurophysiol. 2008;99:133–145. doi: 10.1152/jn.00899.2007. [DOI] [PMC free article] [PubMed] [Google Scholar]
- Curtis CE, D’Esposito M. Success and failure suppressing reflexive behavior. J Cogn Neurosci. 2003;15:409–418. doi: 10.1162/089892903321593126. [DOI] [PubMed] [Google Scholar]
- Delis DC, Kramer JH, Kaplan E, Ober BA. California Verbal Learning Test. 2. The Psychological Corporation; San Antonio, TX: 2000. [Google Scholar]
- Demeter E, Hernandez-Garcia L, Sarter M, Lustig C. Challenges to attention: a continuous arterial spin labeling (ASL) study of the effects of distraction on sustained attention. Neuroimage. 2011;54:1518–1529. doi: 10.1016/j.neuroimage.2010.09.026. [DOI] [PMC free article] [PubMed] [Google Scholar]
- Derrfuss J, Vogt VL, Fiebach CJ, von Cramon DY, Tittgemeyer M. Functional organization of the left inferior precentral sulcus: dissociating the inferior frontal eye field and the inferior frontal junction. Neuroimage. 2012;59:3829–3837. doi: 10.1016/j.neuroimage.2011.11.051. [DOI] [PubMed] [Google Scholar]
- Dickerson BC, Sperling RA. Functional abnormalities of the medial temporal lobe memory system in mild cognitive impairment and Alzheimer’s disease: insights from functional MRI studies. Neuropsychologia. 2008;46:1624–1635. doi: 10.1016/j.neuropsychologia.2007.11.030. [DOI] [PMC free article] [PubMed] [Google Scholar]
- Ettinger U, Ffytche DH, Kumari V, Kathmann N, Reuter B, Zelaya F, Williams SC. Decomposing the neural correlates of antisaccade eye movements using event-related FMRI. Cereb Cortex. 2008;18:1148–1159. doi: 10.1093/cercor/bhm147. [DOI] [PubMed] [Google Scholar]
- Folstein MF, Folstein SE, McHugh PR. “Mini-mental state”;. A practical method for grading the cognitive state of patients for the clinician. J Psychiatr Res. 1975;12:189–198. doi: 10.1016/0022-3956(75)90026-6. [DOI] [PubMed] [Google Scholar]
- Ford KA, Goltz HC, Brown MR, Everling S. Neural processes associated with antisaccade task performance investigated with event-related FMRI. J Neurophysiol. 2005;94:429–440. doi: 10.1152/jn.00471.2004. [DOI] [PubMed] [Google Scholar]
- Garbutt S, Matlin A, Hellmuth J, Schenk AK, Johnson JK, Rosen H, Dean D, Kramer J, Neuhaus J, Miller BL, Lisberger SG, Boxer AL. Oculomotor function in frontotemporal lobar degeneration, related disorders and Alzheimer’s disease. Brain. 2008;131:1268–1281. doi: 10.1093/brain/awn047. [DOI] [PMC free article] [PubMed] [Google Scholar]
- Gazzaley A, Rissman J, D’Esposito M. Functional connectivity during working memory maintenance. Cogn Affect Behav Neurosci. 2004;4:580–599. doi: 10.3758/cabn.4.4.580. [DOI] [PubMed] [Google Scholar]
- Golding CV, Danchaivijitr C, Hodgson TL, Tabrizi SJ, Kennard C. Identification of an oculomotor biomarker of preclinical Huntington disease. Neurology. 2006;67:485–487. doi: 10.1212/01.wnl.0000218215.43328.88. [DOI] [PubMed] [Google Scholar]
- Goodglass H, Kaplan E. The assessment of aphasia and related disorders. Lea & Febiger; Philadelphia: 1983. [Google Scholar]
- Grady C. The cognitive neuroscience of ageing. Nat Rev Neurosci. 2012;13:491–505. doi: 10.1038/nrn3256. [DOI] [PMC free article] [PubMed] [Google Scholar]
- Hallet PE. Primary and secondary saccades to goals defined by instructions. Vision Res. 1978;18:1279–1296. doi: 10.1016/0042-6989(78)90218-3. [DOI] [PubMed] [Google Scholar]
- Hellmuth J, Mirsky J, Heuer HW, Matlin A, Jafari A, Garbutt S, Widmeyer M, Berhel A, Sinha L, Miller BL, Kramer JH, Boxer AL. Multi-center validation of a bedside anti-saccade task as a measure of executive function. Neurology. 2012 doi: 10.1212/WNL.0b013e318258f785. In press. [DOI] [PMC free article] [PubMed] [Google Scholar]
- Hodgson T, Chamberlain M, Parris B, James M, Gutowski N, Husain M, Kennard C. The role of the ventrolateral frontal cortex in inhibitory oculomotor control. Brain. 2007;130:1525–1537. doi: 10.1093/brain/awm064. [DOI] [PubMed] [Google Scholar]
- Honey CJ, Kotter R, Breakspear M, Sporns O. Network structure of cerebral cortex shapes functional connectivity on multiple time scales. Proc Natl Acad Sci U S A. 2007;104:10240–10245. doi: 10.1073/pnas.0701519104. [DOI] [PMC free article] [PubMed] [Google Scholar]
- Hwang K, Velanova K, Luna B. Strengthening of top-down frontal cognitive control networks underlying the development of inhibitory control: a functional magnetic resonance imaging effective connectivity study. The Journal of neuroscience: the official journal of the Society for Neuroscience. 2010;30:15535–15545. doi: 10.1523/JNEUROSCI.2825-10.2010. [DOI] [PMC free article] [PubMed] [Google Scholar]
- Iturria-Medina Y, Sotero RC, Canales-Rodriguez EJ, Aleman-Gomez Y, Melie-Garcia L. Studying the human brain anatomical network via diffusion-weighted MRI and Graph Theory. Neuroimage. 2008;40:1064–1076. doi: 10.1016/j.neuroimage.2007.10.060. [DOI] [PubMed] [Google Scholar]
- Jagust WJ, Mormino EC. Lifespan brain activity, beta-amyloid, and Alzheimer’s disease. Trends Cogn Sci. 2011;15:520–526. doi: 10.1016/j.tics.2011.09.004. [DOI] [PMC free article] [PubMed] [Google Scholar]
- Kaplan E, Goodglass H, Wintraub S. The Boston Naming Test. Lea and Febiger; Philadelphia: 1983. [Google Scholar]
- Klein C, Fischer B, Hartnegg K, Heiss WH, Roth M. Optomotor and neuropsychological performance in old age. Exp Brain Res. 2000;135:141–154. doi: 10.1007/s002210000506. [DOI] [PubMed] [Google Scholar]
- Kramer JH, Jurik J, Sha SJ, Rankin KP, Rosen HJ, Johnson JK, Miller BL. Distinctive neuropsychological patterns in frontotemporal dementia, semantic dementia, and Alzheimer disease. Cogn Behav Neurol. 2003;16:211–218. doi: 10.1097/00146965-200312000-00002. [DOI] [PubMed] [Google Scholar]
- Luna B, Velanova K, Geier CF. Development of eye-movement control. Brain and cognition. 2008;68:293–308. doi: 10.1016/j.bandc.2008.08.019. [DOI] [PMC free article] [PubMed] [Google Scholar]
- Maldjian JA, Laurienti PJ, Kraft RA, Burdette JH. An automated method for neuroanatomic and cytoarchitectonic atlas-based interrogation of fMRI data sets. Neuroimage. 2003;19:1233–1239. doi: 10.1016/s1053-8119(03)00169-1. [DOI] [PubMed] [Google Scholar]
- Matsuda T, Matsuura M, Ohkubo T, Ohkubo H, Matsushima E, Inoue K, Taira M, Kojima T. Functional MRI mapping of brain activation during visually guided saccades and antisaccades: cortical and subcortical networks. Psychiatry Res. 2004;131:147–155. doi: 10.1016/j.pscychresns.2003.12.007. [DOI] [PubMed] [Google Scholar]
- McKhann GM, Knopman DS, Chertkow H, Hyman BT, Jack CR, Jr, Kawas CH, Klunk WE, Koroshetz WJ, Manly JJ, Mayeux R, Mohs RC, Morris JC, Rossor MN, Scheltens P, Carrillo MC, Thies B, Weintraub S, Phelps CH. The diagnosis of dementia due to Alzheimer’s disease: recommendations from the National Institute on Aging-Alzheimer’s Association workgroups on diagnostic guidelines for Alzheimer’s disease. Alzheimers Dement. 2011;7:263–269. doi: 10.1016/j.jalz.2011.03.005. [DOI] [PMC free article] [PubMed] [Google Scholar]
- Miller LM, Sun FT, Curtis CE, D’Esposito M. Functional interactions between oculomotor regions during prosaccades and antisaccades. Hum Brain Mapp. 2005;26:119–127. doi: 10.1002/hbm.20146. [DOI] [PMC free article] [PubMed] [Google Scholar]
- Mirsky J, Heuer HW, Jafari A, Kramer J, Schenk AK, Viskontas I, Neuhaus J, Miller BL, Boxer AL. Anti-saccade performance predicts executive function and brain structure in normal elders. Cognitive and Behavioral Neurology. 2011;24:50–58. doi: 10.1097/WNN.0b013e318223f6c6. [DOI] [PMC free article] [PubMed] [Google Scholar]
- Munoz DP, Everling S. Look away: the anti-saccade task and the voluntary control of eye movement. Nat Rev Neurosci. 2004;5:218–228. doi: 10.1038/nrn1345. [DOI] [PubMed] [Google Scholar]
- Olincy A, Ross RG, Youngd DA, Freedman R. Age diminishes performance on an antisaccade eye movement task. Neurobiol Aging. 1997;18:483–489. doi: 10.1016/s0197-4580(97)00109-7. [DOI] [PubMed] [Google Scholar]
- Petersen RC, Smith GE, Waring SC, Ivnik RJ, Tangalos EG, Kokmen E. Mild cognitive impairment: clinical characterization and outcome. Arch Neurol. 1999;56:303–308. doi: 10.1001/archneur.56.3.303. [DOI] [PubMed] [Google Scholar]
- Pierrot-Deseilligny C, Muri RM, Nyffeler T, Milea D. The role of the human dorsolateral prefrontal cortex in ocular motor behavior. Ann N Y Acad Sci. 2005;1039:239–251. doi: 10.1196/annals.1325.023. [DOI] [PubMed] [Google Scholar]
- Pierrot-Deseilligny C, Muri RM, Ploner CJ, Gaymard B, Demeret S, Rivaud-Pechoux S. Decisional role of the dorsolateral prefrontal cortex in ocular motor behaviour. Brain. 2003;126:1460–1473. doi: 10.1093/brain/awg148. [DOI] [PubMed] [Google Scholar]
- Polli FE, Barton JJ, Thakkar KN, Greve DN, Goff DC, Rauch SL, Manoach DS. Reduced error-related activation in two anterior cingulate circuits is related to impaired performance in schizophrenia. Brain. 2008;131:971–986. doi: 10.1093/brain/awm307. [DOI] [PubMed] [Google Scholar]
- Possin KL, Laluz VR, Alcantar OZ, Miller BL, Kramer JH. Distinct neuroanatomical substrates and cognitive mechanisms of figure copy performance in Alzheimer’s disease and behavioral variant frontotemporal dementia. Neuropsychologia. 2011;49:43–48. doi: 10.1016/j.neuropsychologia.2010.10.026. [DOI] [PMC free article] [PubMed] [Google Scholar]
- Raemaekers M, Vink M, van den Heuvel MP, Kahn RS, Ramsey NF. Effects of aging on BOLD fMRI during prosaccades and antisaccades. J Cogn Neurosci. 2006;18:594–603. doi: 10.1162/jocn.2006.18.4.594. [DOI] [PubMed] [Google Scholar]
- Rissman J, Gazzaley A, D’Esposito M. Measuring functional connectivity during distinct stages of a cognitive task. Neuroimage. 2004;23:752–763. doi: 10.1016/j.neuroimage.2004.06.035. [DOI] [PubMed] [Google Scholar]
- Rubinov M, Sporns O. Complex network measures of brain connectivity: uses and interpretations. Neuroimage. 2010;52:1059–1069. doi: 10.1016/j.neuroimage.2009.10.003. [DOI] [PubMed] [Google Scholar]
- Sperling R. Potential of functional MRI as a biomarker in early Alzheimer’s disease. Neurobiology of Aging. 2011;32:S37–43. doi: 10.1016/j.neurobiolaging.2011.09.009. [DOI] [PMC free article] [PubMed] [Google Scholar]
- Stuss DT. New Approaches to Prefrontal Lobe Testing. In: Cummings BLMaJL., editor. The Human Frontal Lobes. Guilford Press; New York: 2007. pp. 292–305. [Google Scholar]
- Tu P, Buckner RL, Zollei L, Dyckman KA, Goff DC, Manoach DS. Reduced functional connectivity in a right-hemisphere network for volitional ocular motor control in schizophrenia. Brain. 2010;133:625–637. doi: 10.1093/brain/awp317. [DOI] [PMC free article] [PubMed] [Google Scholar]
- Warrington EK, James M. The Visual Object and Space Perception Battery. Thames Valley Test Company; Bury St Edmunds: 1991. [Google Scholar]
- Yesavage JA, Brink TL, Rolse TL, Lum O, Huang V, Adey M, Leiter VO. Development and validity of a Geriatric Depression Scale: A preliminary report. J Psychiatric Res. 1983;17:37–49. doi: 10.1016/0022-3956(82)90033-4. [DOI] [PubMed] [Google Scholar]
- Zanto TP, Rubens MT, Thangavel A, Gazzaley A. Causal role of the prefrontal cortex in top-down modulation of visual processing and working memory. Nat Neurosci. 2011;14:656–661. doi: 10.1038/nn.2773. [DOI] [PMC free article] [PubMed] [Google Scholar]
- Zhou J, Gennatas ED, Kramer JH, Miller BL, Seeley WW. Predicting regional neurodegeneration from the healthy brain functional connectome. Neuron. 2012;73:1216–1227. doi: 10.1016/j.neuron.2012.03.004. [DOI] [PMC free article] [PubMed] [Google Scholar]