Abstract
Intracellular pH (pHi) of Listeria monocytogenes was determined after exposure to NaCl or sorbitol in liquid and solid media (agar). Both compounds decreased pHi, and recovery on solid medium was impaired compared to that in liquid medium. N,N′-dicyclohexylcarbodiimide abolished pHi recovery, and lowering aw with glycerol showed no effect on pHi.
Listeria monocytogenes is a ubiquitous gram-positive food-borne pathogen, with a widespread occurrence in, e.g., fresh meat and poultry (10), processed ready-to-eat meats (15), seafood (17), soft-style cheeses (18), and butter (19). This frequent occurrence is mainly explained by its ability to survive and grow at conditions associated with normal processing and distribution of food, such as refrigeration temperatures (27), high NaCl concentrations (20), or water activities (aw) as low as 0.92 (24). Although L. monocytogenes is a neutrophile, it is tolerant to acidic conditions (5, 8), and Shabala et al. (22) demonstrated that L. monocytogenes maintained a constant intracellular pH (pHi) at extracellular pH (pHex) values as low as 4.0. Information on the effect of osmotic stress on pHi of L. monocytogenes seems not to be available, and therefore the main objective of the present study was to investigate the relationship between pHi of L. monocytogenes and osmotic stress in liquid brain heart infusion broth (BHI) as well as on solid BHI (agar) by using fluorescence ratio-imaging microscopy according to the methods of Budde and Jakobsen (4).
The strains of L. monocytogenes, EGD (kindly provided by Werner Goebel, Biozentrum, Universität Würzburg, Germany) and 4140 (the Danish Meat Research Institute, Roskilde, Denmark), were grown in BHI adjusted to pH 6.0 with HCl at 37°C for 10 h before use. Fluorescent labeling of the cells and image acquisition were performed essentially as previously described (4, 23), where washed cells were stained with 30 μM 5,6-carboxyfluorescein diacetate-succinimidyl ester at 30°C for 30 min. Excitation with 490- and 435-nm wavelengths was performed through a 510-nm dichroic mirror, and emission was recorded through an 515- to 565-nm band pass filter on a Coolsnapfx camera (Photometrics, Tucson, Ariz.). Ratio imagings were performed by using MetaFluor, version 4.5 (Universal Imaging Corporation, West Chester, Pa.), and a minimum of 40 single cells was analyzed in each experiment. For pH calibration, labeled cells were permeabilized with ethanol (63% [vol/vol]) and were suspended in either BHI broth or were immobilized on the surface of BHI agar adjusted with HCl or NaOH to a pH in the range 5.5 to 8.5 (steps of 0.5), allowing pHi to equilibrate to pHex. A polynomial model fitted to the data was subsequently used to calculate pHi.
In liquid BHI the labeled cells were immobilized on the surface of an 8-well chamber slide (Lab-Tek II Chambered cover glass; Nalge Nunc International) by adding 100 μl of bacterial suspension and allowing the cells to settle, followed by a brief rinse with phosphate-buffered saline before addition of liquid BHI (200 μl) adjusted to the desired pH and containing the desired concentrations of NaCl, sorbitol, or glycerol. For investigations on solid BHI, 15 g of agar/liter was added to the liquid BHI, and 1 ml of molten BHI agar (pH 6.0) containing various levels of NaCl, sorbitol, or glycerol was placed in the concavity of a special microscope slide (Micro Culture One Well; VWR International, Albertslund, Denmark). A coverslip was placed on top of the molten agar to provide a flat surface, and after solidification the coverslip was removed, 10 μl of labeled cells was spread onto the agar surface, and a fresh coverslip was placed on the agar when the liquid was absorbed. This absorption introduced a time lag, prohibiting the acquisition of images at time zero in the solid BHI system. However, the pHi value of the control experiment was essentially constant and was chosen to represent the initial pHi of the cells in the agar experiments.
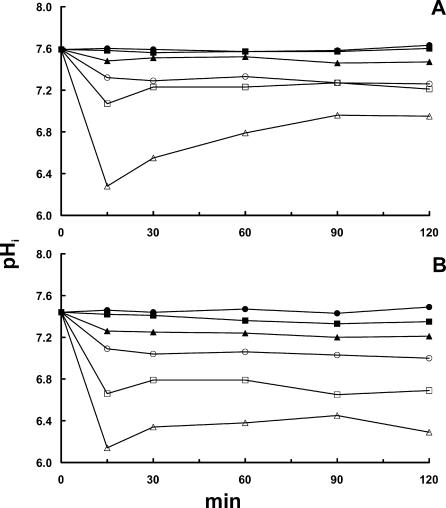
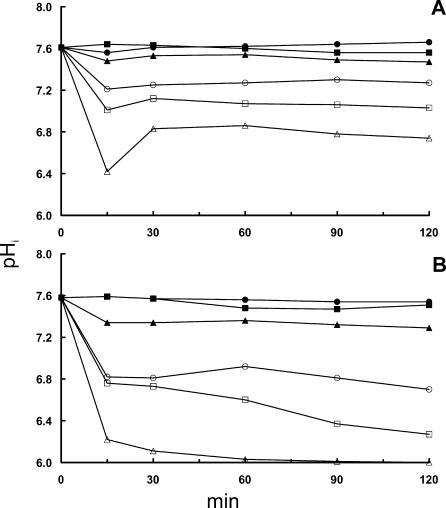
In contrast to earlier findings dealing with osmotically stressed Escherichia coli (9), we did not observe any transient increase in pHi of L. monocytogenes during the initial phase of exposure to osmotic stress. On the contrary, we observed a significant decrease in pHi following exposure to high concentrations of NaCl (Fig. 1 and 2). For clarity, error bars have been excluded from the figures, but the standard error mean of the pHi measurements in all figures were typically in the range of 0.01 and 0.05 and never exceeded 0.1. This very homogenous response indicates homogenous cultures, which would also be expected from the growth conditions. However, it is important to note that one of the greatest benefits of this method is the ability to evaluate the heterogeneity of a culture due to single-cell analysis, as previously demonstrated (4).
FIG. 1.
Effect of adding NaCl to liquid BHI (A) and solid BHI (B) on pHi of L. monocytogenes 4140 at a pHex of 6.0. Fluorescent images were acquired at 15-min intervals, and each point represents the average pHi of 40 randomly selected cells. Symbols indicate NaCl concentrations of 0 M (full circle), 0.5 M (full square), 1.0 M (full triangle), 1.5 M (open circle), 2.0 M (open square), and 2.5 M (open triangle).
FIG. 2.
Effect of adding NaCl to liquid BHI (A) and solid BHI (B) on pHi of L. monocytogenes EGD at a pHex of 6.0. Fluorescent images were acquired at 15-min intervals, and each point represents the average pHi of 40 randomly selected cells. Symbols indicate NaCl concentrations of 0 M (full circle), 0.5 M (full square), 1.0 M (full triangle), 1.5 M (open circle), 2.0 M (open square), and 2.5 M (open triangle).
Comparing liquid BHI (Fig. 1A and 2A) and solid BHI (Fig. 1B and 2B), it is seen that the effect of NaCl on pHi was more pronounced on the agar substrate, especially regarding the ability to restore pHi. Figure 1 shows that after 2 h of incubation, pHi reaches 6.8 and 6.3 on agar with 2.0 and 2.5 M NaCl; pH values when cells were exposed in broth were 7.2 and 6.8. For L. monocytogenes EGD, similar effects of NaCl concentrations were observed on pHi but with the noteworthy exception that this strain was not able to restore the gradient at all after 1.5 h of incubation on agar containing 2.5 M NaCl (Fig. 2B). When growth was investigated by using optical density measurements, addition of 2.0 M NaCl completely inhibited growth of strain 4140 for 24 h, whereas 1.5 M NaCl was sufficient to inhibit strain EGD (unpublished results).
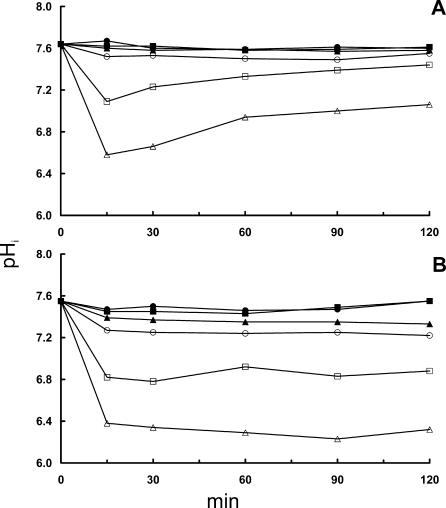
To examine whether this pHi regulation was specific for the ionic compound NaCl, L. monocytogenes was also exposed to osmotic stress by using the nonionic compound sorbitol in the same molar concentrations as that used for NaCl. The results showed almost the same effect of sorbitol as NaCl, although the initial decrease in pHi was less pronounced with sorbitol in liquid BHI, as seen for L. monocytogenes 4140 in Fig. 3A. The recovery on agar was impaired (Fig. 3B) compared to that in liquid (Fig. 3A), but the strain variety observed with NaCl was not observed with sorbitol, as the recovery of L. monocytogenes EGD was almost identical to that of strain 4140 (data not shown).
FIG. 3.
Effect of adding sorbitol to liquid BHI (A) and solid BHI (B) on pHi of L. monocytogenes 4140 at a pHex of 6.0. Fluorescent images were acquired at 15-min intervals, and each point represents the average pHi of 40 randomly selected cells. Symbols indicate NaCl concentrations of 0 M (full circle), 0.5 M (full square), 1.0 M (full triangle), 1.5 M (open circle), 2.0 M (open square), and 2.5 M (open triangle).
All water activities were determined with an Aqualab CX-2 (Decagon Devices, Inc., Pullman, Wash.) at 25°C, and the aw values observed in the sorbitol samples were higher than those in NaCl at identical molar concentrations (Table 1). When glycerol was added to liquid BHI until aw was 0.94, pHi remained constant around 7.6 (results not shown), similar to the control experiments with an aw of 0.995 (Table 1). This finding is not surprising, as glycerol is membrane permeant and therefore does not convey an osmotic stress. However, it underlines that aw per se does not affect pHi regulation, and therefore the observed pHi decrease in the NaCl and sorbitol samples cannot simply be attributed to a decreased aw, which suggests that other physicochemical properties of the aw-controlling solutes are involved (14).
TABLE 1.
aw of BHI with different additions of NaCl and sorbitol at pH 6.0
| Additive concn (M) | aw
|
|||
|---|---|---|---|---|
| Liquid BHI
|
Solid BHI
|
|||
| NaCl | Sorbitol | NaCl | Sorbitol | |
| 0 | 0.995 | 0.995 | 0.997 | 0.997 |
| 0.5 | 0.987 | 0.991 | 0.975 | 0.987 |
| 1.0 | 0.969 | 0.980 | 0.961 | 0.976 |
| 1.5 | 0.954 | 0.967 | 0.940 | 0.966 |
| 2.0 | 0.934 | 0.955 | 0.920 | 0.951 |
| 2.5 | 0.908 | 0.940 | 0.906 | 0.929 |
The pHi recovery of L. monocytogenes following a sharp immediate decrease may be explained by osmoadaption of the organism, most probably caused by accumulation of compatible solutes like glycine betaine and carnitine (1, 12, 25), increased proton pumping by the H+-ATPase (6), and consumption of intracellular protons by glutamate decarboxylase (7). Failure of bacteria to recover homeostasis under severe osmotic stress might reflect ATP depletion, which will inhibit the ATP-dependent uptake of glycine betaine and carnitine (11, 13, 29), or a decrease in the H+-ATPase activity (6).
To determine if pHi recovery was H+-ATPase dependent, cells were exposed to a 0.1 mM concentration of the ATPase inhibitor N,N′dicyclohexylcarbodiimide (DCCD) in liquid BHI and 0.1 mM DCCD in combination with 2.5 M NaCl. Table 2 shows that treatment of L. monocytogenes with DCCD only decreased pHi a little, from 7.6 to 7.3 during 60 min of exposure, whereas exposure to 2.5 M NaCl shows the decrease and slow recovery also observed in Fig. 1A. However, exposure to 2.5 M NaCl for 15 min followed by exposure to 2.5 M NaCl and 0.1 mM DCCD was more detrimental to the bacteria: the decrease in pHi was pronounced, and there was no apparent pHi recovery after 60 min, which strongly indicates that ATPase has a role in the recovery of pHi after exposure to osmotic stress. A previous study has shown similar synergistic effect between a compound affecting the proton permeability (ethanol) and osmotic stress imposed by NaCl or sucrose (2).
TABLE 2.
Regulation of pHi in L. monocytogenes 4140 after addition of DCCD and NaCl to liquid BHI at pH 6.0
| Time (min) | pHi of 40 randomly selected cells (average ± SEM) in:
|
|||
|---|---|---|---|---|
| BHI (control) | BHI + 0.1 mM DCCD | BHI + 2.5M NaCl | BHI + NaCl + DCCDa | |
| 0 | 7.62 ± 0.01 | 7.61 ± 0.01 | 7.61 ± 0.01 | 7.62 ± 0.01 |
| 30 | 7.62 ± 0.01 | 7.30 ± 0.04 | 6.84 ± 0.03 | 5.61 ± 0.01 |
| 60 | 7.66 ± 0.01 | 7.30 ± 0.06 | 6.99 ± 0.02 | 5.64 ± 0.01 |
Cells were exposed to 2.5 M NaCl for 15 min, and the medium was then replaced by liquid BHI containing 2.5 M NaCl and 0.1 mM DCCD.
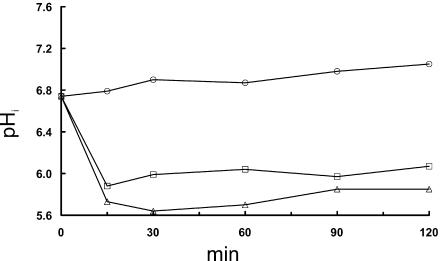
At a pHex value of 5.0 the cells in the control experiment were able to maintain homeostasis, as the pHi was constant within the interval 6.8 to 7.0 (Fig. 4). Addition of 2.0 and 2.5 M NaCl at pHex 5.0 caused a pronounced pHi reduction for L. monocytogenes 4140 in liquid BHI (Fig. 4), and the decrease after exposure to 2.0 M NaCl was particularly more pronounced than the effects observed at pHex 6.0 (Fig. 1A). The recovery of pHi after exposure to high concentrations of NaCl at pHex 5.0 was marginal within the 2 h of incubation (Fig. 4), which suggests a synergistic effect of low pHex and NaCl on the pHi regulation in L. monocytogenes.
FIG. 4.
Effect of adding increasing levels of NaCl to liquid BHI on pHi of L. monocytogenes 4140 at a pHex of 5.0. Addition of 0 M NaCl is indicated with circles, 2.0 M NaCl is indicated with squares, and 2.5 M NaCl is indicated with triangles. Each data point represents the average pHi of 40 randomly selected bacteria cells.
The observed discrepancies between the pHi regulations of bacteria on a structured matrix and those of a liquid environment of similar nutritional composition have not been reported previously, and the results are consistent with those of previous studies that revealed a decreased growth rate in solid medium compared to that in liquid medium (3). The most likely explanation for the discrepancy in the behavior of bacteria in liquid and on solid media is decreased diffusion rates in the solid matrix (28), as the chemical composition of the liquid and solid BHI are identical, with the exception of agar added to the solid system. Strain EGD was more impaired in pHi recovery on agar containing high concentrations of NaCl (1.5 to 2.5 M) (Fig. 2B) than was strain 4140. Among strains of L. monocytogenes investigated, strain EGD was very sensitive to gastric fluid (pH 2.5), which was linked to a low glutamate decarboxylase activity (7). The presence of NaCl and sorbitol in our solid system caused a pronounced decrease in pHi, and it is possible that the ensuing lack of recovery of strain EGD in the agar containing NaCl is due to interactions between NaCl and mechanisms regulating pHi, such as the glutamate decarboxylase.
During image analysis, it was noticed that the individual cells were shrinking considerably when NaCl or sorbitol was added in high concentrations, which suggests a loss of water. This is generally accepted as a response to osmotic upshifts (29) and is consistent with our pHi measurements, as a water loss would increase proton concentration and hence decrease pHi. A direct correlation between immediate cell shrinkage caused by osmotic stress and immediate pHi decrease was recently described for yeasts (26), but to our knowledge this correlation has not been demonstrated for bacteria. The present study demonstrates that the initial intracellular response to osmotic stress in L. monocytogenes is a decrease in pHi, which is also a reported response to acid stress (16, 22), and therefore it provides a direct physiological explanation for the cross-protection against osmotic stress that is observed after induction of acid tolerance response in L. monocytogenes (21).
In conclusion, the present study demonstrates that the initial response of an osmotic shock caused by NaCl or sorbitol is a drop in pHi. The rapid drop in pHi is followed by a slower recovery, where the magnitude of recovery is dependent on both solute concentration and solute type. Finally, the study demonstrates that the pHi recovery is reduced on a solid medium compared to that in a liquid medium. This underlines the recently raised issue that caution needs to be used when results obtained in liquid model systems are extrapolated to predict the fate of bacteria in structured foods (3).
Acknowledgments
This work is part of the scientific and technological research cooperation project between China and Denmark (project no. NPP83).
W. Fang is supported by a Danish International Development Agency (DANIDA) fellowship.
REFERENCES
- 1.Angelidis, A. S., and G. M. Smith. 2003. Three transporters mediate uptake of glycine betaine and carnitine by Listeria monocytogenes in response to hyperosmotic stress. Appl. Environ. Microbiol. 69:1013-1022. [DOI] [PMC free article] [PubMed] [Google Scholar]
- 2.Barker, C., and S. F. Park. 2001. Sensitization of Listeria monocytogenes to low pH, organic acids and osmotic stress by ethanol. Appl. Environ. Microbiol. 67:1594-1600. [DOI] [PMC free article] [PubMed] [Google Scholar]
- 3.Brocklehurst, T. F., G. A. Mitchell, and A. C. Smith. 1997. A model experimental gel surface for the growth of bacteria on foods. Food Microbiol. 14:303-311. [Google Scholar]
- 4.Budde, B. B., and M. Jakobsen. 2000. Real-time measurement of the interaction between single cells of Listeria monocytogenes and nisin on a solid surface. Appl. Environ. Microbiol. 66:3586-3591. [DOI] [PMC free article] [PubMed] [Google Scholar]
- 5.Conner, D. E., V. N. Scott, and D. T. Bernard. 1990. Growth inhibition and survival of Listeria monocytogenes as affected by acidic conditions. J. Food Prot. 53:652-655. [DOI] [PubMed] [Google Scholar]
- 6.Cotter, P. D., C. G. M. Gahan, and C. Hill. 2000. Analysis of the role of the Listeria monocytogenes F0F1-ATPase operon in the acid tolerance response. Int. J. Food Microbiol. 60:137-146. [DOI] [PubMed] [Google Scholar]
- 7.Cotter, P. D., C. G. M. Gahan, and C. Hill. 2001. A glutamate decarboxylase system protects Listeria monocytogenes in gastric fluid. Mol. Microbiol. 40:465-475. [DOI] [PubMed] [Google Scholar]
- 8.Davis, M. J., P. J. Coote, and C. P. O'Byrne. 1996. Acid tolerance in Listeria monocytogenes: the adaptive acid tolerance response (ATR) and growth-phase-dependent acid resistance. Microbiology 142:2975-2982. [DOI] [PubMed] [Google Scholar]
- 9.Dinnbier, U., E. Limpinsel, R. Schmid, and E. P. Bakker. 1988. Transient accumulation of potassium glutamate and its replacement by trehalose during adaptation of growing cells of Escherichia coli K-12 to elevated sodium chloride concentrations. Arch. Microbiol. 150:348-357. [DOI] [PubMed] [Google Scholar]
- 10.Farber, J. M., and P. I. Peterkin. 1991. Listeria monocytogenes, a food-borne pathogen. Microbiol. Rev. 55:476-511. [DOI] [PMC free article] [PubMed] [Google Scholar]
- 11.Fraser, K. R., D. Harvie, P. J. Coote, and C. P. O'Byrne. 2000. Identification and characterization of an ATP-binding cassette l-carnitine transporter in Listeria monocytogenes. Appl. Environ. Microbiol. 66:4696-4704. [DOI] [PMC free article] [PubMed] [Google Scholar]
- 12.Gerhardt, P. N. M., L. T. Smith, and G. M. Smith. 1996. Sodium-driven, osmotically activated glycine betaine transport in Listeria monocytogenes membrane vesicles. J. Bacteriol. 178:6105-6109. [DOI] [PMC free article] [PubMed] [Google Scholar]
- 13.Gerhardt, P. N. M., L. T. Smith, and G. M. Smith. 2000. Osmotic and chill activation of glycine betaine porter II in Listeria monocytogenes membrane vesicles. J. Bacteriol. 182:2544-2550. [DOI] [PMC free article] [PubMed] [Google Scholar]
- 14.Jakobsen, M., O. Filtenborg, and F. Bramsnaes. 1972. Germination and outgrowth of the bacterial spore in the presence of different solutes. Lebensm.-Wiss. Technol. 5:159-162. [Google Scholar]
- 15.Johnson, J. L., M. P. Doyle, and R. G. Cassens. 1990. Listeria monocytogenes and other Listeria spp. in meat and meat products-a review. J. Food Prot. 53:81-91. [DOI] [PubMed] [Google Scholar]
- 16.Jordan, S. L., J. Glover, L. Malcolm, F. M. Thomson-Carter, I. R. Booth, and S. F. Park. 1999. Augmentation of killing of Escherichia coli O157 by combinations of lactate, ethanol, and low-pH conditions. Appl. Environ. Microbiol. 65:1308-1311. [DOI] [PMC free article] [PubMed] [Google Scholar]
- 17.Jørgensen, L. V., and H. H. Huss. 1998. Prevalence and growth of Listeria monocytogenes in naturally contaminated seafood. Int. J. Food Microbiol. 42:127-131. [DOI] [PubMed] [Google Scholar]
- 18.Loncarevic, S., E. Bannerman, J. Bille, M.-L. Danilesson-Tham, and W. Tham. 1998. Characterization of Listeria strains isolated from soft and semi-soft cheeses. Food Microbiol. 15:521-525. [Google Scholar]
- 19.Lyytikäinen, O., T. Autio, R. Maijala, P. Ruutu, T. Honkanen-Buzalski, M. Miettinen, M. Hatakka, J. Mikkola, V. Anttila, T. Johansson, L. Rantala, T. Aalto, H. Korkeala, and A. Siitonen. 2000. An outbreak of Listeria monocytogenes serotype 3a infections from butter in Finland. J. Infect. Dis. 181:1838-1841. [DOI] [PubMed] [Google Scholar]
- 20.McClure, P. J., T. A. Roberts, and P. O. Oguru. 1989. Comparison of the effects of sodium chloride, pH and temperature on the growth of L. monocytogenes on gradient plates and in liquid medium. Lett. Appl. Microbiol. 9:95-99. [Google Scholar]
- 21.O'Driscoll, B., C. G. M. Gahan, and C. Hill. 1996. Adaptive acid tolerance in Listeria monocytogenes: isolation of an acid-tolerant mutant which demonstrates increased virulence. Appl. Environ. Microbiol. 62:1693-1698. [DOI] [PMC free article] [PubMed] [Google Scholar]
- 22.Shabala, L., B. Budde, T. Ross, H. Siegumfeldt, and T. McMeekin. 2001. Responses of Listeria monocytogenes to acid stress and glucose availability monitored by measurements of intracellular pH and viable counts. Int. J. Food Microbiol. 75:89-97. [DOI] [PubMed] [Google Scholar]
- 23.Siegumfeldt, H., K. Rechinger, and M. Jakobsen. 1999. Use of fluorescence ratio imaging for intracellular pH determination of individual bacterial cells in mixed cultures. Microbiology 145:1703-1709. [DOI] [PubMed] [Google Scholar]
- 24.Tapia de Daza, M. S., Y. Villegas, and A. Martinez. 1991. Minimal water activity for growth of Listeria monocytogenes as affected by solute and temperature. Int. J. Food. Microbiol. 14:333-337. [DOI] [PubMed] [Google Scholar]
- 25.Verheul, A., E. Glaasker, B. Poolman, and T. Abee. 1997. Betaine and l-carnitine transport by Listeria monocytogenes Scott A in response to osmotic signals. J. Bacteriol. 179:6979-6985. [DOI] [PMC free article] [PubMed] [Google Scholar]
- 26.Vindeløv, J., and N. Arneborg. 2002. Saccharomyces cerevisiae and Zygosaccharomyces mellis exhibit different hyperosmotic shock responses. Yeast 19:429-439. [DOI] [PubMed] [Google Scholar]
- 27.Walker, S. J., P. Archer, and J. G. Banks. 1990. Growth of Listeria monocytogenes at refrigeration temperatures. J. Appl. Bacteriol. 68:157-162. [DOI] [PubMed] [Google Scholar]
- 28.Wilson, P. D. G., T. F. Brocklehurst, S. Arino, D. Thuault, M. Jakobsen, M. Lange, J. Farkas, J. W. T. Wimpenny, and J. F. Van Impe. 2002. Modelling microbial growth in structured foods: towards a unified approach. Int. J. Food Microbiol. 73:275-289. [DOI] [PubMed] [Google Scholar]
- 29.Wood, J. M. 1999. Osmosensing by bacteria: Signals and membrane-based sensors. Microbiol. Mol. Biol. Rev. 63:230-262. [DOI] [PMC free article] [PubMed] [Google Scholar]


