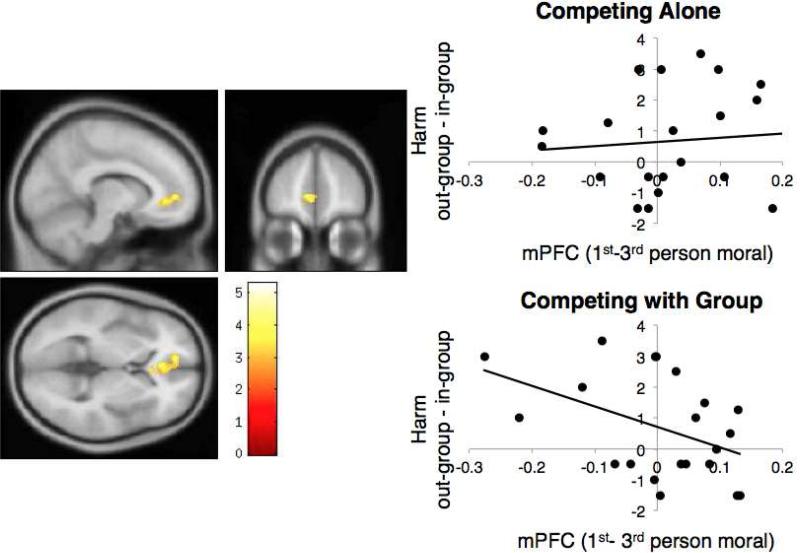
Fig. 2.
Left panel: Group mPFC ROI, based on self>other contrast in the localizer experiment (peak: −4, 34, −4, k = 377). Top right panel: correlation between spontaneous mPFC response to self>other moral behavior and willingness to harm competitors when competing alone, r(19) = .09, p = ns. Bottom panel: significant negative correlation between spontaneous mPFC response to self>other moral behavior and willingness to harm competitors when competing with the group, r(19) = −.44, p < .05.

