Abstract
To determine the mechanism by which sucrose slows in vitro actin sliding velocities, V, we used stopped flow kinetics and a single molecule binding assay, SiMBA. We observed that in the absence of ATP, sucrose (880 mM) slowed the rate of actin-myosin (A-M) strong binding by 71 ± 8% with a smaller inhibitory effect observed on spontaneous rigor dissociation (21 ± 3%). Similarly, in the presence of ATP, sucrose slowed strong binding associated with Pi release by 85 ± 9% with a smaller inhibitory effect on ATP-induced A-M dissociation, kT (39 ± 2%). Sucrose had no noticeable effect on any other step in the ATPase reaction. In SiMBA, sucrose had a relatively small effect on the diffusion coefficient for actin fragments (25 ± 2%), and with stopped flow we showed that sucrose increased the activation energy barrier for A-M strong binding by 37 ± 3%, indicating that sucrose inhibits the rate of A-M strong binding by slowing bond formation more than diffusional searching. The inhibitory effects of sucrose on the rate of A-M rigor binding (71%) are comparable in magnitude to sucrose’s effects on both V (79 ± 33% decrease) and maximal actin-activated ATPase, kcat, (81 ± 16% decrease), indicating that the rate of A-M strong bond formation significantly influences both kcat and V.
INTRODUCTION
Muscle contraction is generated through the A-M ATPase cycle (Fig. 1 A), which modulates A-M affinity between weak- and strong-binding states. A-M binding occurs first through a weak-binding equilibrium, KWS, followed by strong bond formation, kSB (Fig. 1 A). But because the techniques used herein are only sensitive to strong bond formation, in our analysis we assume that A-M strong binding occurs as a single step having an effective rate constant katt(+ATP) = KWS·kSB (Fig. 1 A). During muscle contraction, A-M strong bond formation is associated with a myosin lever arm rotation and phosphate, Pi, release (1–3). This mechanochemical step is the molecular mechanism for force generation in muscle (1, 4–6) and is thought to be rate-limiting for actin-activated ATPase activity (7). A-M strong binding can also occur in the absence of nucleotide, and again here we assume in our analysis a single rigor-binding step having an effective rate constant katt(−ATP) (Fig. 1 B). A-M detachment occurs upon ATP binding to myosin with a second-order rate constant kT (Fig. 1 A). In the absence of nucleotide, A-M detachment can occur spontaneously with a rate kdet(−ATP) (Fig. 1 B).
Fig. 1.
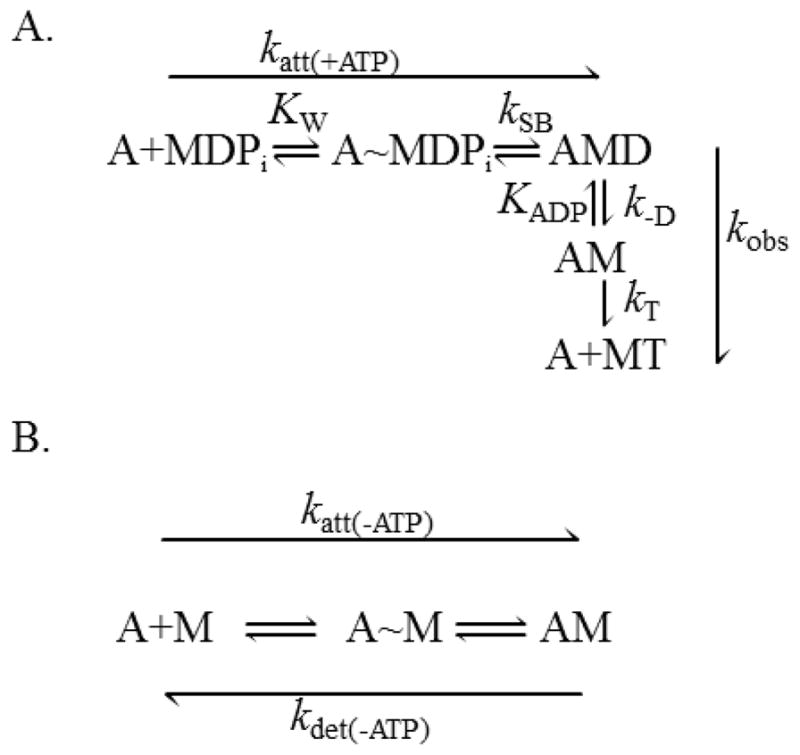
Kinetic schemes of strong A-M binding in the (A) presence and (B) absence of ATP. (A) In the presence of MgATP, A-M strong binding is a two-step process. Weak actin-myosin binding (A~MDPi) is thought to occur rapidly with an equilibrium binding constant KW. Strong A-M binding, with a rate constant kSB, is associated with Pi release and a myosin lever arm rotation. The effective rate constant for this two-step binding reaction is katt(+ATP) = KW·kSB. ADP release from A-M occurs with a rate constant k−D followed by ATP-induced A-M detachment with a second-order rate constant kT. (B) Even in the absence of ATP, A-M strong binding occurs through a two-step reaction with an effective rate constant, katt(−ATP). A-M detachment can occur spontaneously with a rate constant kdet(−ATP). A = actin, D = MgADP, T = MgATP, Pi = phosphate, M = myosin.
Known inhibitors of A-M strong binding such as BTS (N-benzyl-p-toluene sulphonamide), BDM (2,3-butanedione monoxime), and blebbistatin decrease kSB by slowing Pi release (8–10). Specifically, they affect katt(+ATP) (Fig. 1 A) but not katt(−ATP) (Fig. 1 B). In order to determine the effects of strong A-M binding on A-M ATPase biochemistry and mechanics, an inhibitor that specifically slows the rate of A-M strong binding, katt(−ATP), is needed. Here we show that sucrose is such an inhibitor.
Sucrose inhibits the force generated by skinned muscle fibers (11) and slows in vitro actin sliding velocities, V (12). Sucrose has also been used to probe the kinetics of non-muscle myosins (13). For myosin V and VI, De La Cruz and coworkers showed that sucrose slows ADP binding and detachment without affecting the ADP dissociation constant, KADP (Fig. 1 A). Although it has no known physiological significance, sucrose is an accessible, stable, and reversible (14) reagent that is useful for studying the relationship between A-M kinetics and mechanics. To date, the mechanism by which sucrose inhibits muscle contraction and V remains unclear.
Two possible mechanisms for inhibition of muscle mechanics by sucrose are mechanical (viscous) and chemical (ATPase). It has been argued that sucrose does not inhibit V by imposing a mechanical load on the actin filament (8), and data presented herein support this argument (Figs. 2 B and 3). It has also been shown that sucrose has no significant effect on myosin (basal) ATPase activity (9), implying that sucrose does not slow product release in the absence of actin. The effect of sucrose on ATPase activity in the presence of actin has not been previously tested. It has been suggested that sucrose inhibits ADP release from the A-M complex (12). Here we show that sucrose slows katt(−ATP) and to a lesser extent the rate of A-M dissociation without significantly affecting the ADP release rate.
Fig. 2.
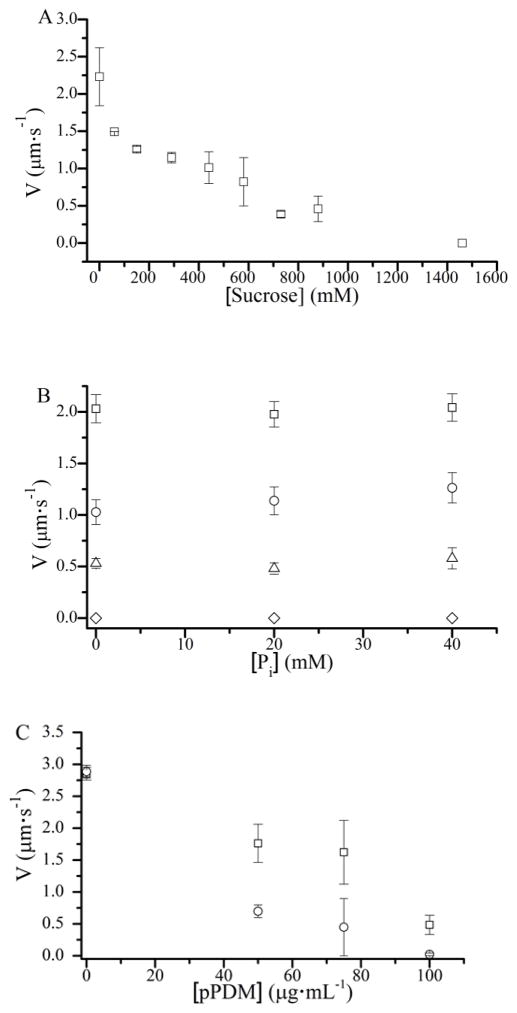
The effects of sucrose and phosphate, Pi, on actin sliding velocities, V. (A) 880 mM sucrose decreased V by 80%. (B) The addition of 20 or 40 mM Pi had no effect on actin sliding velocities at 0 (□), 290 (○), 730 (△), and 1,460 mM (◇) sucrose, indicating that sucrose does not slow V through a mechanical load. (C) pPDM-modified myosin adsorbed to the motility surface imposes a mechanical load that slows V. Increasing pPDM slowed V more in the presence of 30 mM Pi (○) than in the absence of Pi (□), showing that Pi slows motility in the presence of a mechanical load.
Fig. 3.
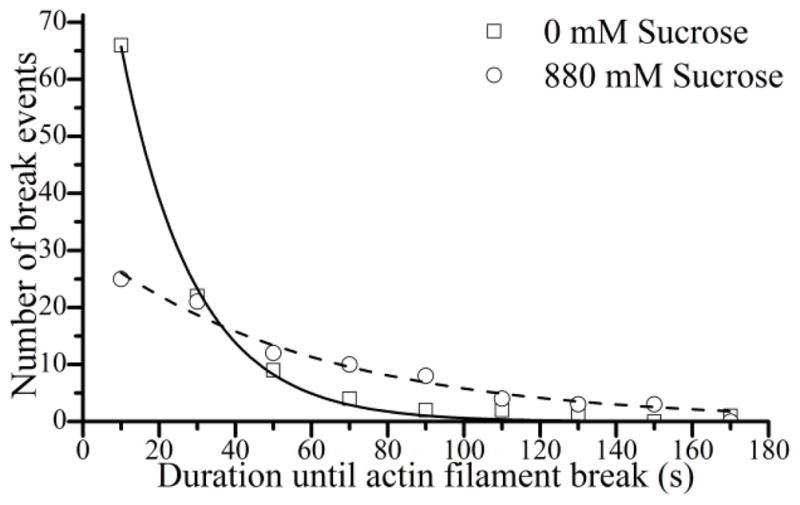
The effects of sucrose on the rate of breaking of actin filaments during a motility assay. The time it takes a given actin filament to break was measured during a motility assay. Approximately 100 measurements under each condition were plotted in a histogram and fit to a single exponential to determine filament breaking rates both in the absence (□, solid line) and presence (○, dashed line) of 880 mM sucrose. Sucrose decreased the rate of breaking from 0.052 to 0.017 s−1.
In this paper, using both single molecule and bulk kinetic assays, we show that 880 mM sucrose inhibits A-M strong binding, slowing both katt(+ATP) (Fig. 1 A) and katt(−ATP) (Fig. 1 B) by 70 – 85%. Sucrose had a relatively small effect on the diffusion coefficient for actin fragments in our single molecule binding assay, SiMBA, and increased the activation energy barrier for A-M strong binding, indicating that sucrose inhibits the rate of A-M strong binding by slowing bond formation more than diffusional searching. The 85% inhibition of A-M binding resembles measured effects of sucrose both on the maximal actin-activated ATPase activity kcat (81%) and on V (79%), indicating that the rate of A-M strong bond formation significantly influences both kcat and V.
MATERIALS AND METHODS
Protein purification
Skeletal muscle myosin was prepared from rabbit psoas muscle as previously described and stored in 50% glycerol at −20°C (15, 16). Subfragment-1 (S1) was prepared by either chymotryptic or papain digestion of myosin (16, 17). A myosin buffer of 300 mM KCl, 25 mM imidazole, 1 mM EGTA, and 4 mM MgCl2 was used to dilute myosin and S1 to experimental concentrations for use in in vitro motility and single molecule binding assays. For transient kinetic experiments, S1 was diluted in 23 mM imidazole (pH 7.4), 85 mM KCl, 5 mM MgCl2, 1 mM DTT, and 1 mM EGTA. Actin was isolated from rabbit psoas muscle and stored on ice at 4°C (18). An actin buffer of 50 mM KCl, 50 mM imidazole, 2 mM EGTA, 8 mM MgCl2, 10 mM DTT, and an oxygen scavenger system (292 mg·mL−1 glucose, 1.63 mg·mL−1 glucose oxidase, and 2.25 mg·mL−1 catalase) was used to dilute actin used in motility and single molecule assays.
Motility assay
For in vitro motility assays, actin was incubated with a 1:1 molar ratio of TRITC (tetramethylrhodamine) phalloidin (Sigma-Aldrich, St. Louis, MO USA) overnight at 4°C. In vitro motility experiments with whole myosin were performed as previously described, except here we ignored in our analysis actin trajectories shorter than 3 μm (19). Each point is a minimum of three experiments from the same myosin preparation. A sucrose stock was made from reagent grade sucrose (Sigma-Aldrich, St. Louis, MO USA) to a stock concentration of 2.34 M. Motility buffer contained 50 mM KCl, 50 mM imidazole, 2 mM EGTA, 8 mM MgCl2, 10 mM DTT, 0 – 880 mM sucrose, 1 mM MgATP, and 0.5% methylcellulose. The macroscopic viscosities of motility buffers at different sucrose concentrations without methylcellulose were measured with a rotational viscometer (DV-E, BYK Additives & Instruments, Wallingford, CT USA) and were consistent with published CRC values (20).
Breaking assay
In order to measure the rate of breaking of moving actin filaments in the motility assay, we performed breaking assays. Breaking assays were performed under the same conditions as motility assays. Actin filament breaking was measured as described previously (21). Data were analyzed using Image J (NIH, Bethesda, MD). The time it took for a filament to break, Tbreak, was calculated from the filament’s origin, which is defined as either the initial frame the filament was completely visible in the field of view, the frame it entered the field of view, or the frame in which it broke from a longer filament. Tbreak values were then plotted in a histogram and fit to a single exponential equation using Origin software (Origin Lab Corporation, North Hampton, MA) to determine the breaking rate with and without 880 mM sucrose (Fig. 3). For each condition, three to five experiments were performed from which a total of between 86 and 107 events were counted.
Single molecule binding assay (SiMBA)
SiMBA is a modified landing assay (22, 23) developed to determine A-M binding and dissociation kinetics under in vitro motility conditions. In SiMBA, actin fragments bind and dissociate from single S1 molecules bound to a coverslip. The duration of A-M binding was measured to determine the rate of A-M detachment, kdet (Fig. 1 B). The duration of free actin diffusion (limited to two-dimensions with methylcellulose) was measured to determine the rate of A-M attachment, katt. Actin was mixed with equimolar phalloidin-Alexa-488 (Invitrogen, Carlsbad, CA USA) and incubated overnight at 4°C. SiMBA experimental buffer was the same as our motility buffer, only it contained 1% methylcellulose and no or low MgATP as specified. Papain S1 (1 μg·mL−1) was applied to a glass slide in a flow chamber and incubated on ice for 20 min. Bovine serum albumin (Sigma-Aldrich, St. Louis, MO USA) at 1 mg·mL−1 in actin buffer was then incubated for the same time under the same conditions to block the glass surface. Alexa-488-labeled actin (10 nM) in motility buffer was sonicated briefly using a sonicator (Model 100 Sonic Dismembrator, Fisher Scientific, Waltham, MA USA) on ice until mean fragment lengths were ~1 μm. Actin fragment lengths and S1 surface density were adjusted to maximize single molecule interactions observed as swiveling actin fragments on S1 and minimize actin binding to multiple S1 observed as stuck fragments. Actin fragments were visualized with a TIRF microscope (488 nm excitation laser, Nikon TE-2000U, Technical Instruments, Burlingame, CA USA) and movies were recorded with a CCD (B-512, Roper Scientific, Tucson, AZ USA). Actin fragment trajectories were recorded over the course of 3 min in a single field (51 μm × 51 μm). Three distinct modes were observed: non-specific binding, binding to S1, or diffusing in 2D (detached from S1). Actin fragments that remained bound to the surface over the course of the entire movie were considered to be nonspecifically bound to the surface and were not counted. Actin fragments that remained relatively stationary (< 300 nm motion) on the surface (bound) for more than 2 frames (> 0.20 sec) but eventually detached were counted as binding events and the frames for the bound event were counted. Unbound events were those in which actin fragments either entered the field moving (> 1 μm) and eventually bound or moved between bound events within the field. The frequency of binding events in control experiments (no S1) was approximately 10% of the number observed in our S1 experiments. For 100 to 400 binding events gathered from a minimum of 5 experiments, we measured the durations of bound (Ton) and dissociated (i.e. diffusing) (Toff) actin fragments and plotted these values in histograms. We fitted the histograms to single exponentials to obtain bound (τon) and detached (τoff) lifetimes from which we calculated kdet (τon−1) and ρ·katt (τoff −1), where ρ is the effective S1 concentration in SiMBA.
Stopped flow fluorimetry
F-actin was labeled with pyrene and stabilized with phalloidin (24). Kinetic experiments, besides the varying temperature experiments, were performed at 25°C in 23 mM imidazole (pH 7.4), 85 mM KCl, 5 mM MgCl2, 1 mM DTT, and 1 mM EGTA with a Hi-Tech SF-61 DX2 stopped-flow spectrophotometer equipped with a 100-watt mercury-xenon lamp and an excitation monochromator. Pyrene-actin fluorescence was excited at 365 nm and emission was detected after passing through a KV-399 cut-off filter. All of the transients shown are an average of 4 – 7 shots and all reported protein and ligand concentrations are the final, post-mixed values. For A-M binding experiments (Fig. 7, A and B), 0.25 μM S1 was rapidly mixed with 0.25 – 8 μM pyrene-actin and transients were fit to a single exponential to determine katt(−ATP). For A-M dissociation experiments (Fig. 8 A), 0.5 μM S1 and 0.5 μM pyrene-actin were preincubated for 5 – 10 min were rapidly mixed with 25 μM unlabeled actin (25). Transients were fit to a single exponential to determine kdet(−ATP). For ATP-induced A-M dissociation experiments (Fig. 8 B), 0.5 μM pyrene actin, 0.6 μM S1, and 0 – 400 μM MgADP were rapidly mixed with 40 μM MgATP (10) and the transients were fit to a single exponential to determine kobs (Fig. 1 A). Here all protein, ligand, and sucrose concentrations refer to concentrations in the stopped flow chamber after mixing. In all sucrose experiments, sucrose concentrations were identical in both syringes.
Fig. 7.
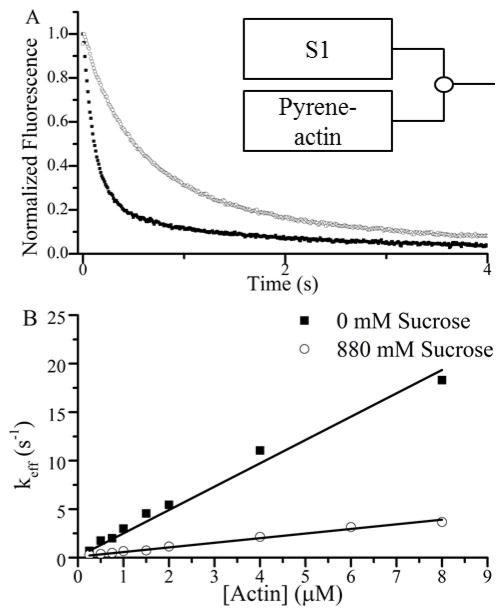
The effects of sucrose on A-M rigor binding kinetics measured using stopped flow. (A) Representative fluorescence transients following rapid mixing of 0.75 μM pyrene-actin with 0.25 μM S1 (final concentrations) at 0 (■) and 880 (○) mM sucrose. (B) Single exponential fits of approximately 15 fluorescence transients averaged together from three different experiments gave a keff for each actin concentration. The [A]-dependence of keff is described by the equation (24). We observe a linear relationship out to the highest [A] used, indicating that under these conditions, [A] < 1/Kw, and keff = KW·kSB· [A] = katt(−ATP) · [A]. Thus rate constants for A-M binding, katt(−ATP) were obtained from the slope of a linear fit (line) to the data in Fig. 7 B, setting the y-intercept to kdet(−ATP) = 0.11 s−1 obtained in Fig. 8 A.
Fig. 8.
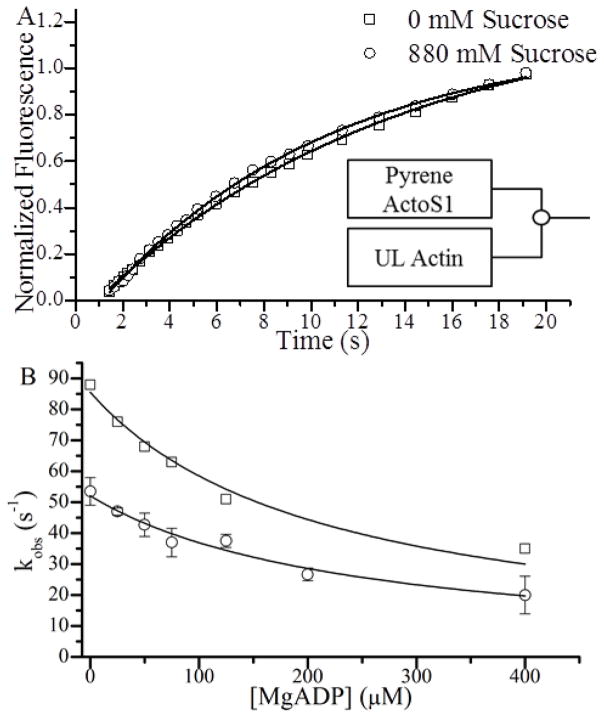
The effects of sucrose on A-M detachment kinetics measured using stopped flow fluorimetry. (A) Normalized fluorescence transients following rapid mixing of 0.5 μM S1 and 0.5 μM pyrene actin against 25 μM (final concentrations) unlabeled actin (UL) in the presence (○) and absence (□) of 880 mM sucrose here shown with every 10th point plotted. Single exponential fits (lines) yielded kdet(−ATP) values of 0.13 and 0.11 s−1 for 0 and 880 mM sucrose respectively. (B) ATP-induced A-M dissociation transients were obtained when 0.5 μM pyrene actin, 0.5 μM S1, and the indicated [MgADP] were rapidly mixed with 40 μM MgATP (final concentrations) both in the presence (○) and absence (□) of 880 mM sucrose. Values for kobs at each [MgADP] were obtained from single exponential fits to approximately ten transients obtained from two experiments and were plotted. These plots were fitted to Eq. 1 to obtain values for kT and KADP that are summarized in Table 1.
Steady-state actin-activated S1 ATPase assay
Actin-activated S1 ATPase assays were performed at 30°C as previously described (26). A buffer solution containing 50 mM KCl, 50 mM imidazole, 2 mM EGTA, and 8 mM MgCl2 was used. Reaction time points were quenched with 3% sodium citrate so that colorimetric measurements could be made at 2 min intervals over the course of 12 min after initial mixing of chymotryptic S1, phalloidin stabilized F-actin, and ATP. The intensity of the malachite green (27) was measured in a SpectraMax M5 microplate reader (Molecular Devices, Sunnyvale, CA USA). After averaging triplicate points from two experiments, the data were fit to the Michaelis-Menten equation to determine kcat and Km values.
RESULTS
Sucrose slows V but not through a viscous drag on actin filaments
We used an in vitro motility assay with skeletal myosin to confirm the effects of sucrose on actin sliding velocities, V. Fig. 2 A shows that V decreases with sucrose in a concentration-dependent manner by up to 80% (from 2.1 ± 0.3 to 0.43 ± 0.18 μm·sec−1) at 880 mM sucrose. To determine whether or not the viscosity of the sucrose-containing motility buffers contributes to slowing V, we took advantage of the phenomenon that Pi inhibits loaded but not unloaded muscle shortening velocities (28). Like in muscle, we have observed that in an in vitro motility assay, Pi inhibits loaded but not unloaded velocities (data not shown). Figure 2 B shows that V inhibited by 290, 730, and 1,460 mM sucrose is not further slowed upon addition of 40 mM Pi, suggesting that sucrose does not slow V via a viscous load. To test whether a mechanical load in a motility assay induces Pi-sensitivity, we used surface adsorbed pPDM-modified myosin as a mechanical load. Figure 2C shows that pPDM-modified myosin slows V more in the presence of 30 mM Pi than in the absence, confirming that a mechanical load in a motility assay induces Pi-sensitivity.
In order to further test the hypothesis that sucrose does not impose an external load, we measured the effects of sucrose on the rate of actin filament breaking in an in vitro motility assay (21). Actin filament breaking in a motility assay is associated with forces along an actin filament that slow V (21). Thus if sucrose were slowing V through a viscous load, we would expect an increase in filament breaking upon addition of sucrose. Figure 3 shows histograms of the time it takes a given actin filament to break measured during in vitro motility assays performed both with (circle) and without (square) 880 mM sucrose. Rates for actin filament breaking were obtained from single exponential fits to these histograms, showing that the addition of sucrose decreased the rate of breaking nearly 3-fold (from 0.052 ± 0.002 to 0.017 ± 0.001 s−1, SEM), indicating that sucrose does not slow V through an increased mechanical load or drag but instead slows V through a mechanism that involves inhibition of forces generated on actin filaments.
Sucrose decreases both katt(−ATP) and katt(+ATP) in SiMBA
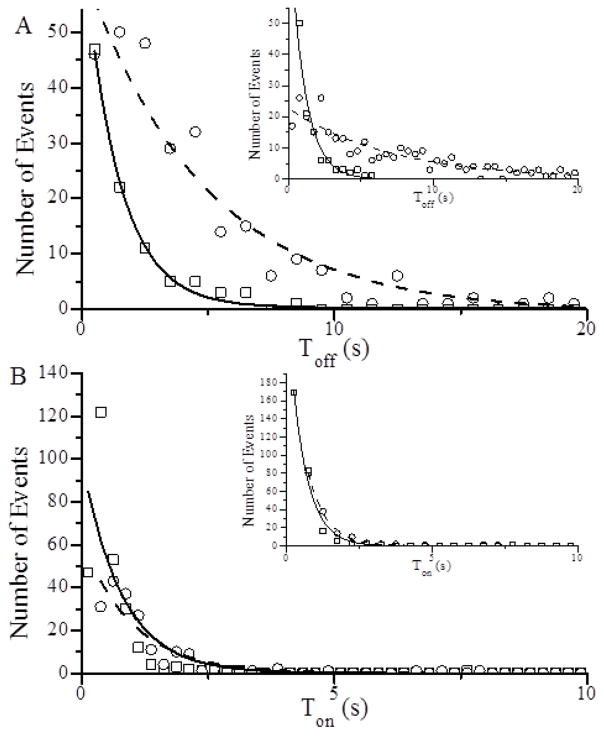
We used SiMBA to determine the effects of sucrose on A-M binding kinetics under in vitro motility conditions. Fig. 4 A shows a histogram of Toff values obtained in the absence of MgATP both with (circles) and without (squares) 880 mM sucrose. These histograms were fitted to single exponentials to determine the lifetime of the detached state, τoff(−ATP), from which A-M binding rates, ρ·katt(−ATP) = τoff(−ATP)−1, were calculated. Here ρ is the effective S1 concentration in SiMBA, which is proportional to the S1 surface density and was held constant in all experiments. The data show that with addition of 880 mM sucrose, ρ·katt(−ATP) decreases 70% (from 0.72 ± 0.02 to 0.21 ± 0.02 s−1), suggesting that sucrose directly inhibits katt(−ATP), since ρ was held constant. These experiments were repeated in the presence of 1 μM MgATP (Fig. 4 A inset) where most A-M binding events are associated with Pi release. Similar to its effect on rigor binding kinetics, 880 mM sucrose slowed ρ·katt(+ATP) by 86% (from 0.97 ± 0.08 to 0.14 ± 0.01 s−1), suggesting that the kinetics that limit rigor bond formation (Fig. 1 B) similarly influence actin-induced Pi release (Fig. 1 A).
Fig. 4.
A-M attachment and detachment kinetics measured using a single molecule binding assay (SiMBA). (A) Durations of actin fragment in the detached state, Toff, and (B) durations of actin fragment in the attached state, Ton, were measured and plotted in histograms, and fitted to single exponentials both with (○, dashed line) and without (□, solid line) 880 mM sucrose. Single exponential fits to these histograms gave (A) attachment (ρ·katt) and (B) detachment (kdet) rates both in the presence (inset) and absence of 1 μM MgATP. Results are summarized in Table 1.
Sucrose decreases kdet(−ATP) in SiMBA
To determine the effects of sucrose on A-M detachment kinetics, we used SiMBA to measure durations, Ton, of actin fragments bound to S1 affixed to a coverslip surface. In Fig. 4 B, Ton values obtained in the presence (circles) and absence (squares) of 880 mM sucrose are plotted in a histogram and fitted to single exponentials (lines) to determine A-M bound lifetimes, τon, and A-M detachment rates, kdet = τon−1. The addition of 880 mM sucrose decreased kdet(−ATP) by 21% (from 1.27 ± 0.15 to 1.0 ± 0.1 s−1). These experiments were repeated in the presence of 1 μM ATP (Fig. 4 B inset), where the addition of 880 mM sucrose decreased the A-M detachment rate 13% (from 1.81 ± 0.06 to 1.57 ± 0.04 s−1). These data show that sucrose inhibits A-M dissociation both in the presence and absence of ATP, but the magnitude of the effect was much smaller than the > 70% reduction of katt(−ATP) and katt(+ATP).
Sucrose has a minimal effect on the diffusion coefficient of actin fragments
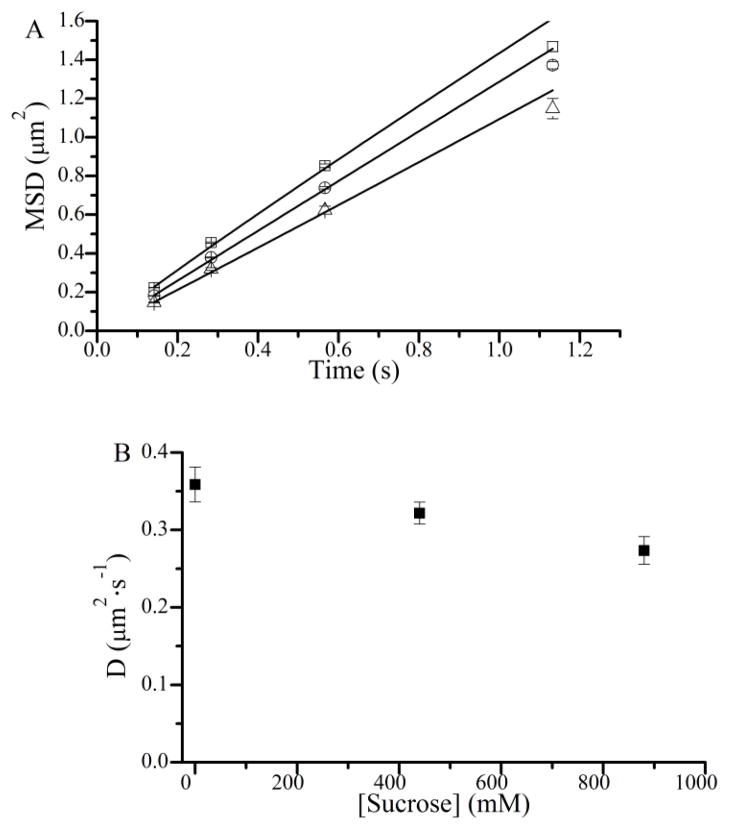
Inhibition of katt by sucrose (Fig. 4 A) might result from sucrose slowing the diffusion of actin fragments. To test this possibility, the same SiMBA assay used to measure sucrose effects on katt(−ATP) was used to determine the effects of sucrose on the diffusion coefficient, D, of actin fragments. Fig. 5 A shows mean squared displacements, MSD, (29) of ~ 1 μm actin fragments obtained at 0 (open squares), 440 (open circles), and 880 (open triangles) mM sucrose. Diffusion coefficients (D) were obtained from fits of these data to the equation MSD = 2·D·tα and are plotted in Fig. 5 B. Alpha values of approximately 1 were obtained from all fits, indicating that the actin fragments were undergoing free diffusion (30). These data show that the diffusion coefficient, D, for actin fragments in SiMBA decreased by 25% (Table 1) upon addition of 880 mM sucrose, indicating that the 70 – 80% decrease in katt(−ATP) with addition of sucrose results primarily from slowing a non-diffusive component of katt.
Fig. 5.
The effects of sucrose on the diffusion coefficient of actin fragments in SiMBA. (A) Mean squared displacements (MSD) from over 300 actin fragment trajectories were measured at different time windows for 0 (□), 440 (○), and 880 (△) mM sucrose. (B) Diffusion coefficients were determined at each sucrose concentration by fitting the MSD data to 2Dtα and plotted. D = diffusion coefficient, t = time, α = alpha coefficient. Results are summarized in Table 1.
Table 1.
Summary of kinetic parameters measured from in vitro motility, actin-activated S1 ATPase, single molecule binding, and stopped-flow spectroscopy assays.
| Kinetic parameters with and without sucrose
| ||
|---|---|---|
| Sucrose: | 0 mM | 880 mM |
| V, μm·s−1 | 2.05 ± 0.3 (3) | 0.43 ± 0.2 (3) |
| D actin, μm2·s−1 | 0.72 ± 0.02 | 0.54 ± 0.02 |
| kcat*, min−1 | 75 ± 13 (2) | 15 ± 1 (2) |
| Km *, μM | 33 ± 2 (2) | 9 ± 1 (2) |
| ρ·katt(−ATP) †, s−1 | 0.72 ± 0.02 | 0.21 ± 0.02 |
| ρ·katt(+ATP) †, s−1 | 0.97 ± 0.08 | 0.14 ± 0.01 |
| katt(−ATP) ‡, μM−1·s−1 | 2.41 ± 0.08 | 0.48 ± 0.01 |
| kdet(−ATP) ‡, s−1 | 0.13 ± 0.06 (2) | 0.11 ± 0.03 (2) |
| kdet(−ATP) †, s−1 | 1.3 ± 0.2 | 1.0 ± 0.1 |
| kT ‡, μM−1·s−1 | 2.1 ± 0.1 | 1.3 ± 0.1 |
| KADP ‡, μM | 217 ± 30 | 244 ± 33 |
| Ea(att) ‡, kJ·mol−1 | 50 ± 2 | 68 ± 5 |
| Ea(det) ‡, kJ·mol−1 | 24 ± 3 | 28 ± 3 |
Steady-state ATPase assays performed at 700 mM sucrose.
SiMBA
Stopped-Flow
N values are in parenthesis.
Errors with (N) are ± SD. All other errors are SEM to a fit.
Sucrose decreases kcat and has minimal effects on Km
To determine the effects of sucrose on A-M ATPase kinetics, we measured actin-activated S1 ATPase activity both with and without sucrose. Figure 6 shows that the addition of 790 mM sucrose reduces the maximum actin-activated ATPase rate, kcat, 80% (from 75 ± 13 to 15 ± 1 min−1) and decreases Km from 33 ± 2 to 9 ± 1 μM. The 80% decrease in kcat with sucrose correlates with the 86% inhibition of katt(+ATP) by sucrose, suggesting that A-M strong binding significantly influences kcat. The decrease in Km might result from sucrose slowing detachment kinetics and implies that sucrose does not decrease weak-binding affinity, KW.
Fig. 6.
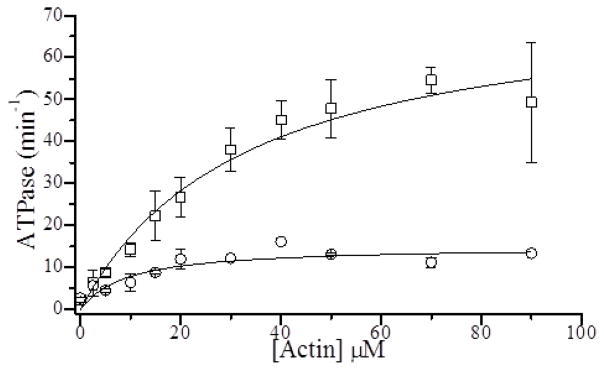
The effects of sucrose on actin-activated S1 ATPase activity. The rate of Pi release during an ATPase reaction was measured in a colorimetric assay at the indicated actin concentrations both with and without 700 mM sucrose and plotted. These data were fitted to the Michaelis-Menten equation to obtain values for the maximum actin-activated ATPase activity, kcat, and the Km. The basal ATPase was 2.4 and 2.7 min−1 for 0 and 880 mM sucrose. In the absence of sucrose (□) we measured a kcat of 75 min−1 and Km of 33 μM. In the presence of 700 mM sucrose (○), we measured a kcat of 15 min−1 and a Km of 9 μM.
Sucrose slows katt(−ATP) in bulk solution
To verify the effects of sucrose on ρ·katt(−ATP) measured with SiMBA, we used stopped flow fluorimetry to measure the effects of sucrose on the rate constant, katt(−ATP), for A-M rigor binding in solution. Fig. 7 A shows the effects of sucrose on a representative fluorescence transient following rapid mixing of pyrene actin and S1. Fluorescence transients were fitted to single exponentials to obtain binding rate constants, keff, and in Fig. 7 B values for keff obtained at different actin concentrations both with (circles) and without (squares) 880 mM sucrose are plotted. Rate constants, katt(−ATP), for A-M binding were obtained from the slopes of linear fits to these plots, showing that 880 mM slows katt(−ATP) by 80% (from 2.41 ± 0.08 to 0.48 ± 0.01 μM−1·s−1) consistent with SiMBA results.
Sucrose slows kdet(−ATP) in bulk solution
To confirm the effects of sucrose on kdet(−ATP) in SiMBA, we used stopped flow to measure the corresponding effects in bulk solution. Figure 8 A shows fluorescence transients obtained both with (open circles) and without (open squares) 880 mM sucrose following rapid mixing of pyrene-actin-S1 with excess unlabeled actin. These transients were fitted to single exponentials to determine kdet(−ATP), showing that 880 mM sucrose slows kdet(−ATP) by 15% (from 0.13 ± 0.06 to 0.11 ± 0.03 s−1).
Sucrose decreases kT but has little effect on KADP in bulk solution studies
Under physiological conditions it is difficult to measure the effects of sucrose on ATP-induced A-M detachment kinetics because fast skeletal muscle myosin A-M detachment rates are too fast to measure using stopped flow. We observed no effect of 880 mM sucrose on fluorescence transients following rapid mixing of pyrene actin + S1 + 200 μM MgADP with 1 mM MgATP, suggesting that sucrose does not slow detachment kinetics enough to make the A-M detachment rate measurable (data not shown).
For fast skeletal muscle myosin, non-physiological conditions (low [MgATP], low [MgADP], and low temperature) are typically used to estimate detachment kinetic parameters. To determine the effects of sucrose on ATP-induced A-M dissociation kinetics (Fig. 1 A), we used stopped flow to measure fluorescence transients at different [MgADP] following rapid mixing of S1 + pyrene actin with 40 μM MgATP. ATP-induced fluorescence transients were fitted to single exponentials to determine kobs at different [MgADP] both with (Fig. 8 B, open circle) and without (Fig. 8 B, open square) 880 mM sucrose. The data in Fig. 8 B were fitted to the equation (10)
| Eq. 1 |
to determine values for the ADP dissociation constant, KADP, and the ATP-induced A-M detachment rate constant, kT (Fig. 1 A). 880 mM sucrose slows kT by 40% (from 2.14 ± 0.06 to 1.30 ± 0.03 μM−1·s−1) and has little effect on KADP (Table 1).
Sucrose inhibits Vmax without significantly altering the detachment kinetics underlying V
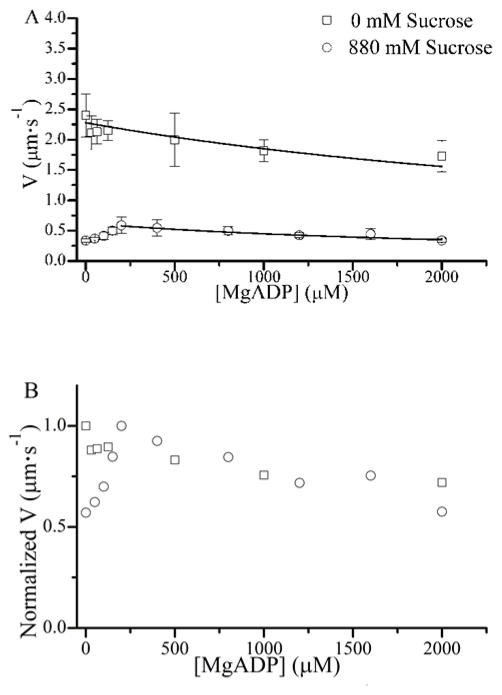
Figure 9 A shows the effects of sucrose on the ADP-dependence of V, measured using an in vitro motility assay. In the absence of sucrose (open squares) ADP slows V through product inhibition of τon as previously described (31), and our data in Fig. 9 A are accurately described by the equation:
| Eq. 2 |
where Vmax is the maximum sliding velocity and k−D is the ADP release rate. The right side of this equation describes the effects of A-M detachment kinetics on V. Fitting the data in Fig. 9 A to Eq. 2, using the corresponding KD and kT values determined from stopped flow (Table I), the fitted value for Vmax decreased by 70% (2.3 to 0.69 μm·s−1) and k−D increased (86 ± 24 and 123 ± 26 s−1) with 880 mM sucrose. These k−D estimates are low relative to published values, presumably because the value for kT used in our motility analysis was estimated from stopped flow and is lower than kT values estimated from in vitro motility experiments.
Fig. 9.
The effects of [MgADP] on actin sliding velocities, V. (A) We used an in vitro motility assay to measure the velocity, V, of actin filament sliding over a bed of full length skeletal muscle myosin at 1 mM MgATP and the indicated [MgADP] both with (□) and without (○) 880 mM sucrose. Plots of V versus [MgADP] were fitted (lines) to Eq. 2, using values for kT and KADP in Table I. The sucrose data obtained below 200 mM MgADP was excluded from this fit. (B) Data obtained in the presence of sucrose was multiplied by 4, consistent with the 4-fold decrease in Vmax observed upon addition of 880 mM sucrose. Both datasets were normalized to Vmax in the absence of sucrose.
With 880 mM sucrose, the ADP-dependence of V exhibits two different phases. The recovery of V observed with addition of up to 200 μM MgADP (Fig. 9 A) presumably results from an increased number of actin-bound myosin heads engaging actin with the myosin surface to overcome the diffusive component of katt (Fig. 5). The inhibition of V observed above 200 μM MgADP results from the kdet-dependence of V, illustrated in Fig. 9 B, with the normalization of the two datasets to each other. These results show that sucrose inhibits Vmax without significantly altering the detachment kinetics underlying V (31). The 71% decrease in Vmax correlates with an ~80% reduction in the rates for both maximal actin-activated ATPase and strong A-M binding observed upon addition of 880 mM sucrose, suggesting that the kinetics of A-M strong binding significantly influence V (32).
Sucrose significantly increases Ea for strong binding but not for rigor detachment
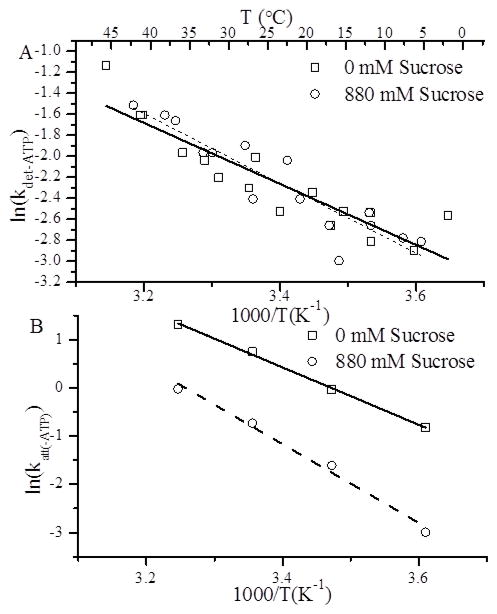
Consistent with the relatively small inhibitory effect on kdet(−ATP), we observe that sucrose has little effect on the activation energy, Ea(det), for rigor detachment (from 24 ± 3 to 28 ± 3 kJ·mol−1) (Fig. 10 A). In contrast, 880 mM sucrose increased the activation energy barrier for rigor strong binding, Ea(att), (from 49 ± 2 to 68 ± 5 kJ·mol−1) consistent with our observation that sucrose significantly inhibits katt(−ATP) through a non-diffusive mechanism (Fig. 10 B).
Fig. 10.
The effects of temperature on (A) kdet(−ATP) and (B) katt(−ATP). (A) Fluorescence transients were obtained following rapid mixing of 0.5 μM S1 + 0.5 μM pyrene actin with 25 μM unlabeled actin both in the presence (○) and absence (□) of 880 mM sucrose. Approximately 4–7 transients were fitted to single exponentials to obtain values for kdet(−ATP). These experiments were repeated at different temperatures and ln(kdet(−ATP)) values were plotted versus inverse temperature in an Arrhenius plot. The slope of linear fits to these plots gave values for the activation energy, Ea, and showed that sucrose had no significant effect on Ea (see Table I). (B) Fluorescence transients (~4–7) following rapid mixing of 0.25 μM S1 with different concentrations of pyrene actin were fitted to single exponentials to obtain keff· katt(−ATP) was obtained from the slope of the [A]-dependence of keff as previously described (Fig. 7 B). These experiments were repeated at different temperatures, and the temperature-dependence of katt(−ATP) was plotted in Arrhenius plots (see above), showing that sucrose increases Ea for A-M strong binding (see Table I).
DISCUSSION
In this paper, we show that the primary mechanism by which sucrose slows ATPase kinetics and actin sliding velocities, V, is inhibition of A-M strong binding, katt. Muscle contraction is generated through the A-M strong binding transition (Fig. 1 A), which occurs with Pi release and a discrete rotation of myosin’s lever arm domain. Inhibitors of this mechanochemical step have proven useful for studying basic mechanisms of muscle contraction. Small molecule inhibitors of strong A-M binding, such as BDM, BTS, and blebbistatin (8–10) inhibit katt(+ATP) and myosin ATPase without affecting katt(−ATP). In contrast, here we show that sucrose inhibits katt(−ATP) without affecting myosin (basal) ATPase (12). Sucrose is the first (but probably not the only) effector of katt(+ATP) to be shown to exhibit this mechanism and as discussed below may provide an important tool for studying the effects of strong bond formation on A-M ATPase kinetics and muscle mechanics.
Sucrose has little effect on detachment kinetics at physiological conditions
From stopped flow experiments performed at low [ATP], we estimated that sucrose has little effect on the MgADP dissociation constant, KADP, and inhibits kT by less than 40%. The lack of an effect of sucrose on KADP = k−D/k+D suggests that sucrose affects neither rate constant or that sucrose affects both rate constants proportionally (13). Sucrose inhibition of kT results either from sucrose decreasing the rate of MgATP binding (possibly by slowing MgATP diffusion) or from sucrose decreasing the rate of A-M detachment following MgATP binding. In either case, at saturating MgATP the effect of sucrose on kT has little influence on τon (31) and thus accounts for neither the observed 80% inhibition of V nor the observed 80% inhibition of kcat.
Mechanism by which sucrose inhibits A-M strong binding
Our results indicate that sucrose has a relatively small effect on the diffusion of actin filaments (Fig. 5), and that the primary mechanism by which sucrose inhibits katt (Figs. 4 A and 7 B) is through slowing A-M strong bond formation. This would be especially true in muscle and in vitro motility where contributions of the diffusive component of katt are minimized by the fixed, close proximity of actin and myosin. Observations that sucrose increases the activation energy barrier for A-M strong binding (Fig. 10 B) and that sucrose does not increase the Km for actin-activated ATPase (Fig. 6) support a conclusion that sucrose inhibits katt by slowing A-M strong bond formation. We can think of no mechanism by which sucrose would bind specific sites on actin or myosin to inhibit A-M binding, and thus we propose that the effects of sucrose on A-M binding are non-specific, much like kinetic effects of ionic strength, pH, or temperature. However, unlike these non-specific effectors, which typically alter multiple steps in the actin-myosin ATPase cycle, sucrose appears to primarily affect A-M strong binding. Because A-M binding is thought to be associated with significant redistribution of waters from the binding interface (33), desolvation is one mechanism by which sucrose might be altering the A-M binding landscape. However, the effects of sucrose on protein-protein interactions can be complex (34), and so in this paper we focus on the kinetic rather than physical-chemical effects of sucrose.
A-M strong binding kinetics, katt(−ATP), influences kcat
A-M strong binding accelerates Pi release from myosin, and so it is not surprising that slowing the kinetics of A-M strong bond formation slows kcat and possibly Pi release. The observation that inhibition of Pi release (by BDM, blebbistatin, BTS) and inhibition of A-M strong binding (by sucrose) both slow katt(+ATP) supports the idea that Pi release and A-M strong binding are tightly coupled. These studies do not rule out the possibility that Pi release precedes A-M strong binding, and sucrose can be used to test this hypothesis. Specifically, stopped flow fluorimetry can be used to measure the rate, k−Pi, of Pi release, and an observation that sucrose slows katt(+ATP) but not k−Pi would indicate Pi release precedes A-M strong binding. An observation that sucrose similarly inhibits both katt(+ATP) and k−Pi would indicate that Pi release and A-M strong binding are inextricably coupled.
The kinetics of A-M strong binding, katt(−ATP), influence actin sliding velocities, V
Conventional models of muscle contraction posit that V = d/τon, where d is the mechanical step generated by the lever arm rotation of a myosin head, and τon is the lifetime of A-M strong binding (35, 36). Using an in vitro motility assay to determine the effects of Pi and blebbistatin (a small molecule inhibitor of Pi release) on V (19), we previously demonstrated a correlation between the kinetics of Pi release and V. In this paper, our observation that sucrose has a large and proportional effect on both V and katt(−ATP) but relatively small effects on the kinetic parameters that determine τon suggest a link between the kinetics of strong A-M binding and V (Figs. 2 A, 7 B, and 8).
Consistent with solution kinetic studies, our in vitro motility data (Fig. 9) suggest that sucrose does not affect the detachment kinetics underlying V. The right side of Eq. 2 describes the effects of A-M detachment kinetics on V (31). In essence, it describes the shape of the ADP-dependence of V shown in Fig. 9. The left side of Eq. 2 describes the amplitude of these curves. We observed that sucrose slows Vmax by approximately 4-fold, and when we multiple the sucrose data by this factor (Fig. 9 B), the two curves (above the 200 mM MgADP needed to fully engage actin filaments with the motility surface) resemble each other, implying that sucrose inhibits Vmax (left side of Eq. 2) and not detachment kinetics (right side of Eq. 2). This kinetic analysis of our in vitro motility data is consistent with both SiMBA and stopped flow experiments and implies that Vmax is influenced by katt (19, 36).
The hypothesis that sucrose affects Vmax through attachment kinetics is supported by the observed effects of sucrose on actin dynamics and mechanics in the motility assay. When V is slowed through inhibition of detachment kinetics (e.g., at low [MgATP]) or by increased mechanical loads (e.g., in the presence of an alpha-actinin load), the frequency of actin filament breaking increases and actin filaments become less dynamic (21). In contrast when V is slowed through inhibition of attachment kinetics (e.g., upon addition of blebbistatin), the frequency of actin filament breaking decreases, and actin filaments become more dynamic. In the in vitro motility assay, we observed that upon addition of sucrose actin filament dynamics increased (data not shown) and the frequency of actin filament breaking decreased (Fig. 3).
The effects of katt on Vmax can be understood by considering that decreasing katt has the same effect on the A-M binding rate, r, as decreasing myosin density, ρ (i.e., r = ρ·katt). Not surprisingly, the effects of decreasing katt on motility resemble those observed when ρ is decreased. Specifically, decreasing ρ in a motility assay increases actin dynamics, decreases actin filament breaking, and results in a sub-saturating Vmax that is influenced by detachment kinetics. What remains to be determined is why inhibition of Vmax resulting from a decrease in katt cannot be recovered by increasing ρ (12, 19). We are currently investigating this phenomenon, and our preliminary data suggests that V cannot be recovered by increasing ρ because actin-myosin binding saturates with incubation of approximately 50 μg·ml−1 myosin.
A comparison of single molecule and bulk kinetic parameters
We have used both single molecule (SiMBA) and bulk (stopped-flow) kinetic measurements to determine the effects of sucrose on the rate constants for A-M attachment and detachment. In general, the magnitude of the sucrose effect is comparable between the two methods; however, in certain cases the absolute values of kinetic parameters differ. The rate of A-M binding in the absence of nucleotide measured in SiMBA was ρ·katt(−ATP) = 0.7 s−1 and the rate measured in stopped flow was katt(−ATP) = 2.4 μM−1·s−1. The ratio of these two measurements gives an effective S1 concentration in the SiMBA assay of ρ = 290 nM.
If actin-myosin weak-binding is in a rapid equilibrium and the subsequent strong binding transition is irreversible (Fig. 1A), the effective actin-myosin binding rate constant is katt = KW · kSB. The relationship between katt, KW, and kSB in single molecule binding studies is less clear. The first step in A-M binding is weak-binding which occurs with a rate constant, k+W. Once in the weak state, the probability that myosin undergoes a strong binding transition is kSB/(k−W + kSB), where k−W is the rate constant for dissociation from the weak state. Thus katt = k+W · (kSB/(k−W + kSB)), which when k−W ≫ kSB approaches katt = kSB·(k+W/k−W) = KW · kSB, and so KW and kSB have the same effect on katt values obtained from both single molecule and bulk kinetic experiments. Both SiMBA and stopped flow studies show that sucrose inhibits katt, but neither technique can directly show whether the mechanism is a decrease in KW, inhibition of kSB, or both. Our observations that sucrose has a relatively small effect on the diffusion coefficient for actin fragments in SiMBA and that sucrose increases the activation energy for katt indicates that sucrose slows katt through a mechanism other than diffusion. The observation that sucrose inhibits kcat in our actin-activated ATPase experiments suggests that sucrose inhibits kSB. The observation that sucrose causes a slight increase in Km suggests that sucrose does not inhibit KW.
The rate of spontaneous A-M dissociation, kdet(−ATP) was ~10-fold faster in SiMBA than in stopped flow. Possible reasons for this difference include i) the degrees of freedom of the A-M complex are more limited in SiMBA than in solution and ii) cooperative effects that exist in solution experiments but do not exist in SiMBA due to its 1:1 filament:S1 stoichiometry.
Conclusions
Sucrose inhibits A-M ATPase activity and actin sliding velocities by slowing katt(+ATP). The observation that sucrose specifically inhibits A-M strong bond formation, katt(−ATP), suggests that sucrose may be useful for determining the relationship between A-M strong binding, muscle mechanics, and A-M ATPase kinetics.
Acknowledgments
Grants: 5P20RR018751, 1R21AR055749, and 1R01HL090938(JEB) and AR040917 (CRC). Thanks to Karolina Balkenbush, Alan Stickney, and Patricia Ellison for contributing experimental assistance and to Kevin Facemyer for helpful discussions.
Footnotes
Publisher's Disclaimer: This is a PDF file of an unedited manuscript that has been accepted for publication. As a service to our customers we are providing this early version of the manuscript. The manuscript will undergo copyediting, typesetting, and review of the resulting proof before it is published in its final citable form. Please note that during the production process errors may be discovered which could affect the content, and all legal disclaimers that apply to the journal pertain.
References
- 1.Lymn RW, Taylor EW. Mechanism of adenosine triphosphate hydrolysis by actomyosin. Biochemistry. 1971;10:4617–24. doi: 10.1021/bi00801a004. [DOI] [PubMed] [Google Scholar]
- 2.Goldman YE. Kinetics of the actomyosin ATPase in muscle fibers. Annu Rev Physiol. 1987;49:637–54. doi: 10.1146/annurev.ph.49.030187.003225. [DOI] [PubMed] [Google Scholar]
- 3.Cooke R. Actomyosin interaction in striated muscle. Physiol Rev. 1997;77:671–97. doi: 10.1152/physrev.1997.77.3.671. [DOI] [PubMed] [Google Scholar]
- 4.Huxley HE. The mechanism of muscular contraction. Science. 1969;164:1356–65. (80-) [PubMed] [Google Scholar]
- 5.Huxley AF. Muscular contraction. J Physiol. 1974;243:1–43. [PMC free article] [PubMed] [Google Scholar]
- 6.Baker JE, Brust-Mascher I, Ramachandran S, LaConte LE, Thomas DD. A large and distinct rotation of the myosin light chain domain occurs upon muscle contraction. Proc Natl Acad Sci U S A. 1998;95:2944–9. doi: 10.1073/pnas.95.6.2944. [DOI] [PMC free article] [PubMed] [Google Scholar]
- 7.Stein La, Greene LE, Chock PB, Eisenberg E. Rate-limiting step in the actomyosin adenosinetriphosphatase cycle: studies with myosin subfragment 1 cross-linked to actin. Biochemistry. 1985;24:1357–63. doi: 10.1021/bi00327a013. [DOI] [PubMed] [Google Scholar]
- 8.Kovács M, Tóth J, Hetényi C, Málnási-Csizmadia A, Sellers JR. Mechanism of blebbistatin inhibition of myosin II. J Biol Chem. 2004;279:35557–63. doi: 10.1074/jbc.M405319200. [DOI] [PubMed] [Google Scholar]
- 9.Ostap EM. 2,3-Butanedione monoxime (BDM) as a myosin inhibitor. J Muscle Res Cell Motil. 2002;23:305–8. doi: 10.1023/a:1022047102064. [DOI] [PubMed] [Google Scholar]
- 10.Shaw MA, Ostap EM, Goldman YE. Mechanism of inhibition of skeletal muscle actomyosin by N-benzyl-p-toluenesulfonamide. Biochemistry. 2003;42:6128–35. doi: 10.1021/bi026964f. [DOI] [PubMed] [Google Scholar]
- 11.Chase PB, Denkinger TM, Kushmerick MJ. Effect of viscosity on mechanics of single, skinned fibers from rabbit psoas muscle. Biophys J. 1998;74:1428–38. doi: 10.1016/S0006-3495(98)77855-5. [DOI] [PMC free article] [PubMed] [Google Scholar]
- 12.Chase PB, Chen Y, Kulin KL, Daniel TL. Viscosity and solute dependence of F-actin translocation by rabbit skeletal heavy meromyosin. Am J Physiol Cell Physiol. 2000;278:C1088–98. doi: 10.1152/ajpcell.2000.278.6.C1088. [DOI] [PubMed] [Google Scholar]
- 13.Robblee JP, Cao W, Henn A, Hannemann DE, De La Cruz EM. Thermodynamics of nucleotide binding to actomyosin V and VI: a positive heat capacity change accompanies strong ADP binding. Biochemistry. 2005;44:10238–49. doi: 10.1021/bi050232g. [DOI] [PubMed] [Google Scholar]
- 14.Ando T, Asai H. The effects of solvent viscosity on the kinetic parameters of myosin and heavy meromyosin ATPase. J Bioenerg Biomembr. 1977;9:283–8. doi: 10.1007/BF00743215. [DOI] [PubMed] [Google Scholar]
- 15.Prochniewicz E, Lowe DA, Spakowicz DJ, Higgins L, O’Conor K, et al. Functional, structural, and chemical changes in myosin associated with hydrogen peroxide treatment of skeletal muscle fibers. Am J Physiol Cell Physiol. 2008;294:C613–26. doi: 10.1152/ajpcell.00232.2007. [DOI] [PMC free article] [PubMed] [Google Scholar]
- 16.Margossian SS, Lowey S. Preparation of myosin and its subfragments from rabbit skeletal muscle. In: Colowick SP, Kaplan NO, editors. Methods in Enzymology. New York: Academic Press; 1982. pp. 55–71. [DOI] [PubMed] [Google Scholar]
- 17.Weeds AG, Taylor RS. Separation of subfragment-1 isoenzymes from rabbit skeletal muscle myosin. Nature. 1975;257:54–56. doi: 10.1038/257054a0. [DOI] [PubMed] [Google Scholar]
- 18.Pardee JD, Spudich JA. Purification of muscle actin. Methods Enzymol. 1982;85:164–181. doi: 10.1016/0076-6879(82)85020-9. [DOI] [PubMed] [Google Scholar]
- 19.Hooft AM, Maki EJ, Cox KK, Baker JE. An accelerated state of myosin-based actin motility. Biochemistry. 2007;46:3513–20. doi: 10.1021/bi0614840. [DOI] [PubMed] [Google Scholar]
- 20.CRC Handbook of Chemistry and Physics. 64. CRC Press; 1984. [Google Scholar]
- 21.Stewart TJ, Jackson DR, Jr, Smith RD, Shannon SF, Cremo CR, et al. Actin sliding velocities are influenced by the driving forces of actin-myosin binding. Cell Mol Bioeng. 2013;6:26–37. doi: 10.1007/s12195-013-0274-y. [DOI] [PMC free article] [PubMed] [Google Scholar]
- 22.Hancock WO, Howard J. Processivity of the motor protein kinesin requires two heads. J Cell Biol. 1998;140:1395–405. doi: 10.1083/jcb.140.6.1395. [DOI] [PMC free article] [PubMed] [Google Scholar]
- 23.Mizuno N, Toba S, Edamatsu M, Watai-Nishii J, Hirokawa N, et al. Dynein and kinesin share an overlapping microtubule-binding site. EMBO J. 2004;23:2459–67. doi: 10.1038/sj.emboj.7600240. [DOI] [PMC free article] [PubMed] [Google Scholar]
- 24.Criddle AH, Geeves MA, Jeffries T. The use of actin labelled with N-(1-pyrenyl)iodoacetamide to study the interaction of actin with myosin subfragments and troponin/tropomyosin. Biochem J. 1985;232:343–9. doi: 10.1042/bj2320343. [DOI] [PMC free article] [PubMed] [Google Scholar]
- 25.De La Cruz EM, Ostap EM. Kinetic and equilibrium analysis of the myosin ATPase. 1. Elsevier Inc; 2009. [DOI] [PMC free article] [PubMed] [Google Scholar]
- 26.Trybus KM. Biochemical studies of myosin. Methods. 2000;22:327–35. doi: 10.1006/meth.2000.1085. [DOI] [PubMed] [Google Scholar]
- 27.Henkel RD, VandeBerg JL, Walsh RA. A microassay for ATPase. Anal Biochem. 1988;169:312–318. doi: 10.1016/0003-2697(88)90290-4. [DOI] [PubMed] [Google Scholar]
- 28.Cooke R, Pate E. The effects of ADP and phosphate on the contraction of muscle fibers. Biophys J. 1985;48:789–98. doi: 10.1016/S0006-3495(85)83837-6. [DOI] [PMC free article] [PubMed] [Google Scholar]
- 29.Qian H, Sheetz MP, Elson EL. Single particle tracking. Analysis of diffusion and flow in two-dimensional systems. Biophys J. 1991;60:910–21. doi: 10.1016/S0006-3495(91)82125-7. [DOI] [PMC free article] [PubMed] [Google Scholar]
- 30.Nelson SR, Ali MY, Trybus KM, Warshaw DM. Random Walk of Processive, Quantum Dot-Labeled Myosin Va Molecules within the Actin Cortex of COS-7 Cells. Biophys J. 2009;97:509–518. doi: 10.1016/j.bpj.2009.04.052. [DOI] [PMC free article] [PubMed] [Google Scholar]
- 31.Baker JE, Brosseau C, Joel PB, Warshaw DM. The biochemical kinetics underlying actin movement generated by one and many skeletal muscle myosin molecules. Biophys J. 2002;82:2134–47. doi: 10.1016/S0006-3495(02)75560-4. [DOI] [PMC free article] [PubMed] [Google Scholar]
- 32.Bárány M. ATPase activity of myosin correlated with speed of muscle shortening. J Gen Physiol. 1967;50(Suppl):197–218. doi: 10.1085/jgp.50.6.197. [DOI] [PMC free article] [PubMed] [Google Scholar]
- 33.Takács B, O’Neall-Hennessey E, Hetényi C, Kardos J, Szent-Györgyi AG, et al. Myosin cleft closure determines the energetics of the actomyosin interaction. FASEB J. 2011;25:111–21. doi: 10.1096/fj.10-164871. [DOI] [PMC free article] [PubMed] [Google Scholar]
- 34.Frederick KB, Sept D, De La Cruz EM. Effects of solution crowding on actin polymerization reveal the energetic basis for nucleotide-dependent filament stability. J Mol Biol. 2008;378:540–50. doi: 10.1016/j.jmb.2008.02.022. [DOI] [PMC free article] [PubMed] [Google Scholar]
- 35.Huxley AF, Simmons RM. Proposed mechanism of force generation in striated muscle. Nature. 1971;233:533–538. doi: 10.1038/233533a0. [DOI] [PubMed] [Google Scholar]
- 36.Yengo CM, Takagi Y, Sellers JR. Temperature dependent measurements reveal similarities between muscle and non-muscle myosin motility. J Muscle Res Cell Motil. 2012 doi: 10.1007/s10974-012-9316-7. [DOI] [PMC free article] [PubMed] [Google Scholar]


