

Abstract
Recent studies have illustrated that motion-related artifacts remain in resting-state fMRI (rs-fMRI) data even after common corrective processing procedures have been applied, but the extent to which head motion distorts the data may be modulated by the corrective approach taken. We compare two different methods for estimating nuisance signals from tissues not expected to exhibit BOLD fMRI signals of neuronal origin: 1) the more commonly used mean signal method and 2) the principal components analysis approach (aCompCor: Behzadi et al., 2007). Further, we investigate the added benefit of “scrubbing” (Power et al., 2012) following both methods. We demonstrate that the use of aCompCor removes motion artifacts more effectively than tissue-mean signal regression. In addition, inclusion of more components from anatomically defined regions of no interest better mitigates motion-related artifacts and improves the specificity of functional connectivity estimates. While scrubbing further attenuates motion-related artifacts when mean signals are used, scrubbing provides no additional benefit in terms of motion artifact reduction or connectivity specificity when using aCompCor.
Keywords: Head motion, Resting state fMRI, nuisance regression, specificity
1. Introduction
Resting state functional connectivity (rs-FC) measures the temporal synchrony of spontaneous, low-frequency fluctuations in blood oxygen level dependent (BOLD) signals in functional Magnetic Resonance Imaging (fMRI) and has proven to be a powerful tool to examine the intrinsic functional organization of the brain in health (Barber et al., 2012; Biswal et al., 1995; Fox et al., 2005) and disease (Choe et al., 2013; Repovs et al., 2011; Rombouts et al., 2005). Rs-FC data are known to be contaminated by physiological effects including cardiac and respiratory events as well as other nuisances including the effects of head motion. These sources of nuisance can mimic and/or mask true functional connectivity, and their minimization has been both a point of concern and controversy for rs-FC investigations since their inception (Bianciardi et al., 2009; Biswal et al., 1996; Bright and Murphy, 2012; Carbonell et al., 2011; Lund et al., 2006; Shmueli et al., 2007).
Recent publications have drawn renewed attention to artifacts introduced by participant motion. It has long been recognized that motion-induced variation in the MR time course is a complex function of both past and present head position and that as such, motion-induced artifacts cannot be nullified by simple image realignment (Friston et al., 1996). One important claim of these publications is that small movements previously thought to be innocuous to the MR signal can introduce subtle, systematic effects on rs-FC data that persist even after standard corrective procedures have been applied (Power et al., 2012; Satterthwaite et al., 2012; Van Dijk et al., 2012). Out-of-plane head movements during 2D planar image acquisition are especially problematic as they can cause regions of adjacent slices to be subsequently excited before they have fully recovered; the resulting increase in timeseries variance is referred to as spin history artifact. The relationship between head motion (as measured by framewise displacement (FD)) and percent signal change (as measured by the Derivative of root mean square VARiance over voxelS (DVARS)) can serve as a marker of such nuisances (Hallquist et al., 2013; Power et al., 2014, 2012). One reported manifestation of these insidious motion artifacts on rs-FC metrics is that motion inflates short-range connectivity while weakening long-range connectivity (Power et al., 2012; Satterthwaite et al., 2012). Therefore, motion effects are particularly relevant to investigations of individuals and populations whose in-scanner movement profiles may differ subtly, for instance, when comparing children to adults or individuals experiencing involuntary or repetitive movements, such as tics or tremors, to controls. If not properly accounted for, differences in participant motion may either introduce systematic differences in functional connectivity maps that could be misinterpreted as group differences in functional coupling between regions or reduce the sensitivity of rs-FC to detect real differences in the underlying brain organization (Fair et al., 2013; Van Dijk et al., 2012).
As a result of these findings, workers have begun to investigate the optimization of approaches for mitigating motion-related BOLD effects (Carp, 2013; Hallquist et al., 2013; Jo et al., 2013). All rs-FC studies attempt to account for motion, but the implementation of additional correction methods beyond spatial realignment varies widely. For seed-based rs-FC analyses, linear regression of the translational and rotational realignment parameters from the fMRI signal is fairly standard practice. Applying a temporal filter to constrain the data to frequencies more likely to represent neuronal-related variance is also common (Weissenbacher et al., 2009; Windischberger et al., 2002). However, the number of parameters used in the regression, the cut-off frequencies used for the filter, and even the order in which these processes are applied differ across studies, and it is not fully understood whether all strategies are equally vulnerable to motion-induced artifacts.
Since the original reports of the lingering effect of motion, simple simulations and re-analysis of published results have suggested that small alterations in image processing may have a substantial impact on the extent to which rs-FC analyses are corrupted by motion (Carp, 2013; Hallquist et al., 2013; Jo et al., 2013). Including the temporal derivatives and quadratic terms of the realignment estimates in the confound model to account for delayed and non-linear motion-induced spin history effects appears to diminish motion-induced artifacts in resting state data (Satterthwaite et al., 2013; Yan et al., 2013). Discarding problematic volumes (scan “scrubbing”), or alternatively including spike regressors to act as catch-alls for non-linear and non-quadratic spin history effects at these problematic time points provides further defense from motion-induced artifacts. However, results have been mixed as to whether any of these participant-level motion correction approaches completely remove inter-individual differences in motion-related MR signal changes (Jo et al., 2013; Power et al., 2014, 2012; Satterthwaite et al., 2013; Yan et al., 2013).
Nuisances in rs-FC data can also be mitigated by including additional regressors in the confound model from tissues not expected to exhibit BOLD fMRI signals, namely white matter (WM) and cerebral spinal fluid-filled spaces (CSF). Methods for estimating these tissue-based nuisance regressors have been introduced, but their effectiveness at mitigating motion-induced artifacts has not been rigorously compared. To date, all of the research examining the effects of motion on seed-based rs-FC has included mean signals from WM and CSF as nuisance regressors (Hallquist et al., 2013; Jo et al., 2013; Power et al., 2012; Satterthwaite et al., 2013, 2012; Yan et al., 2013); in some cases, the first derivative of each tissue-based regressor was also included (Power et al., 2014; Satterthwaite et al., 2013). This mean signal approach is fairly common as it does not require external measures of physiological activity or motion and is publically available as part of the Neuroimaging Informatics Tools and Resources Clearinghouse (NITRC) 1000 Functional Connectomes processing scripts (Biswal et al., 2010) and the Data Processing Assistant for Resting-State fMRI (Yan and Zang, 2010).
An alternative approach is to estimate spatially coherent noise components in these same tissues using principal component analysis (Behzadi et al., 2007). While not explicitly introduced for motion correction, it was originally suggested that this method, referred to as anatomical CompCor or aCompCor, may help minimize the effects of head displacements, in addition to accounting for cardiac and respiratory fluctuations (Behzadi et al., 2007). Motion artifacts corrupt large portions of the affected images; however, their effects are not spatially uniform (Satterthwaite et al., 2013; Yan et al., 2013). For example, motion may cause a positive deflection in the time-course of some voxels, but a negative deflection in the time-course of spatially disparate voxels. Signal averaging across voxels introduces the risk that spatially disparate nuisance signals might cancel one another out; a potential strength of aCompCor is that it can identify multiple nuisance signals from WM and CSF thereby reducing this risk. Another benefit of aCompCor is that it does not make assumptions about the relationship between the source of noise and the resulting change in MR signal, potentially making it easier to account for delayed and non-linear effects of motion. Previous research utilizing the anatomy of known functional networks to estimate the specificity of functional connectivity following preprocessing has also suggested that aCompCor preserves signals of interest better than other nuisance removal strategies (Chai et al., 2012). Yet to date, the effectiveness of aCompCor in mitigating motion artifacts has not been investigated.
Our chief objective was to compare aCompCor to the more commonly used mean tissue-based nuisance regression method and to scan scrubbing. We evaluated the effectiveness of each processing strategy to minimize the framewise relationship between head motion and signal change. We also assessed the effect of each processing strategy on functional connectivity metrics using the known anatomy of the default mode and motor control networks.
2. Materials and Methods
2.1 Participants
One hundred and thirty typically developing (TD) children, mean (SD) age 10.2 (±1.2) years, participated in this study. Written consent was obtained from a parent or legal guardian and verbal assent was obtained from the participating child. This study was approved by the Johns Hopkins Medicine Institutional Review Board. Participants were recruited from local schools, community centers, pediatricians’ offices, and Kennedy Krieger Institute (KKI) through advertisements and by word of mouth. All children were screened for developmental or psychiatric disorders using the Diagnostic Interview for Children and Adolescents-IV (Welner et al., 1987). A subset of the data were used in earlier studies examining motor network connectivity (Barber et al., 2012; Nebel et al., 2012) and developmental changes in FC (Barber et al., 2013).
2.2 Data acquisition
Imaging data were collected using a Philips Achieva 3T scanner (Philips Medical Systems, Best, The Netherlands). All functional scans were obtained using a 2D-SENSE EPI sequence (TR/TE = 2500/30 ms, flip angle = 70°, SENSE acceleration factor of 2, 47 contiguous ascending 3-mm slices per TR with an in-plane resolution of 3.05 × 3.15 –mm [84 × 81 voxels]) and either an 8-channel head coil (N=127) or a 32-channel head coil (N=3). The scanning times were 5 min 20 s (N=42), 6 min 30 s (N=59), or 6 min 45 s (N=1) for one run collected in one session. A high resolution MPRAGE was obtained with 1×1×1-mm3 resolution, TR/TE = 8.0/3.7 ms to assist with registration of the functional images to a standard space.
2.3 Data preprocessing
All preprocessing was done using SPM8 (http://www.fil.ion.ucl.ac.uk/spm) and custom MATLAB (The Mathworks, Natick, Massachusetts, USA) scripts. A full view of the processing stream can be seen in Figure 1.
Figure 1.

Processing Stream. The components of the processing stream are broken up horizontally by standard fMRI preprocessing steps (pre-FCP) and FC preprocessing steps, and vertically by actions performed on functional data (left), anatomical data (middle), and derived metrics for analysis (right). Standard fMRI preprocessing steps included slice time adjustment, motion realignment, and spatial normalization (using unified segmentation-normalization). The 6 (x, y, z, roll, pitch, yaw) motion parameters estimated from realignment were condensed into one per-scan measure: framewise displacement (FD). After temporally detrending the functional data, we trifurcated our FC pipeline to evaluate the attenuation of motion effects using three nuisance regression models: MeanWC, aCompCor, and aCompCor50. These models differed in the way that nuisance signals from white matter (WM) and cerebrospinal fluid (CSF) were estimated; the mean signals (MeanWC), the top 5 principal components (PCs) (aCompCor), or the minimal number of PCs that explained at least 50% of the variance (aCompCor50) from WM and CSF were included in the regression, with signals from WM and CSF being estimated separately for each method. The data were then spatially smoothed and bandpass filtered (.01–.1Hz pass-band). DVARS was calculated and FD/DVARS Pearson correlations were estimated using the pre and post-FCP data. Scans with FD > .5mm were regarded as potentially motion-contaminated. One scan prior and 2 scans after these identified scans, including the scan itself, were ignored from correlations and timecourses to generate “scrubbed” data. Timecourses from seeds within the Default Mode network and somatomotor network were extracted, and mPFC and M1 specificity were calculated.
2.3.1 fMRI preprocessing
The first four volumes of each run were discarded at the time of acquisition to allow for magnetization stabilization. The data were slice-time adjusted using the slice that was acquired at the middle of the TR (slice 24 of 47). Rigid body realignment parameters were estimated with respect to the first (stabilized) functional scan of the run, producing the motion parameters described in section 2.4.1 Metric of Motion below. Anatomical images were registered to the first (stabilized) functional volume and spatially normalized to the Montreal Neurological Institute (MNI) template using SPM8’s unified segmentation-normalization procedure (Ashburner and Friston, 2005). The estimated rigid body and non-linear spatial realignment transformations were then applied to the functional data in one step and resulted in 2-mm isotropic voxels. To insure the consistency of spatial normalization across participants, we visually spot-checked registration to MNI space at a series of landmarks representing the anterior, posterior, inferior, superior, and lateral extremes of the brain in SPM’s T1 template. Data at this point in the pipeline will be referred to as pre-FCP (pre-Functional Connectivity Processing) data, as no FC processing has been done, and will be used to measure differences pre- and post-FC processing.
2.3.2 Functional connectivity processing
Each resting state scan was temporally detrended on a voxelwise basis to remove linear trends. At this point, we trifurcated our processing pipeline to evaluate the attenuation of motion effects using three nuisance regression models. All three models included linearly detrended versions of the six rigid body realignment parameters, the first derivative of each realignment parameter (computed by backward differences), and representative signals of no interest from white matter (WM) and cerebral spinal fluid (CSF). The three models differed in the way that signals from white matter and CSF were estimated, but the same spatial masks were used to isolate signals from these regions for all three models. Subject-specific tissue probability maps generated during SPM’s unified segmentation-normalization process were restricted using a 99% probability threshold. To further reduce the risk of capturing signals of interest from adjacent grey matter voxels, the resulting WM mask was eroded using MATLAB’s imerode function, and the CSF mask was constrained to areas within the ALVIN mask of the ventricles (Kempton et al., 2011). Figure 2 illustrates the frequency across participants with which voxels were included in these subject-specific tissue masks. Using these restricted masks, we examined the following strategies:
Figure 2.

Frequency maps for voxel inclusion in tissue-based nuisance masks. The base image is the grey matter tissue prior from SPM8. The intensity of the overlays reflects the number of subjects for which each voxel was included in either the white matter (WM, green) or CSF (red) mask used to estimate nuisance signals. Subject-specific masks were generated by restricting tissue probability maps from SPM’s unified segmentation normalization process using a 99% probability threshold. To further reduce the risk of capturing signals of interest from adjacent grey matter voxels, the resulting WM mask was eroded using MATLAB’s imerode function, and the CSF mask was constrained to areas within the ALVIN mask of the ventricles (Kempton et al., 2011).
MeanWC: included Mean timecourses from WM and CSF
aCompCor: included the top five principal components (PCs) from WM and the top five from CSF
aCompCor50: included enough PCs to explain 50% of the variance in WM and 50% of the variance in CSF.
This differs from the approaches taken by Satterthwaite et al. (2013) and Yan et al. (2013), both of which investigated the efficacy of including an increasing number of regression parameters derived from the whole-brain motion estimates while always including mean signals from WM and CSF. The MeanWC strategy is similar to the RegBp approach in Hallquist et al. 2013; however, slightly different criteria were used for identifying WM and CSF in that case. In their original paper, Behzadi et al. (2007) used a Monte Carlo simulation to generate a null distribution of expected principal values derived from normally distributed data of rank equal to the covariance matrix of signals from white matter and CSF voxels. Principal values computed from the observed covariance matrix that were significantly larger than the generated distribution, as assessed using a two-tailed t-test (p < .05), were retained. Based on this method, Behzadi et al (2007) included an average of 6.3 ± 0.52 principal components from white matter and CSF. FCP method #2 (aCompCor) was based on the findings of a follow-up paper by Chai et al (2011) which examined the optimal number of principal components to include from WM and CSF based on the resulting specificity of connectivity metrics but did not consider the lingering effects of motion. FCP method #3 (aCompCor50) was designed to examine whether a subject-specific criterion for choosing the number of components to include in the nuisance regression model would better mitigate the lingering effects of motion. For the aCompCor approach in this paper, the top 5 PCs explained a mean (SD) of 35.7% (12.9%) of the variance for WM and 70.0% (.10%) for CSF. For aCompCor50, the mean (SD) number of PCs needed to explain 50% variance of the signal was 17.9 (9.8) for WM and 3.0 (1.1) for CSF. Following nuisance regression, the data were spatially smoothed using a 6-mm FWHM Gaussian kernel. Temporal bandpass filtering was then applied to constrain signals between .01 and.1Hz.
2.4 Data analyses
All analyses were implemented using the R statistical language (http://www.R-project.org/). Data were visualized using Mango (http://ric.uthscsa.edu/mango/index.html), the ggplot2 package (Wickham, 2009) and 3D Slicer (Fedorov et al., 2012).
2.4.1 Metric of head motion
For each functional run, the six rigid body realignment parameters estimated by SPM were condensed into a scalar time course of head motion referred to as Framewise Displacement (FD) (Power et al., 2012). FD was calculated by summing the absolute value of the three differenced (time t – time t−1) translational realignment parameters and the three differenced rotational parameters, which were converted from radians to millimeters by assuming a brain radius of 50 mm (Power et al., 2012). The mean FD over the whole scan was also calculated for each participant.
Using an FD threshold of .5 mm, potentially motion-contaminated scans were identified, and a temporal mask was created for each subject excluding one scan before and 2 scans after each FD spike above this threshold (Power et al., 2012). For example, if FD for one participant exceeded .5 mm for scans 5, 10, and 40, then scans 4–7, 9–12, and 39–42 would be ignored (i.e. masked out). To compare the additional attenuation of motion-induced effects by scan censoring across FCP strategies, all MR signal change and connectivity metrics were calculated two ways: 1) using all available scans (post-FCP) and 2) using only those scans in this temporal mask (post-FCP+scrubbing). No criterion was set on the number of post-scrubbed scans; we believed that including participants with many scans flagged for motion would allow us to see the largest impact of scrubbing.
2.4.2 Metric of MR signal change
We summarized the magnitude of MR signal change for grey matter as a whole as well as on a region of interest (ROI)-wise basis using the Derivative of root mean square (RMS) VARiance over voxelS (DVARS). The derivative refers to temporally backward-differenced functional images (Power et al., 2012). For global DVARS, the grey matter tissue probability map generated during SPM’s unified segmentation-normalization process was restricted using a 40% probability threshold, and then DVARS was averaged across all voxels above this threshold. Voxels from WM and CSF were excluded from the calculation of global DVARS because DVARS fluctuations in these areas may average out potential artifacts in regions of interest, namely grey matter. For ROI-specific DVARS, DVARS was averaged across all grey matter voxels within each ROI (ROIs described in section 2.4.3). DVARS was always calculated using a subject’s entire timecourse-worth of data, before any scan scrubbing was performed.
2.4.3 ROI definition
Because motion has been shown to have regionally heterogeneous effects on MR signal change and functional connectivity estimates (Power et al., 2012; Satterthwaite et al., 2013; Yan et al., 2013), we used a set of 264 spherical seeds with 6-mm radii defined by J.D. Power and associates to extract time courses of interest and to calculate functional correlations between regions (Power et al., 2011). These seeds represent a relatively comprehensive coverage of the brain, both from a functional and an anatomical viewpoint.
2.4.4 Assessing the mitigation of global head motion-induced signal changes
To evaluate the impact of head motion on MR signal change at different stages of preprocessing, we calculated Pearson’s correlation between FD and global DVARS on pre-FCP and post-FCP data and on pre- and post-scrubbed data. For the post-scrubbing FD-DVARS correlation, neither the FD timecourse nor the DVARS timecourse was recalculated after scans were scrubbed due to excessive head motion. Only the correlation between FD and DVARS was recalculated following scan scrubbing; time points that were flagged as potentially contaminated by motion were ignored from both the FD and DVARS timecourses, so that the correlation between FD and DVARS after scrubbing was based on the same set of time points from each measure. Kernel density estimation (KDE) estimates the shape of a distribution and is roughly similar to a smoothed histogram. We used KDE to visualize how the FD/DVARS distribution changed following the various FC processing strategies as well as post-scrubbing (post-FCP+scrubbing). A linear mixed effects (LME) model was used to test the main fixed effects of and interactions between the following within-subjects factors on the global FD/DVARS relationship using likelihood ratio tests: FCP strategy (3 levels) and scrubbing (2 levels) with a random intercept for participant (Bates et al., 2012). LME models were fit using maximum likelihood. Post-hoc Wilcoxon’s signed-rank tests were used to assess pairwise differences in the distribution of the global FD/DVARS relationship across FCP strategies, with p-values adjusted for multiple comparisons using Bonferroni correction. We corrected for multiple comparisons by inflating the p-values by a factor of 6 for the 6 tests performed: across FCP strategies without scrubbing and within FCP strategy, comparing the results pre- and post-scrubbing, and these adjusted p-values were compared to an α-level of 0.05. Signed-rank tests report a Z-score based on the W statistic, the sum of the positive ranks.
2.4.5 Comparison of global FD/DVARS mitigation in motion subgroups
To compare FCP effectiveness in subjects whose in-scanner movement profiles differed subtly, we divided our sample into low, medium, and high mover subgroups using the tertiles of the mean FD distribution. We focused on comparisons of the low and high motion subgroups. To determine if we observed effects of different processing strategies and scrubbing on the FD/DVARS correlation within motion-determined subgroups, Wilcoxon signed-rank tests were performed within the low and high motion groups separately. To determine if the FD/DVARS correlation was different between high and low movers for any FCP strategy/scrubbing combination, an LME model with a random intercept for participant was fit with a 3-way interaction between motion subgroup (high or low), FCP strategy, and scrubbing. Another LME model was fit with the 2-way interaction of FCP strategy and scrubbing, and a likelihood ratio test was performed on the motion subgroup interaction. Post-hoc Wilcoxon rank-sum tests were performed to determine which strategy/scrubbing combinations were different across the high and low motion subgroups.
2.4.6 Assessing the mitigation of regional variation in FD/DVARS
Expanding on prior demonstrations of regional variation in the impact of motion on MR signal change (Power et al., 2012; Satterthwaite et al., 2013; Yan et al., 2013) and because regional variations may cancel each other out at the global DVARS level, we attempted to characterize how regional variations in the FD/DVARS relationship were affected by FCP strategy and by scrubbing. We first calculated Pearson’s correlations between FD and ROI-wise DVARS (ROI-DVARS) on the pre-FCP data. We used kernel density estimation to visualize this distribution, which allowed us to see differences in the distributions of the FD/DVARS correlations over ROIs. We then applied k-means clustering on the pre-FCP FD/ROI-DVARS correlations to identify seed regions that were differentially impacted by head motion. The 264×130 (ROIs x subjects) matrix of pre-FCP FD/ROI-DVARS correlations were partitioned to minimize the sum, over all clusters, of the within-cluster sums of point-to-cluster-centroid Euclidean distances; missing values were imputed using Matlab’s knnimpute.m, a nearest-neighbor method. The partitioning was repeated 100 times using random initial conditions, where the final solution was the clustering with the lowest within-cluster sum of point-to-centroid Euclidean distances. We searched for two clusters because the distribution of FD/ROI-DVARS correlations by ROI for the pre-FCP data appeared to be bimodal (Figure 6A).
Figure 6.

Distributions of FD/ROI-DVARS correlation by processing strategy and cluster. Kernel Density Estimates (KDEs) of the distributions of the correlations between FD and DVARS for each of the 264 ROIs. Heuristically, all functional connectivity processing resulted in more zero-centered and less-variable distributions compared to the pre-FCP data. Using the pre-FCP data in A), the 264 ROIs were clustered using k-means clustering on the 130 participants’ data. Two clusters were chosen since there appeared to be a bi-modality in the pre-FCP FD/ROI-DVARS distribution. The spatial distribution of the 2 clusters are presented in B), showing that ROIs with higher mean FD/DVARS correlation tended to be closer to the surface.
To corroborate the spatial organization of this bimodal relationship between head motion and MR signal change, we calculated the average Euclidean distance from the center of all seeds in each cluster to the edge of the brain. A mask of outer edge brain voxels was constructed based on SPM’s tissue probability masks for grey matter, WM and CSF. Euclidean distance was then computed between the center of each ROI and each outer edge voxel, and the nearest outer edge voxel was identified by taking the minimum of these distances for each ROI. T-tests were then performed to test whether the minimum distance to outer edge was significantly different for the two clusters.
The mean FD/ROI-DVARS correlations for each cluster were taken as summary measures for each participant. A linear mixed effects model was constructed to test the main effects of and interactions between the following within-subjects factors on the FD/ROI-DVARS relationship using likelihood ratio tests: cluster (2 levels), FCP strategy (3 levels), and scrubbing (2 levels) with a random intercept for participant. Post-hoc Wilcoxon signed-rank tests were performed to further assess differences in group medians under different processing strategies separately for each cluster. We used Bonferroni correction to adjust for 3 tests within cluster and 6 total tests across clusters.
2.4.7 Modulation of motion effects on connectivity by ROI-pair distance
Previous studies have shown that connectivity between pairs of ROIs are differently modulated by head motion, depending on the distance between ROIs (Power et al., 2012; Satterthwaite et al., 2012; Van Dijk et al., 2012) and that this modulation of motion effects by internode distance can be influenced by preprocessing (Power et al., 2014; Satterthwaite et al., 2013). We calculated the group-level correlation between an individual’s mean FD and each ROI-pair’s connectivity score (QC-RSFC). We then estimated the relationship between this measure and ROI-pair distance using a generalized additive model (GAM) and a linear model (Hastie and Tibshirani, 1990). We tested differences in QC-RSFC distance correlations across processing strategies using Williams’ test (Williams, 1959).
2.4.8 Specificity comparison of FCP strategies
The risk of removing signal of interest along with noise increases as potentially more and more data is discarded either by performing additional scan scrubbing or by including more parameters in the nuisance regression model, reducing signal variability. To address this concern, we assessed the specificity of each FCP strategy before and after scrubbing. Using a subset of the 264 seeds, we compared connectivity scores for regions within the same purported functional network with connectivity scores for regions between which no functional coupling is expected (Chai et al., 2012; Weissenbacher et al., 2009). We chose to focus on two networks of particular interest to our lab: the default mode network (DMN) and the somatomotor network (SMN). These networks are two of the most consistently identified and well characterized functional networks in the brain using rs-FC; the DMN represents relatively long-range connectivity while the SMN represents relatively short-range connectivity. We defined our target DMN ROI as a seed in the left medial prefrontal cortex (mPFC) and then chose six of the remaining 263 seeds that belonged to the DMN and that we expected would be highly correlated with the mPFC: the right mPFC, bilateral posterior cingulate cortex (PCC), bilateral angular gyrus (AG), and precuneus cortex. We defined our target SMN ROI as a seed in the left primary motor cortex (M1) and then chose five other seeds that belonged to the SMN: the left primary somatosensory cortex, the right primary motor cortex, premotor cortex and bilateral putamen. Four additional seeds within the visual cortex were used as reference regions for the mPFC and M1: bilateral BA17 and bilateral BA18. Table 1 lists the MNI coordinates of the centers of all seeds used to calculate FC specificity.
Table 1.
MNI coordinates for the centers of the seeds used to calculate specificity.
| Region | Network | Side | x | y | z | Cluster |
|---|---|---|---|---|---|---|
| mPFC | DMN | L | −7 | 51 | −1 | 1 |
| DMN | R | 9 | 54 | 3 | 1 | |
| PCC | DMN | L | −7 | −55 | 27 | 2 |
| DMN | R | 8 | −48 | 31 | 2 | |
| AG | DMN | L | −44 | −65 | 35 | 2 |
| DMN | R | 52 | −59 | 36 | 2 | |
| Precuneus | DMN | R | 11 | −54 | 17 | 2 |
| M1 | SMN | L | −49 | −11 | 35 | 2 |
| SI | SMN | L | −40 | −19 | 54 | 2 |
| M1 | SMN | R | 38 | −17 | 45 | 2 |
| Premotor | SMN | R/L | 3 | −17 | 58 | 2 |
| Putamen | SMN | L | −22 | 7 | −5 | 2 |
| Putamen | SMN | R | 31 | −14 | 2 | 2 |
| BA 17 | Visual | L | −8 | −81 | 7 | 2 |
| Visual | R | 6 | −81 | 6 | 2 | |
| BA 18 | Visual | L | −12 | −95 | −13 | 1 |
| Visual | R | 8 | −91 | −7 | 2 |
Cluster refers to the groupings of ROIs based on pre-FCP FD/DVARS correlations as illustrated in Figure 5B. mPFC = medial PreFrontal Cortex, PCC = Posterior Cingulate Cortex, AG = Angular Gyrus, BA = Brodmann Area, DMN = Default Mode Network, M1 = Primary Motor Cortex, SI = Primary Somatosensory Cortex, SMN = Somatomotor Network
For each participant, representative seed time courses were generated by averaging the timeseries of all voxels belonging to each seed. Specificity was then estimated as follows:
where ztarget is the average Fisher transformed Pearson’s correlation between the target seed time course and the time courses of the other seeds belonging to the same functional network, and zreference is the average Fisher-transformed Pearson’s correlation between the target seed time course and the time courses of the reference seeds. A linear mixed effects model was used to test for main effects and interactions of the same factors used in section 2.4.4 but with ROI specificity as the dependent variable. Post-hoc paired Wilcoxon signed-rank tests were used to further investigate main effects and interactions that were identified as significant by the LME, and were Bonferroni corrected to account for multiple comparisons. MeanWC+scrubbing was also compared to the aCompCor methods to see if scrubbing would increase specificity of MeanWC, as this is a common practice, over using aCompCor alone.
3. Results
3.1 Motion characteristics of the sample
We restricted our analyses to participants who met our normal motion constraint: no subject had between volume translational movements of more than 3 mm or rotational movements of more than 3 degrees. Figure 3 illustrates the distribution of mean FD values for our sample. The mean (SD, range) of the sample was 0.220 mm (±0.119 mm, 0.064 mm – 0.611 mm). The 33rd and 66th percentiles for the mean FD distribution were 0.147mm and 0.236mm, respectively; 44 and 43 children were in the low and high-motion subgroups, respectively.
Figure 3.

Distribution of mean Framewise Displacement (FD). The solid line represents a kernel density estimate of the overall mean FD density. The dashed vertical line represents the mean (.220 mm) and the dotted line represents the median (.183 mm). The standard deviation and range were .119 mm and .064 – .611 mm, respectively.
3.2 Effects of preprocessing on global motion-induced signal change
3.2.1 Full-sample analysis of FD/DVARS correlation distribution
To investigate whether the association between head motion and DVARS varied among the three FC processing approaches considered here, the correlation between FD and global DVARS was computed using pre-FCP data, post-FCP data and post-FCP+scrubbing data for each approach separately. Figure 4A illustrates how the relationship between FD and global DVARS changed using all three FC processing strategies, while Figure 4B illustrates the distributions of global FD/DVARS correlations post-scrubbing. Consistent with previous reports (Hallquist et al., 2013), we observed a strong correlation between FD and global DVARS in pre-FCP data (Figure 4A, red line; median: .805).
Figure 4. Full-sample distributions of global FD/DVARS correlations by processing strategy.

A) Each line represents a kernel density estimate (KDE) of the distribution of correlations between FD and gray matter DVARS over the 130 participants for each FCP method prior to scrubbing. KDEs are given for pre-FCP data (red) and data FC processed under MeanWC (green), aCompCor (blue), and aCompCor50 (purple). B) The distributions of FD/DVARS correlations using scrubbed data. The median correlation of FD and DVARS is high before FC processing (.805), and was significantly lower (all p < .001, corr) after MeanWC (.206), aCompCor (.099), and aCompCor50 (.001). The median correlation between motion and MR signal change was significantly smaller for data processed using aCompCor versus MeanWC, aCompCor50 versus MeanWC, and aCompCor50 versus aCompCor, (p < .001, corr). MeanWC+scrubbing had significantly lower median correlation compared to MeanWC alone (scrubbed median: .184, p < .001, corr) but aCompCor50+scrubbing had a larger median correlation compared to aCompCor50 alone (.062, p < .002, corr). Scrubbing did not significantly increase median correlation using aCompCor (.139, p = .14, uncor, p=.81, corr).
Also consistent with published findings (Hallquist et al., 2013), we observed a significant reduction in the median correlation between FD and global DVARS after applying all three FCP approaches; however, MR signal modulation by head motion appeared to be differentially mitigated by the FCP strategies. Overall, the linear mixed effects model revealed a significant effect of FCP strategy on the global FD/DVARS correlation (χ2(2) = 288.7, p < .0001). Post-hoc analyses revealed that the median correlation between FD and global DVARS was significantly stronger for MeanWC (Figure 4A, green line; median: .206) than for either aCompCor (Figure 4A, blue line; .099, Z = 8.96, p < .001) or aCompCor50 (Figure 4A, purple line; .001, Z = 9.71, p < .001), indicating that both aCompCor approaches attenuated the motion-BOLD relationship more than the MeanWC method. Comparison of the two aCompCor methods revealed that aCompCor50 was superior in mitigating the FD/DVARS correlation compared to aCompCor (Z = 7.87, p < .001), suggesting that including more spatially coherent PCs from WM and CSF in the nuisance regression improved the attenuation of motion-related global fluctuations in the fMRI signal.
According to the LME, the effect of scrubbing on global FD/DVARS correlations was marginal (χ2(1) = 3.16, p = .076), but there was a significant interaction between FCP strategy and scrubbing (χ2(2) = 36.8, p < .0001). Given this interaction, we ran post-hoc analyses to investigate how scrubbing affected the FD/DVARS correlation under each processing strategy. Comparing the data pre- and post-scrubbing, we observed that the median FD/DVARS correlation was significantly weaker for MeanWC+scrubbing (Figure 4B, green line; median: .184) compared to MeanWC alone (Z = 4.43, p < .001 corr). In contrast, the median FD/DVARS correlation was stronger for aCompCor50+scrubbing (Figure 4B, purple line; median: .062) compared to aCompCor50 alone (Z = 3.37, p < .002 corr). The median FD/DVARS correlation did not significantly increase for aCompCor+scrubbing (Figure 4B, blue line; median .139) compared to aCompCor alone (Z = 1.20, p = .14 uncor, p=.81, corr). These differences in FD/DVARS correlation may be due to scrubbing artificially reducing the variability in FD and DVARS simultaneously since the scrubbed scans are based on high values of FD. Considered together, these results suggest that scrubbing further reduces motion-related artifacts following the MeanWC strategy, but may be counterproductive when aCompCor50 is used.
3.2.2 High-motion subgroup analysis of FD/DVARS correlation distribution
The distributions of the FD/DVARS correlations for the low and high motion subgroups are presented in Figure 5. Comparing high-motion data pre- and post-scrubbing, we observed that the median FD/DVARS correlation was significantly weaker for MeanWC+scrubbing (Figure 5D, green line, median: .251) compared to MeanWC alone (median: .388, Z = 3.92, p < .001 corr). In contrast, the median FD/DVARS correlation was not significantly different for aCompCor50+scrubbing (median: .159) compared to aCompCor50 alone (median: .128, Z = −1.11, p = .27) or for aCompCor (median: .183) compared to aCompCor+scrubbing (median: .165, Z = 0.11, p = .92). Overall, aCompCor50 had the lowest median compared to aCompCor (Z = −2.95, p < .01 corr), MeanWC (Z = −5.68, p < .0001 corr), and MeanWC+scrubbing (Z = −3.89, p < .001 corr). aCompCor had a lower median FD/DVARs correlation compared to MeanWC (Z = −5.66, p < .0001 corr), and marginally lower median compared to MeanWC+scrubbing after Bonferroni correction (Z = −2.55, p = .010, p = .060 corr). Similar to the overall group, these results suggest that scrubbing further reduces motion-related artifacts following the MeanWC strategy, but may not be beneficial when either aCompCor or aCompCor50 is used.
Figure 5.

Distributions of global FD/DVARS correlations by processing strategy for motion-determined subgroups. Low (N=44), medium (N=43) and high (N=43) motion subgroups were determined by tertiles of the mean FD distribution. A) Each line represents a kernel density estimate (KDE) of the distribution of correlations between FD and gray matter DVARS over participants of in the low-motion subgroup for each FCP method prior to scrubbing. KDEs are given for data FC processed under MeanWC (green), aCompCor (blue), and aCompCor50 (purple). B) The distributions of FD/DVARS correlations using scrubbed data for the low-motion subgroup. Plots C) and D) correspond to plots A) and B), respectively, for the high-motion subgroup. In the both subgroups, the median correlation between motion and MR signal change was significantly smaller for data processed using aCompCor versus MeanWC, aCompCor50 versus MeanWC, and aCompCor50 versus aCompCor, (p < .0001, corr). For each processing strategy, the high-motion subgroup had a higher median FD/DVARS correlation compared to the low motion subgroup (p < .0001 corr). See Supplemental Table 1 for specific median values.
3.2.3 Low-motion subgroup analysis of FD/DVARS correlation distribution
Comparing the low-motion data pre- and post-scrubbing, we did not observe a significant difference in the median FD/DVARS correlation for MeanWC+scrubbing (median: .103) compared to MeanWC alone (median: 0.089, Z = 1.26, p = .51) or aCompCor+scrubbing (median: .069) compared to aCompCor alone (median: .058, Z = −2.01, p = .336 corr). The median FD/DVARS correlation was larger but closer to zero for aCompCor50+scrubbing (median: −.028) compared to aCompCor50 alone (median: −.062, Z = 2.56, p = .050 corr). Overall, aCompCor50 had the lowest median compared to aCompCor (Z = −5.36, p < .0001 corr), MeanWC (Z = −5.56, p < .0001 corr), and MeanWC+scrubbing (Z = −5.40, p < .0001 corr), and aCompCor had a lower median compared to MeanWC (Z = −4.26, p < .0001 corr), and and MeanWC+scrubbing (Z = −3.61, p = 0.002 corr). In the low motion subgroup, scrubbing appeared to only have an effect when using aCompCor50, which had a small but negative median FD/DVARS correlation.
3.2.4 Comparison of low and high motion subgroup distributions of FD/DVARS correlations
Comparing the high and low motion groups, the likelihood ratio test for the 3-way interaction of motion subgroup, FCP strategy and scrubbing was significant (χ2(2) = 64.3, p < .0001), suggesting that FCP strategy and scrubbing impacted FD/DVARS correlations differentially across the two groups. The results of the across-group tests and reported medians are available in Supplemental Material Table 1. Post-hoc Wilcoxon rank sum tests indicated that the high motion subgroup had a higher median FD/DVARS correlation than the low motion subgroup for all combinations of processing strategies and scrubbing (all p < 0.0028 corr).
3.3 Effects of preprocessing on regional motion-induced signal change
Building on previously reported evidence of regional variation in the impact of motion on MR signal change (Power et al., 2012; Satterthwaite et al., 2013; Yan et al., 2013), we attempted to characterize how regional variations in the FD/DVARS relationship were affected by FCP strategy and by scrubbing. Figure 6 shows the distribution of the FD/DVARS correlation for the 130 participants for each of the 264 ROIs. In the pre-FCP data (Figure 6A), the distributions were generally above zero and appeared to be bimodally distributed (Cluster 1: red lines and Cluster 2: green lines). To further investigate this bimodal distribution, k-means clustering of the pre-FCP FD/ROI-DVARS relationships was performed using two clusters (Figure 6B). To test whether the spatial distribution of these two sets of ROIs was different, the distance to the outer edge of the brain was compared. Cluster 1 ROIs (Figure 6B, red dots) were significantly closer to the outer edge of the brain (mean distance: 13.05 mm) and had a stronger relationship between motion and MR signal change (median FD/ROI-DVARS: .520) than cluster 2 ROIs (Figure 6B, green dots; mean distance: 26.44 mm, t(237) = −13.2, p < .0001; median FD/ROI-DVARS: .325, Z = −11.0, p < .001). This is consistent with the concentric circle pattern of motion-induced signal observed by (Satterthwaite et al., 2013); whole-brain motion parameters explain more signal variance in regions that tend to be more prone to motion, i.e., regions furthest from the pivot point which are near the outer edges of the brain.
Although we observed that the overall density of FD/ROI-DVARS correlations became more centered around zero and less variable following all FCP strategies (Figure 6C, E, G), we wanted to investigate whether FCP strategy and scrubbing had differential effects on the ROIs most affected by motion compared to those least affected by motion. To do this, we constructed a linear mixed effects model using cluster-mean FD/ROI-DVARS correlations for each participant as our outcome. The three-way interaction between cluster, FCP strategy, and scrubbing was not significant (χ2 (2) = 1.19, p = .552). However, we observed significant two-way interactions between cluster and FCP strategy (χ2 (2) = 8.44, p = .015), cluster and scrubbing (χ2 (1) = 17.0, p < .0001), and, consistent with the overall single mode model, scrubbing and FCP strategy (χ2 (2) = 90.5, p < .001), suggesting that there were differential effects of processing stream and scrubbing across the clusters. We therefore investigated effects of FCP strategy and scrubbing on FD/ROI-DVARS correlations within each cluster and across clusters.
The medians for each processing strategy by scrubbing and cluster and their comparisons are shown in Table 2. Independent analyses for each cluster revealed that within the outer cluster with higher degrees of motion (Cluster 1), MeanWC had a higher FD/ROI-DVARS correlation compared to aCompCor (median difference = .042, Z = 9.51, p < .001) and aCompCor50 (median difference = .073, Z = 9.77, p < .001); additionally, aCompCor had a higher correlation compared to aCompCor50 (.027, Z = 7.16, p < .001). A similar pattern was observed within the inner cluster (Cluster 2). MeanWC had a higher FD/ROI-DVARS correlation compared to aCompCor (median difference = .056, Z = 9.39, p < .001) and aCompCor50 (.028, Z = 9.78, p < .001); aCompCor had a higher correlation compared to aCompCor50 (.031, Z = 7.07, p < .001). Thus, in both clusters, aCompCor50 performed the best and MeanWC performed the worst.
Table 2.
Median FD/ROI-DVARS Correlations between Clusters by Processing Strategy.
| FCP strategy | Outer Cluster (1) median | Inner Cluster (2) median | Outer – Inner median | p-value |
|---|---|---|---|---|
| pre-FCP | .520 | .325 | .185 | <.001 |
| MeanWC | .078 | .039 | .043 | <.001 |
| MeanWC+S | .058 | .033 | .029 | <.001 |
| MeanWC-MeanWC+S | .010 | .000 | .012 | <.001 |
| aCompCor | .035 | .000 | .033 | <.001 |
| aCompCor+S | .041 | .017 | .023 | <.001 |
| aCompCor-aCompCor+S | .000 | −.004 | .006 | <.001 |
| aCompCor50 | .000 | −.018 | .028 | <.001 |
| aCompCor50+S | .024 | .000 | .019 | <.001 |
| aCompCor50-aCompCor50+S | .000 | −.011 | .003 | <.001 |
|
| ||||
| MeanWC-aCompCor | .043 | .056 | .010 | <.001 |
| MeanWC-aCompCor50 | .078 | .028 | .017 | <.001 |
| aCompCor-aCompCor50 | .021 | .031 | .006 | <.001 |
Clusters were determined using k-means clustering of the pre-FCP FD/ROI-DVARS correlations. Mean correlations were calculated for each cluster, over ROIs, for each participant. Group median correlations are presented above for each cluster, the median difference in correlation between clusters. The tests are separated by comparing across scrubbing within FCP strategy (above the line) and across FCP strategy (below the line). P-values were calculated using Wilcoxon signed-rank tests. FCP = Functional Connectivity Processing; S = Scrubbing
Across clusters, there was a higher median change in the outer cluster compared to the inner cluster for MeanWC versus aCompCor (median difference= .010, Z = 6.03, p < .001), MeanWC versus aCompCor50 (.017, Z = 7.43, p < .001), and aCompCor versus aCompCor50 (.006, Z = 4.47, p < .001). This indicates that both aCompCor approaches reduced the differential impact of motion on BOLD signal changes across clusters more than MeanWC, and again aCompCor50 performed the best.
Scrubbing had a differential effect across clusters for MeanWC (median difference between MeanWC and MeanWC+scrubbing for cluster 1 - cluster 2: .012, Z = 6.83, p < .001), aCompCor (.006, Z = 5.56, p < .001) and aCompCor50 (.003, Z = 4.66, p < .001). This indicates that scrubbing affects the FD/ROI-DVARS correlation differentially in the inner cluster compared to the outer cluster. Looking at the differences within cluster, aCompCor and aCompCor50 had an estimated median difference of 0 between using the non-scrubbed vs. scrubbed data in the outer cluster, but had a negative median difference in the inner cluster, indicating that scrubbing did not largely affect the FD/DVARS correlation in the outer cluster, but actually increased the correlation in the inner cluster for these FCP strategies. On the contrary, the estimated median difference in the inner cluster for MeanWC was 0 comparing pre-post scrubbing, but was positive in the outer cluster, indicating that scrubbing did not change the median FD/DVARS correlation for the inner cluster, but mainly the outer cluster of ROIs. Again, it seems as though scrubbing using the MeanWC FCP strategy is beneficial with respect to the MR signal-motion relationship, but can be detrimental when using aCompCor.
The main effect results for the FD/ROI-DVARS model confirmed the findings observed for the global FD/DVARS model. We found a significant effect of FCP strategy across both clusters on mean FD/ROI-DVARS correlation (χ2(2) = 542.3, p < .0001). Post-hoc analyses revealed that the median correlation between FD and ROI-DVARS was significantly larger for MeanWC (.053) than for either aCompcor (.017, Z = 9.53, p < .001, corr) or aCompcor50 (−.013, Z = 9.79, p < .001, corr) across all ROIs, regardless of scrubbing. The median correlation of FD/ROI-DVARS was significantly lower using aCompCor50 than aCompCor (Z = 7.22, p < .001, corr), again suggesting that including more PCs from WM and CSF in the nuisance regression improves the attenuation of motion-related fluctuations. Although there was a marginally significant main effect of scrubbing on the median global FD/DVARS correlation in section 3.1, the main effect of scrubbing on median FD/ROI-DVARS was not significant (χ2(1)=.26, p = .61). This indicates that scrubbing did not appear to affect FD/ROI-DVARS on a marginal level across processing streams and clusters.
3.4 Effect of FCP strategy on connectivity
3.4.1 Motion effects on connectivity by inter-node distance
We did not observe strong relationships between QC-RSFC and ROI-pair distance using the GAM or linear model, regardless of processing strategy or use of scrubbing; all QC-RSFC Pearson correlations had magnitudes < .08 (Supplemental Figure 1). Using the full time-course for ROI-pair correlations, aCompCor50 had the smallest magnitude of QC-RSFC distance correlation (−.061) followed by aCompCor (−.0655) and then MeanWC (−.079), which had the largest magnitude. Using the scrubbed time-course mitigated this negative relationship (correlation for aCompCor50: −.0005, aCompCor: − .0050, MeanWC: −.0380), but the shape of the QC-RSFC-distance relationship was similarly flat as when the full time-courses were used. Comparing FCP strategies using the same time courses, Williams’ test indicated that QC-RSFC distance correlations were significantly different with p < .01, except for the difference between aCompCor50 and aCompCor using the full time-course, which had a p-value of .01. Though we see statistically different correlations when we compare FCP strategies, this is largely due to the number of ROIs selected, as the effect of distance on the QC-RSFC correlation is small even for large distances between ROIs.
3.4.2 Effect of FCP strategy on specificity of well-defined functional networks
3.4.2.1 mPFC specificity
To investigate the potential cost of mitigating motion artifacts in terms of our ability to estimate functional connectivity, we assessed FC specificity of the mPFC for each FCP strategy before and after scrubbing. Figure 7A illustrates the distribution of mPFC specificity scores for each method and Supplementary Figure 2A shows the breakdown of specificity scores into ztarget and zreference components for each method. Higher specificity scores indicate stronger correlations between regions that are known to be functionally connected (ztarget) relative to correlations between regions that are not expected to be functionally connected (zreference). Using a linear mixed effects model, the main effect of FCP strategy was significantly related to FC specificity (χ2(2) = 61.7, p < .0001). Wilcoxon signed-rank tests were run to further investigate this main effect pre-scrubbing (3 tests) as well as 3 additional apriori tests comparing MeanWC+scrubbing to each of the three pre-scrubbing methods (see next paragraph); thus, a Bonferroni correction factor of 6 was used. The pre-scrubbing comparisons indicated that specificity of mPFC connectivity using the MeanWC processing was lower (median = .502) than using aCompCor (.554, Z = 3.27, p = .006 corr) and aCompCor50 (.604, Z = 5.06, p < .0001 corr), suggesting that both aCompCor approaches improved specificity of mPFC connectivity compared to MeanWC. The median specificity mPFC connectivity using aCompCor50 was higher compared to aCompCor (Z = 2.54, p= .011 uncorr), but this difference was only marginal when corrected for multiple comparisons (p=.067, corr).
Figure 7.
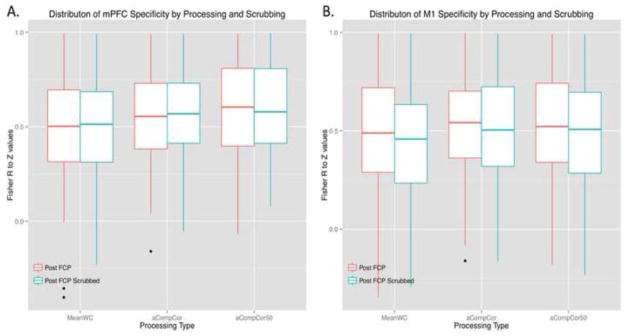
Specificity of functional connectivity. Correlations were Z-transformed and specificity was calculated as in Chai et al., 2012 (calculation in section 2.4.8) for A) the medial Pre-Frontal Cortex (mPFC) and B) the left primary motor cortex (M1). mPFC specificity was lower using the MeanWC strategy (median = .502) compared to aCompCor (.554 p = .003, corr) and aCompCor50 (.604, p = .0001, corr). The median mPFC specificity of aCompCor50 was higher compared to aCompCor (p= .011 uncorr), but this difference was only marginal when corrected for multiple comparisons (p=.067, corr). The median specificity for MeanWC+scrubbing was still lower than both aCompCor strategies: (median difference with aCompCor: −.068 (p = .028, corr) and median difference with aCompCor50: −.072 (p < .0001, corr). M1 specificity was not significantly different using MeanWC processing (median = .488) than using aCompCor (.541, Z = 1.94, p = .314, corr) or aCompCor50 (.521, Z = 2.01, p = .265, corr). The median specificity of aCompCor was not different compared to aCompCor50 (Z = 0.334, p > .94, corr). Specificity was lower for MeanWC+scrubbing (scrubbed median specificity = .458, Z = 4.72, p < .001, corr), aCompCor+scrubbing (scrubbed median specificity = .504, Z = 4.00, p < .001, corr), and aCompCor50+scrubbing (scrubbed median specificity = .507, Z = 4.83, p < .001, corr), compared to the non-scrubbed data. Specificity using the MeanWC+scrubbing strategy was significantly lower compared to aCompCor (Z = 4.08, p < .001, corr) or aCompCor50 (Z = 4.03, p < .001, corr).
Neither the main effect of scrubbing on mPFC specificity (χ2(1) = .77, p = .38) nor the interaction between FCP strategy and scrubbing on mPFC specificity (χ2(2) = .06, p = .97) was significant. We performed additional post-hoc tests to investigate whether specificity loss using MeanWC compared to the aCompCor methods was recovered post-scrubbing by comparing MeanWC+scrubbing specificity to aCompCor and aCompCor50 specificity prior to scrubbing (included in the Bonferroni correction factor described in the preceding paragraph). When scrubbing was performed at the end of the MeanWC pipeline, no significant change in specificity was observed compared to the MeanWC approach by itself (scrubbed median specificity = .513, Z = 0.82, p > .41 corr). The median specificity of mPFC connectivity calculated using aCompCor and aCompCor50 were both significantly higher than MeanWC+scrubbing specificity (Z = 2.83, p = .028, Z = 4.64, p < .0001, corr, respectively). Thus, even after scrubbing, MeanWC as a strategy continued to result in lower mPFC specificity compared to both aCompCor methods. While scrubbing improved the effectiveness of MeanWC in terms of the motion-BOLD relationship, scrubbing did not improve the effectiveness of MeanWC (or any of the FCP strategies) in terms of specificity.
3.4.2.2 M1 specificity
We assessed M1 FC specificity for each FCP strategy before and after scrubbing in a similar way to the mFPC analysis. Figure 7B illustrates the distribution of M1 specificity scores for each method, and Supplementary Figure 2B shows the breakdown of specificity scores into ztarget and zreference components for each method. Using a linear mixed effects model, the main effect of FCP strategy on MI FC specificity was significant (χ2(2) = 8.91, p = .012). Post-hoc Wilcoxon signed-rank tests were conducted to test differences in specificity: 3 to explore differences in M1 specificity pre-scrubbing, 3 to explore M1 specificity differences post-scrubbing, and two apriori tests comparing M1 specificity for MeanWC+scrubbing to aCompCor and aCompCor50 pre-scrubbing. Thus, significance levels were Bonferroni-corrected for multiple comparisons using a correction factor of 8. Prior to scrubbing, M1 specificity using the MeanWC processing was marginally lower (median = .488) than using aCompCor (.541, Z = 1.94, p = .052 uncor) or aCompCor50 (.521, Z = 2.01, p = .044 uncor), but these differences were not significant after correcting for multiple comparisons (p = .419 and p = .354 corr, respectively). The median specificity of aCompCor was not different compared to aCompCor50 (Z = 0.334, p > 0.94, corr).
The main effect of scrubbing on specificity (χ2(1) = 12.14, p < .001) was also significant whereas the interaction between FCP strategy and scrubbing on specificity was not (χ2(2) = .29, p = .866). We performed additional post-hoc tests to investigate whether scrubbing significantly increased specificity. When scrubbing was performed, specificity was lower for MeanWC (scrubbed median specificity = .458, Z = 4.72, p < .001, corr), aCompCor (scrubbed median specificity = .504, Z = 4.00, p < .001, corr), and aCompCor50 (scrubbed median specificity = .507, Z = 4.83, p < .001, corr), compared to the non-scrubbed data. Specificity using the MeanWC+scrubbing strategy was significantly lower compared to aCompCor (Z = 4.08, p < .001, corr) and aCompCor50 (Z = 4.03, p < .001, corr). Thus, scrubbing lowered specificity under all three processing strategies and did not improve the specificity of M1 connectivity estimates under MeanWC processing compared to aCompCor or aCompCor50 prior to scrubbing.
4. Discussion
A recent flurry of papers has raised concerns about the corruption of rs-FC measures by head movements, yet the question of what to do about motion is still controversial. In the current study, we did not aspire to present an optimal processing stream. Rather, we set out to answer the call to action proposed by J. D. Power and associates in 2012 to examine our own preprocessing strategy to determine if motion-induced MR signals linger in our FC data. We crafted these analyses to determine how effectively aCompCor mitigates motion-induced MR signal changes and to measure the cost of the attenuation of motion-related MR signal change in terms of the resulting specificity of connectivity estimates. Compared to the more commonly used mean tissue-based nuisance signal regression, we found that aCompCor attenuated the relationship between head motion and MR percent signal change more effectively. All of the nuisance regression methods examined profoundly reduced the spurious FD/DVARS relationship compared to the use of preprocessed data without any nuisance regression. Both aCompCor methods led to further reductions compared to the MeanWC method and had a significantly smaller FD/DVARS relationship compared to the mean signal method. In addition to mitigating the relationship between BOLD signal change and motion artifact, we also found that both aCompCor methods improved connectivity metric specificity compared to MeanWC. These findings suggest that aCompCor is a better method for rs-FC post-processing than mean signal regression.
4.1 Motion and BOLD signal of neuronal origin
MR signal had a strong relationship with motion before FC preprocessing, as seen by the distribution of both global FD/DVARS correlations (Figure 4A) and the 264 distributions of FD/ROI-DVARS (Figure 6A). These 264 pre-FCP FD/ROI-DVARS distributions were bi-modal, which reflected the spatial organization of the seed regions. The FD/ROI-DVARS relationship was mitigated by all of the post-FCP methods. Even MeanWC resulted in FD/ROI-DVARS correlations that were centered close to zero thus providing drastic improvements in the relationship between MR signal change and motion. Previous studies have found that the choice of post-processing steps and the order in which these steps are performed modulates the effects of motion (Carp, 2013; Hallquist et al., 2013; Jo et al., 2013). Hallquist and colleagues showed that performing nuisance regression after temporal filtering does a poor job of removing nuisance frequencies and results in a higher FD/DVARS relationship. For the current study, the order of processing operations as well as the motion parameters used during nuisance regression were held constant for all three methods examined, thus reducing the likelihood of frequency misspecification presented by Hallquist et al. (2013). As with these previous studies, we performed nuisance regression before temporal filtering, so as to filter signals no longer related to physiological or motion artifacts. In addition, strict thresholds of subject-specific tissue maps (Ashburner and Friston, 2005) were used to identify nuisance voxels for all methods. These FCP processing steps may account for some mitigation in the FD/DVARS relationship across all methods examined.
Despite the profound reduction in the relationship between MR signal change and motion by all FCP strategies tested, the aCompCor methods produced additional improvements compared to the use of mean tissue-based nuisance signal regression. Across regions, both aCompCor methods mitigated the FD/DVARS relationship more thoroughly compared to MeanWC. In addition, this difference was greater for ROIs in the outer cluster (cluster 1), reflecting greater mitigation of motion effects using aCompCor for those ROIs near the edge of brain. Furthermore, while scrubbing data processed using the MeanWC FCP strategy was beneficial with respect to the MR signal-motion relationship, it appeared detrimental to data processed using aCompCor. By not averaging over voxels, aCompCor reduces the risk of spatially disparate nuisance signals canceling one another out. In addition, aCompCor does not make assumptions about the shape or timing of the relationship between the source of noise and the resulting change in MR signal. Several papers using an approach similar to the MeanWC method have suggested expanding the explicit model of motion to 24, or even as many as 36, terms as opposed to the 12 parameters included in all three strategies in this experiment (Power et al., 2014; Satterthwaite et al., 2013; Yan et al., 2013). It is possible that including these additional terms could have improved the efficacy of the MeanWC method in mitigating motion artifacts, but we suggest that aCompCor allows for a more flexible model that can potentially mitigate motion effects not accounted for by the 12 explicit motion regressors while also accounting for sources of physiological noise such as respiration and cardiac pulsation. We believe the 24- and 36-parameter models impose stronger assumptions about the relationship of motion to BOLD signal change and may require additional terms for physiological noise, while parameter inclusion for the aCompCor50 approach is guided solely by the variance in tissues of no interest. Unlike ICA approaches to nuisance removal, aCompCor does not require the classification of components into noise and signal of interest; all components identified by aCompCor are assumed to be noise because they originate in tissues not expected to contain BOLD signal. All of these strengths potentially contribute to the superior performance of aCompCor and virtually eliminate the need for additional scan scrubbing.
When we investigated the mitigation of motion-induced BOLD signal changes in high and low motion subgroups, we found that the aCompCor methods more effectively reduced the FD/DVARS relationship compared to the MeanWC approach within each group. In addition, both aCompCor methods more effectively removed differences in the FD/DVARS relationship between high and low movers compared to mean tissue-based nuisance signal regression. Scrubbing appeared to reduce the group difference in the relationship between MR signal change and motion when the MeanWC method was used; however, the effect of scrubbing on the FD/DVARS relationship for the aCompCor methods was not consistent across groups and did not lead to significant reductions in the differences between groups. A small but statistically significant difference in FD/DVARS correlation persisted between the high and low motion groups even when aCompCor50 was used. Further research is necessary to determine if/how this lingering difference impacts connectivity estimates, but balancing groups according to their motion characteristics or including a group-level adjustment for motion may still be necessary when comparing groups with differential movement profiles.
It is important to note that none of the FCP strategies examined in this paper included global signal regression (GSR), which is another nuisance mitigation approach not explicitly intended for motion correction. While Yan et al. (2013) and Power et al. (2014) found that GSR more thoroughly removed relationships between motion and resting state FC metrics compared to regression of explicit models of motion-induced signal change, concerns have been raised about the potential of GSR to remove signal of neuronal origin (Schölvinck et al., 2010) and to introduce additional confounds into rs fMRI data (Murphy et al., 2009; Saad et al., 2012). One paper even presented evidence that GSR can exacerbate motion artifacts (Jo et al., 2013) while another suggested that GSR biases the structure of motion artifacts (Satterthwaite et al., 2013). Due to this controversy, we chose not to include GSR in any of the FCP strategies tested. aCompCor has already been suggested as an alternative to GSR because it improves the specificity and sensitivity of functional connectivity metrics compared to GSR (Chai et al., 2012). Having omitted GSR, we were still able to drastically reduce the relationship between MR signal change and head motion and to observe additional reductions in this relationship when using aCompCor versus MeanWC. In a supplementary post-hoc regression analysis, we investigated the shared variance between the global signal for each participant and the WM and CSF signals estimated for the three FCP strategies. We found that, on average, WM and CSF regressors estimated by aCompCor and aCompCor50 explained more of the global signal variance (median adjusted R2=.436 and .479, respectively) than the ones estimated by MeanWC (R2=.201). Although the aCompCor regressors appear to share more variance with the global signal, we consider it unlikely that the superior performance of the aCompCor methods over MeanWC is simply due to leakage of grey matter signal (which would contribute to the global signal) into adjacent WM and CSF-labeled voxels given the measures we took to minimize partial voluming effects in our WM and CSF masks. Rather, we argue that bulk motion induces signals changes that are common across voxels regardless of tissue type and that aCompCor is better able to estimate multiple components that are common across voxels than the MeanWC method.
4.2 Motion and Connectivity
Previous studies have suggested that motion has non-uniform effects across the brain which may lead to spurious assumptions about group differences in connectivity (Power et al., 2012; Satterthwaite et al., 2013, 2012; Van Dijk et al., 2012). Assessing the effects of motion on rs-FC is challenging because some connections may be strengthened with motion, while others are weakened. We examined if the correlation between connectivity and motion was modulated by ROI-pair distance, but found that distance did not change the group-level QC-RSFC metric regardless of the FCP strategy used. To further examine the impact of motion on rs-FC, we used a specificity metric based on the anatomy of known functional networks to determine whether connectivity is high for regions within the same network and low for regions between different networks that are not expected to be strongly connected (Chai et al., 2012). Well-established DMN, motor and visual regions were selected for this purpose. It was found that the specificity of mPFC and M1 connectivity was greater for both aCompCor methods than for MeanWC, although the relatively shorter-range M1 connectivity was less affected by FCP strategy than the longer-range mPFC connectivity. Therefore, in concordance with Chai and colleagues, the current study found that the use of aCompCor significantly improved the specificity of connectivity measurements for these networks. In addition, all of the motor seeds belonged to the inner cluster in Figure 6B, while some of the DMN seeds belonged to the outer cluster. Just as we saw that the benefit of aCompCor over MeanWC was amplified in the outer cluster in terms of the FD/DVARS relationship, here too, we see that the benefit of aCompCor over MeanWC in terms of specificity is also maximal when ROIs in outer cluster are involved. Furthermore, while scrubbing improved the effectiveness of MeanWC in terms of the motion-BOLD relationship, scrubbing did not improve the effectiveness of MeanWC (or any of the FCP strategies) in terms of the specificity of mPFC connectivity and actually reduced the specificity of M1 connectivity for all three FCP strategies.
4.3 Limitations
The current study illustrates the utility of aCompCor in mitigating motion artifacts. However, a number of limitations exist which may be addressed in future studies. First, the current sample of 8–12 year old typically developing children was relatively homogenous. Because the motivation for this project centered around our concern that motion-induced MR signals might linger in our FC data, we restricted our analyses to participants who met our normal motion constraint: no subject had between volume translational movements of more than 3-mm or rotational movements of more than 3 degrees. Thus, the current study does not address issues related to more extreme head motion. While there was some variation in the scanning parameters used to collect the data analyzed in this study, it is nevertheless the case that our scanning parameters were relatively homogeneous in the context of other papers analyzing the impact of motion on resting state data (Power et al., 2014, 2012). Therefore, we cannot address the impact of scan acquisition parameters like repetition time, scan length, or slice acquisition sequence on the lingering effects of motion. Extending this processing stream comparison to a large, heterogeneous data sets, such as the ADHD-200 (HD-200 Consortium, 2012) or the ABIDE data set (Di Martino et al., 2013), would help to address these issues.
Within our relatively homogeneous sample, we attempted to stratify the effectiveness of preprocessing on global motion-induced signal change by levels of head movement. However, we did not attempt to investigate the influence of motion on group differences in network connectivity. Using resting state scan-rescan data, Van Dijk et al (2012) reported that participant motion was highly correlated across the two sessions; people who moved a lot during the first scan tended to move a lot during the second scan, suggesting that head motion may reflect a participant trait. If we compared the 34,164 connectivity estimates for high and low movers within our sample, we would probably find significant differences. While some of these differences may be due to lingering motion artifacts, some may be due to trait differences between high and low movers, which are reflected in true connectivity differences between the groups. Scrubbing may reduce the number of significantly different connections between the groups of movers but is also likely to contribute to a failure to detect true connectivity differences between high and low movers, as we have already shown that scrubbing has a tendency to reduce specificity for connectivity within the well-defined motor network. A more straightforward approach to examining this critical issue would be to compare within-subject connectivity differences from data collected during scans with little motion versus data collected from the same individuals during which their heads were purposefully moved.
Another important limitation is that we did not set an explicit criterion for the number of time points necessary for a subject to be included in these analyses. We acknowledge that basing correlation calculations on varying numbers of scans across participants is problematic; participants retaining more time points will have less variance in their correlation estimates compared to participants with fewer data points. This problem, while exacerbated by scan scrubbing, is not limited to the discussion of scrubbing; resting state data collected using various repetition times and scan lengths are routinely combined without adjustment for sample size (Biswal et al., 2010; Fair et al., 2013; Power et al., 2014; 2012). Determining an optimal solution for accounting for sample size in resting state correlation estimates is an important area of future work but is beyond the scope of this paper. We believe that excluding participants based on the number of scans retained after scrubbing would introduce a potentially larger problem of biasing results due to selection. The subjects that would have been excluded by such a criterion are the subjects in our sample who moved the most. Also, in comparing estimates calculated pre- and post-scrubbing, we believe including all participants is conservative as using participants with a large number of “scrubbed scans” would allow for scrubbing to have the largest effect.
4.4 Conclusions
The current study found that all nuisance regression strategies significantly mitigated the spurious relationship between motion and regional BOLD signal. However, the use of aCompCor further reduced this relationship compared to mean signal regression. Examination of network connectivity found that aCompCor also improved the specificity of mPFC and M1 connectivity compared to mean signal regression. While the use of aCompCor may not entirely eliminate the impact of motion on rs-FC, we hypothesized that aCompCor would be superior to the mean signal method and our results support this hypothesis. Furthermore, while scrubbing helped to attenuate motion-related artifacts when mean signal regression was used, scrubbing provided no additional benefit in terms of motion artifact reduction or specificity when aCompCor was used. We recommend an aCompCor approach to nuisance regression of rs fMRI data, implementations of which are freely available as part of the CONN toolbox (Whitfield-Gabrieli and Nieto-Castanon, 2012) and the Configurable Pipeline for the Analysis of Connectomes (http://fcon_1000.projects.nitrc.org/indi/cpac/index.html).
SFigure 1: Relationship between mean FD and resting state functional connectivity (QC-RSFC) and ROI-pair distance. Plotted are the group level correlations of subject-specific mean FD and 34164 ROI-ROI correlations (264 choose 2, excluding ROI pairs < 20-mm apart as suggested in Power et. al. 2012) versus the distance between the ROI pairs for each processing stream. The blue lines represents generalized additive model (GAM) smoothed estimates and the red lines represents linear model fits (LM) of the relationship. At the top of each panel, the Pearson correlation between QC-RSFC and ROI-pair distance is indicated. We see no strong relationship between QC-RSFC and ROI-pair distance in the data, regardless of processing stream or scrubbing. Within the time-course used, aCompCor50 has the smallest correlation magnitude. Also, using the scrubbed time-course for the ROI-pair correlation also mitigated this negative relationship, but the change is practically small. Williams’ test indicated that for every pair, the correlation was significantly different with p < 0.01, except for the difference between the aCompCor50 and aCompCor distance-FC-RSFC full time-course correlation, which had a p-value of 0.01. Though we see significant differences, the effect of distance on the FD-ROI correlation is small even for large distances between ROIs. Ranges for the correlation of FD and ROI-ROI correlation are similar to Satterthwaite et al., 2013 (Figure 5). We see that the correlation consistently remains above 0.2 for the correlation of FD and ROI-ROI correlation without global signal regression (GSR), similar to that of Power et al., 2014 (Figure 12, right panel). We see a result similar to Power et al. 2014: “Without GSR, correlations at all distances are positively related to mean FD and these relationships can be reduced but not eliminated by scrubbing and reprocessing.” This may be the case without GSR, yet we address other concerns about GSR in the discussion. Also, though this correlation has been considered a measure of motion artifact, the measure has mainly been used to show that this effect is ROI-pair distance dependent, which is a result we do not see under our processing strategies in our data.
SFigure 2: Boxplots of ztarget, zreference and specificity for A) the medial prefrontal cortex (mPFC) and B) the left primary motor cortex (M1). Note the vertical scales for A and B are not the same; comparisons are to be made within each panel. ztarget boxplots are in the first column of each panel. A) Prior to scrubbing (lightly shaded boxes), we see that the aCompCor50 (blue) approach produced a higher median mPFC-DMN correlation compared to MeanWC (red) and aCompCor (green), which further supports our argument that aCompCor50 outperforms the other two methods in terms of the mitigation of motion effects. In addition, aCompCor50 also reduces the median mPFC-visual correlation (zreference, middle column of boxplots), which is also a relatively long-range “connection,” suggesting that aCompCor50 is not increasing all long-range correlations but only those that are real. The increase in ztarget and the decrease in zreference for aCompCor50 both contribute to aCompCor50 having higher median mPFC specificity compared to the other two approaches (third column). Median mPFC-DMN (ztarget) and mPFC-visual (zreference) correlations are relatively consistent for each processing stream post-scrubbing (darkly shaded boxes). B) In contrast, the shorter-range median M1-motor correlations (ztarget, first column) are relatively similar for the three processing streams pre-scrubbing. Pre-scrubbing differences in specificity appear to be due to differences in longer-range median M1-visual correlations (Z-reference, middle column). Post-scrubbing (darkly shaded boxes), M1-motor correlations (ztarget) are reduced for all FCP strategies, as is specificity.
Supplementary Material
Highlights.
We compared PCA- and mean signal-based artifact reduction methods for rs-fMRI data.
PCA more effectively attenuated motion artifacts than mean signal.
PCA enhanced the specificity of functional connectivity compared to mean signal.
Scan scrubbing following PCA did not further reduce motion artifacts.
Acknowledgments
The project described was supported by grants from Autism Speaks, the National Institute of Mental Health (R01 MH085328-09, and R01 MH078160-07), the National Institute of Neurological Disorders and Stroke (R01 NS048527-08) and the National Institute of Biomedical Imaging and Bioengineering (P41 EB015909 and R01 EB012547). This work represents the opinions of the researchers and not necessarily those of the granting organizations. The authors would like to thank Deana Crocetti, Benjamin Dirlikov and Daniel Peterson for their assistance with data acquisition.
Footnotes
Publisher's Disclaimer: This is a PDF file of an unedited manuscript that has been accepted for publication. As a service to our customers we are providing this early version of the manuscript. The manuscript will undergo copyediting, typesetting, and review of the resulting proof before it is published in its final citable form. Please note that during the production process errors may be discovered which could affect the content, and all legal disclaimers that apply to the journal pertain.
References
- Ashburner J, Friston KJ. Unified segmentation. Neuro Image. 2005;26:839–851. doi: 10.1016/j.neuroimage.2005.02.018. [DOI] [PubMed] [Google Scholar]
- Barber AD, Caffo BS, Pekar JJ, Mostofsky SH. Developmental changes in within- and between-network connectivity between late childhood and adulthood. Neuropsychologia. 2013;51:156–167. doi: 10.1016/j.neuropsychologia.2012.11.011. [DOI] [PMC free article] [PubMed] [Google Scholar]
- Barber AD, Srinivasan P, Joel SE, Caffo BS, Pekar JJ, Mostofsky SH. Motor “dexterity”?: Evidence that left hemisphere lateralization of motor circuit connectivity is associated with better motor performance in children. Cereb Cortex N YN 1991. 2012;22:51–59. doi: 10.1093/cercor/bhr062. [DOI] [PMC free article] [PubMed] [Google Scholar]
- Bates D, Maechler M, Bolker B. lme4: Linear mixed-effects models using S4 classes 2012 [Google Scholar]
- Behzadi Y, Restom K, Liau J, Liu TT. A component based noise correction method (CompCor) for BOLD and perfusion based fMRI. Neuro Image. 2007;37:90–101. doi: 10.1016/j.neuroimage.2007.04.042. [DOI] [PMC free article] [PubMed] [Google Scholar]
- Bianciardi M, Fukunaga M, van Gelderen P, Horovitz SG, de Zwart JA, Shmueli K, Duyn JH. Sources of functional magnetic resonance imaging signal fluctuations in the human brain at rest: a 7 T study. Magn Reson Imaging. 2009;27:1019–1029. doi: 10.1016/j.mri.2009.02.004. [DOI] [PMC free article] [PubMed] [Google Scholar]
- Biswal B, Deyoe EA, Hyde JS. Reduction of physiological fluctuations in fMRI using digital filters. Magn Reson Med. 1996;35:107–113. doi: 10.1002/mrm.1910350114. [DOI] [PubMed] [Google Scholar]
- Biswal B, Yetkin FZ, Haughton VM, Hyde JS. Functional connectivity in the motor cortex of resting human brain using echo-planar MRI. Magn Reson Med Off J Soc Magn Reson Med Soc Magn Reson Med. 1995;34:537–541. doi: 10.1002/mrm.1910340409. [DOI] [PubMed] [Google Scholar]
- Biswal BB, Mennes M, Zuo X-N, Gohel S, Kelly C, Smith SM, Beckmann CF, Adelstein JS, Buckner RL, Colcombe S, Dogonowski A-M, Ernst M, Fair D, Hampson M, Hoptman MJ, Hyde JS, Kiviniemi VJ, Kötter R, Li S-J, Lin C-P, Lowe MJ, Mackay C, Madden DJ, Madsen KH, Margulies DS, Mayberg HS, McMahon K, Monk CS, Mostofsky SH, Nagel BJ, Pekar JJ, Peltier SJ, Petersen SE, Riedl V, Rombouts SARB, Rypma B, Schlaggar BL, Schmidt S, Seidler RD, Siegle GJ, Sorg C, Teng G-J, Veijola J, Villringer A, Walter M, Wang L, Weng X-C, Whitfield-Gabrieli S, Williamson P, Windischberger C, Zang Y-F, Zhang H-Y, Castellanos FX, Milham MP. Toward discovery science of human brain function. Proc Natl Acad Sci. 2010;107:4734–4739. doi: 10.1073/pnas.0911855107. [DOI] [PMC free article] [PubMed] [Google Scholar]
- Bright MG, Murphy K. Removing motion and physiological artifacts from intrinsic BOLD fluctuations using short echo data. Neuro Image. 2012 doi: 10.1016/j.neuroimage.2012.09.043. [DOI] [PMC free article] [PubMed] [Google Scholar]
- Carbonell F, Bellec P, Shmuel A. Global and System-Specific Resting-State fMRI Fluctuations Are Uncorrelated: Principal Component Analysis Reveals Anti-Correlated Networks. Brain Connect. 2011;1:496–510. doi: 10.1089/brain.2011.0065. [DOI] [PMC free article] [PubMed] [Google Scholar]
- Carp J. Optimizing the order of operations for movement scrubbing: Comment on Power et al. Neuro Image. 2013;76:436–438. doi: 10.1016/j.neuroimage.2011.12.061. [DOI] [PubMed] [Google Scholar]
- Chai XJ, Castañón AN, Ongür D, Whitfield-Gabrieli S. Anticorrelations in resting state networks without global signal regression. Neuro Image. 2012;59:1420–1428. doi: 10.1016/j.neuroimage.2011.08.048. [DOI] [PMC free article] [PubMed] [Google Scholar]
- Choe AS, Belegu V, Smith SA, Zijl PCM, van Pekar JJ, McDonald JW. Extensive neurological recovery from a complete spinal cord injury: a case report and hypothesis on the role of cortical plasticity. Front Hum Neurosci. 2013;7:290. doi: 10.3389/fnhum.2013.00290. [DOI] [PMC free article] [PubMed] [Google Scholar]
- Di Martino A, Yan C-G, Li Q, Denio E, Castellanos FX, Alaerts K, Anderson JS, Assaf M, Bookheimer SY, Dapretto M, Deen B, Delmonte S, Dinstein I, Ertl-Wagner B, Fair DA, Gallagher L, Kennedy DP, Keown CL, Keysers C, Lainhart JE, Lord C, Luna B, Menon V, Minshew NJ, Monk CS, Mueller S, Müller R-A, Nebel MB, Nigg JT, O’Hearn K, Pelphrey KA, Peltier SJ, Rudie JD, Sunaert S, Thioux M, Tyszka JM, Uddin LQ, Verhoeven JS, Wenderoth N, Wiggins JL, Mostofsky SH, Milham MP. The autism brain imaging data exchange: towards a large-scale evaluation of the intrinsic brain architecture in autism. Mol Psychiatry. 2013 doi: 10.1038/mp.2013.78. [DOI] [PMC free article] [PubMed] [Google Scholar]
- Fair DA, Nigg JT, Iyer S, Bathula D, Mills KL, Dosenbach NUF, Schlaggar BL, Mennes M, Dickstein DP, Martino AD, Kennedy DN, Kelly C, Luna B, Schweitzer JB, Velanova K, Mostofsky S, Castellanos FX, Milham MP. Distinct neural signatures detected for ADHD subtypes after controlling for micro-movements in resting state functional connectivity MRI data. Front Syst Neurosci. 2013;6:80. doi: 10.3389/fnsys.2012.00080. [DOI] [PMC free article] [PubMed] [Google Scholar]
- Fedorov A, Beichel R, Kalpathy-Cramer J, Finet J, Fillion-Robin JC, Pujol S, Bauer C, Jennings D, Fennessy F, Sonka M, Buatti J, Aylward S, Miller JV, Pieper S, Kikinis R. 3D Slicer as an image computing platform for the Quantitative Imaging Network. Magn Reson Imaging. 2012;30:1323–1341. doi: 10.1016/j.mri.2012.05.001. [DOI] [PMC free article] [PubMed] [Google Scholar]
- Fox MD, Snyder AZ, Vincent JL, Corbetta M, Van Essen DC, Raichle ME. The human brain is intrinsically organized into dynamic, anticorrelated functional networks. Proc Natl Acad Sci U S A. 2005;102:9673–9678. doi: 10.1073/pnas.0504136102. [DOI] [PMC free article] [PubMed] [Google Scholar]
- Friston KJ, Williams S, Howard R, Frackowiak RSJ, Turner R. Movement-Related effects in fMRI time-series. Magn Reson Med. 1996;35:346–355. doi: 10.1002/mrm.1910350312. [DOI] [PubMed] [Google Scholar]
- Hallquist MN, Hwang K, Luna B. The nuisance of nuisance regression: Spectral misspecification in a common approach to resting-state fMRI preprocessing reintroduces noise and obscures functional connectivity. Neuro Image. 2013;82:208–225. doi: 10.1016/j.neuroimage.2013.05.116. [DOI] [PMC free article] [PubMed] [Google Scholar]
- Hastie TJ, Tibshirani RJ. Generalized Additive Models. CRC Press; 1990. [DOI] [PubMed] [Google Scholar]
- HD-200 Consortium, The ADHD-200 Consortium: A Model to Advance the Translational Potential of Neuroimaging in Clinical Neuroscience. Front Syst Neurosci. 2012;6:62. doi: 10.3389/fnsys.2012.00062. [DOI] [PMC free article] [PubMed] [Google Scholar]
- Jo HJ, Gotts SJ, Reynolds RC, Bandettini PA, Martin A, Cox RW, Saad ZS. Effective Preprocessing Procedures Virtually Eliminate Distance-Dependent Motion Artifacts in Resting State FMRI. J Appl Math. 2013 doi: 10.1155/2013/935154. [DOI] [PMC free article] [PubMed] [Google Scholar]
- Kempton MJ, Underwood TSA, Brunton S, Stylios F, Schmechtig A, Ettinger U, Smith MS, Lovestone S, Crum WR, Frangou S, Williams SCR, Simmons A. A comprehensive testing protocol for MRI neuroanatomical segmentation techniques: Evaluation of a novel lateral ventricle segmentation method. Neuro Image. 2011;58:1051–1059. doi: 10.1016/j.neuroimage.2011.06.080. [DOI] [PMC free article] [PubMed] [Google Scholar]
- Lund TE, Madsen KH, Sidaros K, Luo WL, Nichols TE. Non-white noise in fMRI: Does modelling have an impact? Neuro Image. 2006;29:54–66. doi: 10.1016/j.neuroimage.2005.07.005. [DOI] [PubMed] [Google Scholar]
- Murphy K, Birn RM, Handwerker DA, Jones TB, Bandettini PA. The impact of global signal regression on resting state correlations: are anti-correlated networks introduced? Neuro Image. 2009;44:893–905. doi: 10.1016/j.neuroimage.2008.09.036. [DOI] [PMC free article] [PubMed] [Google Scholar]
- Nebel MB, Joel SE, Muschelli J, Barber AD, Caffo BS, Pekar JJ, Mostofsky SH. Disruption of functional organization within the primary motor cortex in children with autism. Hum Brain Mapp. 2012:n/a–n/a. doi: 10.1002/hbm.22188. [DOI] [PMC free article] [PubMed] [Google Scholar]
- Power JD, Barnes KA, Snyder AZ, Schlaggar BL, Petersen SE. Spurious but systematic correlations in functional connectivity MRI networks arise from subject motion. Neuro Image. 2012;59:2142–2154. doi: 10.1016/j.neuroimage.2011.10.018. [DOI] [PMC free article] [PubMed] [Google Scholar]
- Power JD, Cohen AL, Nelson SM, Wig GS, Barnes KA, Church JA, Vogel AC, Laumann TO, Miezin FM, Schlaggar BL, Petersen SE. Functional Network Organization of the Human Brain. Neuron. 2011;72:665–678. doi: 10.1016/j.neuron.2011.09.006. [DOI] [PMC free article] [PubMed] [Google Scholar]
- Power JD, Mitra A, Laumann TO, Snyder AZ, Schlaggar BL, Petersen SE. Methods to detect, characterize, and remove motion artifact in resting state fMRI. Neuro Image. 2014;84:320–341. doi: 10.1016/j.neuroimage.2013.08.048. [DOI] [PMC free article] [PubMed] [Google Scholar]
- Repovs G, Csernansky JG, Barch DM. Brain network connectivity in individuals with schizophrenia and their siblings. Biol Psychiatry. 2011;69:967–973. doi: 10.1016/j.biopsych.2010.11.009. [DOI] [PMC free article] [PubMed] [Google Scholar]
- Rombouts SARB, Barkhof F, Goekoop R, Stam CJ, Scheltens P. Altered resting state networks in mild cognitive impairment and mild Alzheimer’s disease: An fMRI study. Hum Brain Mapp. 2005;26:231–239. doi: 10.1002/hbm.20160. [DOI] [PMC free article] [PubMed] [Google Scholar]
- Saad ZS, Gotts SJ, Murphy K, Chen G, Jo HJ, Martin A, Cox RW. Trouble at Rest: How Correlation Patterns and Group Differences Become Distorted After Global Signal Regression. Brain Connect. 2012;2:25–32. doi: 10.1089/brain.2012.0080. [DOI] [PMC free article] [PubMed] [Google Scholar]
- Satterthwaite TD, Elliott MA, Gerraty RT, Ruparel K, Loughead J, Calkins ME, Eickhoff SB, Hakonarson H, Gur RC, Gur RE, Wolf DH. An improved framework for confound regression and filtering for control of motion artifact in the preprocessing of resting-state functional connectivity data. Neuro Image. 2013;64:240–256. doi: 10.1016/j.neuroimage.2012.08.052. [DOI] [PMC free article] [PubMed] [Google Scholar]
- Satterthwaite TD, Wolf DH, Loughead J, Ruparel K, Elliott MA, Hakonarson H, Gur RC, Gur RE. Impact of in-scanner head motion on multiple measures of functional connectivity: Relevance for studies of neurodevelopment in youth. Neuro Image. 2012;60:623–632. doi: 10.1016/j.neuroimage.2011.12.063. [DOI] [PMC free article] [PubMed] [Google Scholar]
- Schölvinck ML, Maier A, Ye FQ, Duyn JH, Leopold DA. Neural basis of global resting-state fMRI activity. Proc Natl Acad Sci. 2010;107:10238–10243. doi: 10.1073/pnas.0913110107. [DOI] [PMC free article] [PubMed] [Google Scholar]
- Shmueli K, van Gelderen P, de Zwart JA, Horovitz SG, Fukunaga M, Jansma JM, Duyn JH. Low-frequency fluctuations in the cardiac rate as a source of variance in the resting-state fMRI BOLD signal. Neuro Image. 2007;38:306–320. doi: 10.1016/j.neuroimage.2007.07.037. [DOI] [PMC free article] [PubMed] [Google Scholar]
- Van Dijk KRA, Sabuncu MR, Buckner RL. The influence of head motion on intrinsic functional connectivity MRI. Neuro Image. 2012;59:431–438. doi: 10.1016/j.neuroimage.2011.07.044. [DOI] [PMC free article] [PubMed] [Google Scholar]
- Weissenbacher A, Kasess C, Gerstl F, Lanzenberger R, Moser E, Windischberger C. Correlations and anticorrelations in resting-state functional connectivity MRI: a quantitative comparison of preprocessing strategies. Neuro Image. 2009;47:1408–1416. doi: 10.1016/j.neuroimage.2009.05.005. [DOI] [PubMed] [Google Scholar]
- Welner Z, Reich W, Herjanic B, Jung KG, Amado H. Reliability, validity, and parent-child agreement studies of the Diagnostic Interview for Children and Adolescents (DICA) J Am Acad Child Adolesc Psychiatry. 1987;26:649–653. doi: 10.1097/00004583-198709000-00007. [DOI] [PubMed] [Google Scholar]
- Whitfield-Gabrieli S, Nieto-Castanon A. Conn: A Functional Connectivity Toolbox for Correlated and Anticorrelated Brain Networks. Brain Connect. 2012;2:125–141. doi: 10.1089/brain.2012.0073. [DOI] [PubMed] [Google Scholar]
- Wickham H. ggplot2: Elegant Graphics for Data Analysis. 2. Springer Publishing Company; New York: 2009. Incorporated. [Google Scholar]
- Williams EJ. The Comparison of Regression Variables. J R Stat Soc Ser B Methodol. 1959;21:396–399. [Google Scholar]
- Windischberger C, Langenberger H, Sycha T, Tschernko EM, Fuchsjäger-Mayerl G, Schmetterer L, Moser E. On the origin of respiratory artifacts in BOLD-EPI of the human brain. Magn Reson Imaging. 2002;20:575–582. doi: 10.1016/s0730-725x(02)00563-5. [DOI] [PubMed] [Google Scholar]
- Yan CG, Cheung B, Kelly C, Colcombe S, Craddock RC, Di Martino A, Li Q, Zuo XN, Castellanos FX, Milham MP. A comprehensive assessment of regional variation in the impact of head micromovements on functional connectomics. Neuro Image. 2013;76:183–201. doi: 10.1016/j.neuroimage.2013.03.004. [DOI] [PMC free article] [PubMed] [Google Scholar]
- Yan C-G, Zang Y-F. DPARSF: A MATLAB Toolbox for “Pipeline” Data Analysis of Resting-State fMRI. Front Syst Neurosci. 2010;4 doi: 10.3389/fnsys.2010.00013. [DOI] [PMC free article] [PubMed] [Google Scholar]
Associated Data
This section collects any data citations, data availability statements, or supplementary materials included in this article.