

Abstract
A major stumbling block to understanding neural circuits is the extreme anatomical and functional diversity of interneurons. Subsets of interneurons can be targeted for manipulation using Cre mouse lines, but Cre expression is rarely confined to a single interneuron type. It is essential to have a strategy that further restricts labeling in Cre driver lines. We now describe an approach that combines Cre driver mice, recombinant adeno-associated virus, and rabies virus to produce sparse but binary labeling of select interneurons—frequently only a single cell in a large region. We used this approach to characterize the retinal amacrine and ganglion cell types in five GABAergic Cre mouse (Mus musculus) lines, and identified two new amacrine cell types: an asymmetric medium-field type and a wide-field type. We also labeled several wide-field amacrine cell types that have been previously identified based on morphology but whose connectivity and function had not been systematically studied due to lack of genetic markers. All Cre-expressing amacrine cells labeled with an antibody to GABA. Cre-expressing RGCs lacked GABA labeling and included classically defined as well as recently identified types. In addition to the retina, our technique leads to sparse labeling of neurons in the cortex, lateral geniculate nucleus, and superior colliculus, and can be used to express optogenetic tools such as channelrhodopsin and protein sensors such as GCaMP. The Cre drivers identified in this study provide genetic access to otherwise hard to access cell types for systematic analysis including anatomical characterization, physiological recording, optogenetic and/or chemical manipulation, and circuit mapping.
Keywords: amacrine cell, Cre recombinase, ganglion cell, rabies virus, retina
Introduction
Neural circuits are composed of neuron types that have diverse molecular, anatomical, and functional properties. One strategy for linking the function of the entire circuit to the functions of the component neuron units is to target specific cell types and manipulate their activity. Current genetic approaches exploit the molecular diversity of interneurons by linking Cre expression to the expression of a specific gene (Taniguchi et al., 2011; Huang and Zeng, 2013). However, a frequent observation is that Cre expression is rarely confined to a single cell type within a brain region. Strategies for narrowing Cre recombination to either a single neuron or a single neuron type are essential not only for precisely analyzing Cre expression patterns, but also for obtaining unambiguous information about processing in circuits.
The retina is an excellent model system in which to study the structure and function of neural circuits including those that give rise to ganglion cell responses. The current view of ganglion cell circuits is that complex computations depend on the input/output synapses of >30 types of inhibitory amacrine cells which, through specific connections, modulate signal flow between the axon terminals of ∼12 excitatory bipolar cell types and the dendrites of 15–20 ganglion cell types. The well studied functions of ganglion cells makes their circuits a suitable target for Cre-based approaches, but the sheer number and heterogeneity of modulatory amacrine cell types combined with a paucity of genetic markers for both amacrine and ganglion cells presents challenges for such an approach (MacNeil and Masland, 1998; MacNeil et al., 1999; Diamond and Lukasiewicz, 2012).
Our goals in this study were twofold: first, to identify Cre driver lines in which limited types of amacrine and ganglion cells are targeted; and second, to develop a systematic approach for isolating individual cells and cell types within Cre drivers. Since many amacrine cells are GABAergic, we began by characterizing nine transgenic mouse lines in which Cre expression is controlled by promoters associated with cortical GABAergic neurons (Taniguchi et al., 2011). In almost all the Cre drivers, our characterization was impeded by the expression of Cre in multiple amacrine and ganglion cell types, and thus it became necessary to introduce additional screening steps so as to isolate individual neurons and neuron types. To achieve sparse yet intense labeling, we assembled a viral toolbox containing avian virus envelope protein (EnvA)-pseudotyped rabies virus (Wickersham et al., 2007b) and a Cre-dependent recombinant adeno-associated virus (rAAV) that expresses avian tumor virus receptor A (TVA), the cognate receptor for EnvA. This approach permitted genetic targeting and allowed for robust expression of fluorescent markers in a small subset of Cre-expressing neurons. We identified both novel and previously described medium- and wide-field amacrine and ganglion cell types the anatomy of which is normally obscured in populations by extensive process overlap. These Cre driver lines, combined with the ability to refine genetic access, create a basis for a systematic analysis of processing in the inner retina and elsewhere in the CNS.
Materials and Methods
Mice.
All the Cre drivers (for a complete description, see Taniguchi et al., 2011) were purchased from The Jackson Laboratory: (1) CRH-ires-Cre (B6(Cg)-Crhtm1(cre)Zjh/J, JAX 012704); (2) VIP-ires-Cre (STOCK Viptm1(cre)Zjh/J, JAX 010908); (3) nNOS-CreER (B6;129S-Nos1tm1.1(cre/ERT2)Zjh/J, JAX 014541); (4) SST(SOM)-ires-Cre (STOCK Ssttm2.1(cre)Zjh/J, JAX 013044); (5) CCK-ires-Cre (STOCK Ccktm1.1(cre)Zjh/J, JAX 012706); (6) Gad2-ires-Cre (STOCK Gad2tm2(cre)Zjh/J JAX 010802); (7) Lhx6-CreER (B6(Cg)-Lhx6tm1(cre/ERT2)Zjh/J, JAX 010776); (8) Dlx5-CreER (B6(Cg)-Dlx5tm1(cre/ERT2)Zjh/J, JAX 010705); and (9) CR-ires-Cre (B6(Cg)-Calb2tm1(cre)Zjh/J, JAX 010774). Ai9 mice (Madisen et al., 2010; Rosa26-CAG-loxP-STOP-loxP-tdTomato, B6.Cg-Gt(ROSA)26Sortm9(CAG-tdTomato)Hze/J, JAX 007909) were also obtained from The Jackson Laboratory. These lines have been backcrossed to C57BL/6J mice in The Jackson Laboratory, as well as in the authors' laboratory. The Thy1-STOP-YFP mouse line 15 (Buffelli et al., 2003) was a kind gift from Dr. Joshua Sanes (Harvard University, Boston, MA), and was also backcrossed to C57BL/6J mice. Adult mice (5–6 weeks old) of either sex were used for experiments. All animal procedures were performed in accordance with the Guide for the Care and Use of Laboratory Animals as adopted and promulgated by the US National Institutes of Health. All procedures for testing and handling were approved by the Institutional Animal Care and Use Committee of Northwestern University. To activate CreER, tamoxifen (2 mg/d, for 3 d) was injected intraperitoneally at postnatal day 21. Seven days after the last induction, mice were subjected to tissue analysis or viral injections.
Viral injections.
AAV injections were performed on 5- to 6-week-old mice. For cell type-specific labeling of amacrine cells, 1 μl of rAAV2 (YF4)-CBA-DIO-TVA (5 × 10¹² genome copies/ml, where YF4 indicates four tyrosine to phenylalanine mutations in the capsid) was injected intravitreally. Five weeks later, 1 μl of pseudotyped rabies virus EnvA-SADΔG-GFP [0.5 to 1 × 10⁶ infectious units (IU)/ml] was injected into the same eye. For cell type-specific labeling of RGCs, 1 μl of rAAV2(YF4)-CBA-DIO-TVA (1 × 10¹³ genome copies/ml) was injected into the eye. After 5 weeks, 1 μl of EnvA-SADΔG-GFP (1 × 10 9 IU/ml) was stereotaxically injected into either the LGN (A/P −2.40 mm from bregma, L/M 2 mm, D/V −2.75 mm) or SC (A/P −3.70 mm from bregma, L/M 0.5 mm, D/V −1.0 mm). The retina was fixed 6 d after EnvA-SADΔG-GFP injection. To label RGC axonal projections in the brain, 1 μl of rAAV2(YF4)-CBA-DIO-GFP (1 × 10¹³ genome copies/ml) was injected into the eye. Five weeks later, the same eye was injected with 5 μl of cholera toxin β conjugated to Alexa Fluor 594 (Ctb-594: 1% in saline; Invitrogen). The animal was perfused transcardially with 4% paraformaldehyde after 24 h, and the brain and the retinas were removed for further fixation. For cell type-specific labeling in brain, 0.3 μl of rAAV2(YF4)-CBA-DIO-TVA (5 × 10¹² genome copies/ml) was stereotaxically injected into each region (primary motor cortex area M1: A/P 1.2 mm from bregma, L/M 0.6 mm, D/V 0.4 mm; primary somatosensory cortex area S1: A/P −1.1 mm from bregma, L/M 3.3 mm, D/V 0.4 mm; and primary visual cortex area V1: A/P −3.4 mm from bregma, L/M 2.5 mm, D/V 0.3 mm). After 3 weeks, 0.3 μl of EnvA-SADΔG-GFP (1 × 10⁵ to 1 × 10 7 IU/ml) was injected into the same site. The brain was removed 7 d later for examination. For calcium imaging and electrophysiology, 1 μl of rAAV2(YF4)-CBA-DIO-TVA (5 × 10¹² genome copies/ml) was injected into the eye. Five weeks later, 1 μl of EnvA-SADΔG-GCaMP3 (1 × 10⁸ IU/ml) or EnvA-SADΔG-ChR2-venus (2 × 10⁷ IU/ml) was injected into the same eye. The retina was removed 6–7 d later for recording. rAAV2(YF4)-CBA-DIO-TVA was manufactured by the Retina Gene Therapy Group at the University of Florida and S. H. DeVries' (S.H.D.'s) laboratory at Northwestern University. rAAV2(YF4)-CBA-DIO-GFP and EnvA-SADΔG-GFP were produced in S.H.D.'s laboratory at Northwestern University.
Immunohistochemistry and imaging.
For immunohistochemistry in the retina, mice were killed, and the eyes were removed and fixed with 4% paraformaldehyde (1.5 h) and then dissected from the eyecup. After washing six times each for 30 min with a modified phosphate buffer (PB) containing 0.5% Triton X-100 and 0.1% NaN3, pH 7.4, retinas were blocked for 2 d in modified PB containing 3% donkey serum. Retinas were then incubated with primary antibody diluted in modified PB plus 3% donkey serum for 5–7 d. After six washes for 30 min each, the retinas were incubated in donkey secondary antibody for 2 d at 4°C. For brain labeling and projection studies, mice were perfused transcardially with 4% paraformaldehyde and postfixed for 3–5 d at 4°C. After washing with phosphate buffered saline, the brains were sectioned at 80 μm with a vibratome. Immunohistochemistry proceeded as for the retina.
The primary antibodies used were as follows: rabbit anti-GFP (1:2000, Invitrogen), chicken anti-GFP (1:1000, Abcam), rabbit anti-RFP (1:1000, Rockland), goat anti-choline acetyltransferase (1:500, Millipore), rabbit anti-GABA (1:2000, Sigma-Aldrich), rabbit anti-VIP (1:1000, ImmunoStar), rabbit anti-nNos (1:1000, Invitrogen), and rat anti-SST (1:10, Millipore). Secondary antibodies were conjugated to Alexa Fluor 488 (Invitrogen), Cy3 (Jackson ImmunoResearch), or Cy5 (Jackson ImmunoResearch). All secondary antibodies were used at a dilution of 1:200.
Imaging and morphological analysis.
Retina spanning images of wide-field amacrine cells were captured with a Nikon A1R confocal microscope using a 10× objective and the image stitching function. Somata and nearby processes were additionally imaged with a Zeiss LSM-510 Meta confocal microscope using a 25× objective and 1.45 μm Z-stack steps. The same LSM-510 confocal settings were used to capture the structure of medium-field amacrine cells and RGCs. For wide-field amacrine cells, complete morphologies were traced in Neurolucida using Neuron Tracing Software (MBF Bioscience). The classification was based on four parameters: soma size, dendritic field size in the ON and OFF sublaminae, symmetry of the dendritic field, and stratification of arbors. To measure the size of the dendritic field, a convex polygon was drawn connecting the outermost tips of the dendrites, and the area within this contour was measured. The diameter of the dendritic field was calculated from the measured area by assuming the dendritic field is circular. Soma diameter was calculated in the same way. The symmetry index was calculated as the distance of the soma to the center of the polygonal dendritic field divided by the diameter of the dendritic field. Data are presented as mean ± SD.
The level of stratification of amacrine cells and RGCs was measured with LSM Image software (Zeiss). A rectangle representing the region of interest (ROI; ∼195 μm × 30 μm) was placed near the center of a dendritic field. The image data within the ROI at each level of the z-stack was projected onto the x-axis. The stratification levels of amacrine or ganglion cell dendrites were determined from the upper and lower boundaries of GFP-labeled arbors relative to the choline acetyltransferase (ChAT)-positive bands in XZ plane. Later, the same procedure was repeated on the middle and distal parts of the dendritic field or “axon-like” arbors to verify the consistency of stratification in different parts of the retinal coverage area. Data are presented as mean ± SD.
Gaussian fitting.
The measured soma diameters were grouped and fitted with one or more Gaussian distributions in Origin (OriginLab). Goodness of fit was evaluated with a χ2 test and iteratively optimized, when necessary, by adding Gaussian curves to the fit.
Two-photon calcium imaging.
Mice were dark-adapted for at least 2 h. Eyes were enucleated under dim red illumination, and the retinas were dissected from the eyecup under infrared illumination and mounted vitreal side up in the recording chamber. Tissue was continuously superfused with oxygenated (95% O2-5% CO2) Ames medium at room temperature and imaged with a two-photon microscope system (Thorlabs) equipped with a Mai Tai DeepSee ultrafast laser (Spectra-Physics) tuned to 930 nm. Label cells were visualized with a 20× objective (XLUMPLFLN, 1.0 numerical aperture, Olympus). Visual stimuli were generated with a custom-made LED array (Saszik and DeVries, 2012) projected onto the retina through the microscope condenser. The stimulus intensity at 565 nm was 5 × 10⁻⁶ W-cm−2 (1 × 10¹³ photons-cm−2 · s−1). Stimulus duration was 200 ms. Images (416 × 416 pixels) were acquired at 8 frames per second, and pixel size was 0.65 × 0.65 μm on the retina. Data were analyzed with SimplePCI (Compix Inc.).
Electrophysiology.
Light-adapted retinas were removed from the eyecup and mounted vitreal side up in a recording chamber on a Zeiss Axioskop-2 microscope. The retina was held in place with a tissue “harp” (Warner Instruments). Tissue was continuously superfused with a standard external solution that contained the following (in mm): 115 NaCl, 3.1 KCl, 2.48 MgSO4, 6 glucose, 1 sodium succinate, 1 sodium malate, 1 sodium lactate, 1 sodium pyruvate, 2 CaCl2, and 25 NaHCO3, maintained at a pH of 7.4 by bubbling with 5% CO2-95% O2. Recordings were made at room temperature. Whole-cell recordings were obtained with an Axopatch 200B amplifier (Molecular Devices). Borosilicate glass electrodes pulled to 8–12 MΩ were filled with the following (in mm): 80 KCl, 30 CsCl, 2 MgSO4, 10 HEPES, 10 Cs-EGTA, 5 ATP, 0.5 GTP, pH 7.4. Sulforhodamine 101 (0.1 mm; Invitrogen) and 10 mm Neurobiotin (Vector Laboratories) were added to visualize the recorded cells. ChR2-venus-expressing ganglion and amacrine cells were targeted for recording using epifluorescence (Chroma Technology EGFP filter set #41018). To activate ChR2 (channelrhodopsin) during whole-cell recording, light from an X-Cite 120 PC metal halide source (EXFO) was directed through the epifluorescence port and a 470 ± 20 nm bandpass filter (Chroma Technology, HQ470/40x). The stimulus intensity at the retina was 3.05 W-cm−2 (equivalent to 7 × 10¹⁸ photons-cm−2 · s−1). Stimulus duration was controlled by the built-in X-Cite shutter. Currents were recorded both in standard solution and standard solution with added synaptic blockers [50 μm concentration each of picrotoxin, strychnine, CNQX (Tocris Bioscience), and APV (Tocris Bioscience)]. Cell voltage was maintained at −70 mV. After recording, the retina was fixed and processed for immunohistochemistry.
Results
Screening strategy
We provide a summary of our screening and binary labeling strategy (Fig. 1A) with a more detailed description to follow. The initial stage of screening was to acquire an overview of Cre expression in each driver line by crossing the line with Ai9 reporter mice (Rosa26-loxP-STOP-loxP-tdTomato; Fig. 1Aa). We then sparsely labeled the Cre-expressing amacrine cells in each line by injecting eyes with a combination of a rAAV that codes for a floxed form of TVA, a receptor for the avian viral coat protein EnvA, and an EnvA-pseudotyped rabies virus (Fig. 1Ab). Cre expression patterns in ganglion cells were evaluated by crossing each driver line with Thy1-STOP-YFP reporter mice (line 15; Fig. 1Ac). To individually label ganglion cells, TVA-encoding rAAV was introduced into the eye and EnvA-pseudotyped rabies virus was subsequently applied to ganglion cell axonal terminals in a retino-recipient area (LGN or SC) and retrogradely transported back to the soma and dendrites (Fig. 1Ad).
Figure 1.
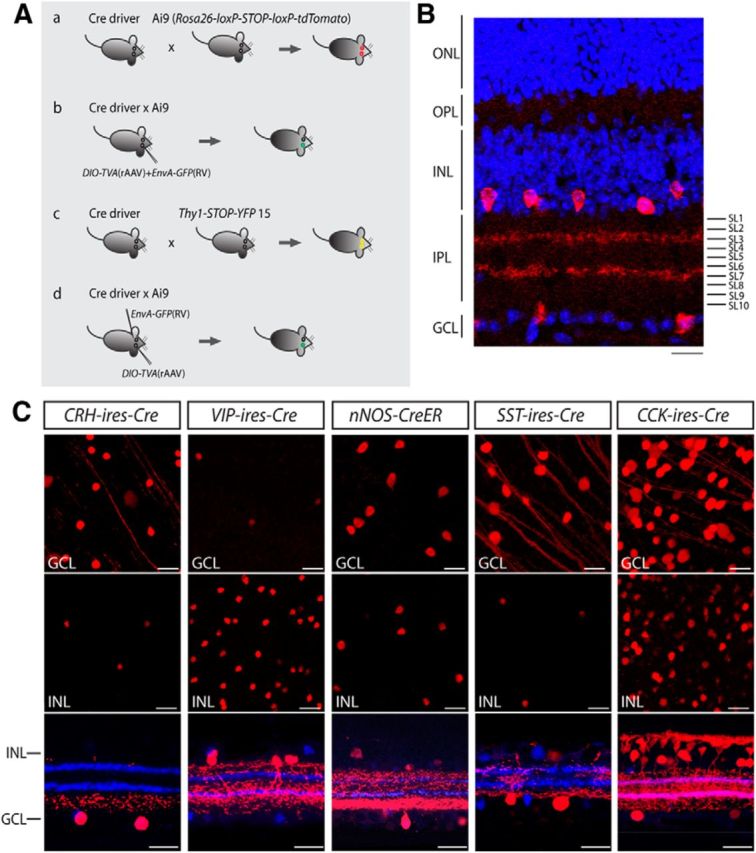
Mouse lines with Cre predominantly expressed in inner retinal neurons. A, Screening strategies for cell type-specific expression of Cre in the inner retina. The distribution of Cre-expressing cells was examined by crossing each Cre driver with Ai9 reporter mice (a), followed by cell type-specific labeling of amacrine cells with intravitreal injection of a rAAV that codes for a floxed TVA and an EnvA-pseudotyped rabies virus carrying GFP (b). Cre expression in ganglion cells was evaluated by crossing each line with Thy1-STOP-YFP 15 mice (c). To individually label ganglion cells, a rAAV encoding for a floxed TVA was introduced into the eye of the Cre × Ai9 mice, and EnvA-pseudotyped rabies virus carrying GFP was subsequently applied to ganglion cell axonal terminals in a retino-recipient area such as the LGN or SC (d). B, Organization of the retina and definition of IPL stratification. A vertical section of mouse retina labeled with the nuclear stain TO-PRO-3 (blue) and antibodies to ChAT (red). The level of stratification was defined as 0–100% from the border of the INL to the border of the GCL. The positions of ON and OFF-ChAT bands were estimated at 60% and 27% of the IPL, respectively. The IPL can be further divided into 10 equal strata or sublaminae (SL1–SL10) in which the ChAT bands occupy SL3 and SL7. ONL, Outer nuclear layer; OPL, outer plexiform layer. Scale bar, 25 μm. C, Distribution of Cre-expressing cells in the CRH-ires-Cre, VIP-ires-Cre, nNOS-CreER, SST-ires-Cre, and CCK-ires-Cre retinas. Each driver was crossed with Ai9 mice (Rosa26-lox-stop-lox-tdTomato) as shown in Aa). TdTomato-labeled cells are shown in the GCL (top), the INL (middle), and vertical sections with ChAT (blue; bottom). Scale bar 25 μm.
Overview of labeled cells in the inner retina
We started by screening the labeling pattern of Cre-expressing cells in nine GABAergic Cre driver lines crossed with Ai9 reporter mice. Among the nine lines, two, Lhx6-CreER and Dlx5-CreER, expressed Cre predominantly in Müller glial cells and were excluded from our sample (Fig. 2). In another two lines, Gad2-ires-Cre and CR-CreER, the broad expression of Cre in numerous types of amacrine and ganglion cells (and in the case of Gad2-ires-Cre, also Müller cells) made further characterization difficult, and these lines were also excluded from further analysis. In the remaining five lines, including CRH-ires-Cre, VIP-ires-Cre, nNOS-CreER, SST-ires-Cre, and CCK-ires-Cre, Cre activity was primarily detected in amacrine and ganglion cells (Fig. 1C). Consequently, we focused on these five lines, and present an overview of labeling below.
Figure 2.

Distribution of Cre-expressing cells in the Lhx6-CreER, Dlx5-CreER, Gad2-ires-Cre, and CR-ires-Cre retinas. Each driver was crossed with Ai9 mice. TdTomato-labeled cells were located in the GCL (top) and the INL (middle panels) in both flat-mount (top and middle) and vertical sections (bottom). CreER in the Lhx6-CreER and Dlx5-CreER drivers was activated with tamoxifen injections. Scale bar, 25 μm.
Each of the five lines contained labeled cells in both the inner nuclear layer (INL) and ganglion cell layer (GCL). Cells in the INL that project into the inner plexiform layer (IPL) include bipolar and amacrine cells, whereas cells in the GCL that stratify in the IPL are either ganglion or displaced amacrine cells. We grouped cells into classes based on the position of their somata in the INL or GCL, as well as on the morphology of their axons and dendrites. Bipolar and amacrine cells in the INL were distinguished by the presence (bipolar cells) or absence (amacrine cells) of stout dendrites extending to the outer plexiform layer. Ganglion and displaced amacrine cells were distinguished by the presence (ganglion cells) or absence (displaced amacrine cells) of axons that course along the vitreal surface of the retina. For weakly labeled cells whose axons were difficult to visualize, we made a preliminary identification based on the size and shape of their somata. For example, displaced amacrine cells have small rounded somata (4–15 μm in diameter) compared with most ganglion cells (9–30 μm in diameter; Kolb et al., 1981; Perry, 1981; Hayes, 1984). Specific neuron types within classes were distinguished by their level of neurite (amacrine cells) or dendrite (RCGs) stratification in 10 IPL layers (Siegert et al., 2009;(Fig. 1B), and by the diameters of their dendritic trees.
In the CRH-ires-Cre driver line, 92% of the Cre-positive cells were located in the GCL, and 8% were in the INL (Fig. 1C, n = 572 cells from 8 retinas). Most of the labeled cells in the GCL had small, brightly labeled somata and were presumably displaced amacrine cells. The remaining cells in the GCL layer had large, weakly labeled somata and were sparsely distributed. These latter cells were RGCs insofar as they had axons.
In the VIP-ires-Cre driver line, 91% of the Cre-positive cells were located in the INL, and only 9% of the cells were observed in the GCL (Fig. 1C, n = 833 cells from 8 retinas). VIP-ires-Cre cells had small cell bodies, and vertical sections suggested they were all amacrine cells.
In the nNOS-CreER driver line, the Cre-positive cells were almost equally distributed between the INL (46%) and GCL (54%; Fig. 1C, n = 725 cells from 8 retinas). Vertical sections indicated that most of the cells in the INL were amacrine cells, along with a small fraction of bipolar cells. The cell bodies in the GCL were ∼14 μm in diameter, and no ganglion cell axons were visible. nNOS-Cre cells in the GCL were most likely displaced amacrine cells.
In the SST-ires-Cre driver line, most (75%) Cre-positive cells were located in the GCL with the remainder in the INL (Fig. 1C, n = 663 cells from 8 retinas). In addition to large ganglion cell bodies, a group of smaller, round cell bodies was observed in the GCL, suggesting that displaced amacrine cells were also present in this line. Vertical sections revealed that the cells in the INL were amacrine cells.
In the CCK-ires-Cre line, Cre expression was observed in bipolar, amacrine, ganglion, and Müller cells (Fig. 1C, n = 987 cells from 6 retinas). Bipolar cells made up more than half of the labeled cells in the INL, with the rest being amacrine and a small number of Müller cells. The GCL contained both labeled ganglion and amacrine cells.
Thus, each line has multiple labeled types in the INL and GCL. Cross-sectional views, in particular, show that the processes of neighboring cells in both the same and different types extensively overlap. This overlap makes it hard to define the morphology of individual cells of a given type.
Cre-expressing amacrine cell types
Amacrine cells can be categorized into two subclasses based on the neurotransmitter that they contain: GABAergic and glycinergic. Glycinergic interneurons are usually compact or “narrow-field” (arbor <125 μm in diameter), and are relatively easy to delineate anatomically. GABAergic amacrine cells are often “medium-field” (arbor 125–400 μm in diameter) or “wide-field” (arbor >400 μm in diameter; MacNeil and Masland, 1998), and are characterized by extreme morphological diversity and, as a population, by extensive process overlap. Because of process overlap among wide-field amacrine cells and between wide-field amacrine and ganglion cells, it was difficult to determine how many amacrine cell types were labeled and to characterize their anatomy in the simple Ai9 crosses. Consequently, we sought a labeling strategy with two characteristics. First, many wide-field amacrine cells have neurites that span more than half of the retina; therefore, extremely sparse labeling, ideally one cell per retina, would be preferred to avoid process overlap. Second, to illuminate the thin neurites that often run for several millimeters within the retina, a strong and uniform labeling technique is required.
To meet these requirements, we used a modified rabies virus (EnvA-SADΔG-GFP) to deliver a fluorescent marker to Cre-expressing cells. EnvA-SADΔG-GFP was developed for use in monosynaptic-transsynaptic tracing from genetically identified cell types, and contains two key modifications relative to the wild-type rabies virus. First, the rabies virus envelope glycoprotein (G) responsible for transsynaptic spread is replaced with GFP to mark the host cell and to eliminate endogenous transsynaptic spread (Wickersham et al., 2007a). Second, the virus is pseudotyped with EnvA. EnvA-coated virus lacks the ability to infect mammalian host cells unless those cells have been engineered to express the avian receptor TVA (Wickersham et al., 2007b). Because neither of the modifications interferes with the replication process of the rabies virus within the infected cell, GFP production is extremely high, and labeling is bright.
In this study, we restricted EnvA-SADΔG-GFP expression to Cre-expressing cells without initiating transsynaptic spread. We generated a tyrosine capsid mutant rAAV serotype 2 (Zhong et al., 2008; Petrs-Silva et al., 2011) that carried Cre-dependent TVA (rAAV2(YF4)-CBA-DIO-TVA). This virus was delivered to double transgenic Cre driver × Ai9 mice via intravitreal injection (Fig. 3A,B). Five weeks after rAAV injection, EnvA-SADΔG-GFP was injected into the same eye and the retina was examined 6 d later. The targeted expression of GFP in Cre-expressing cells was verified by coexpression of GFP and tdTomato in the soma. We controlled the density of labeled cells by adjusting the dose of rAAV and EnvA-SADΔG-GFP (Fig. 3E, Table 1). This strategy allowed us to label very few cells in each retina (Fig. 3C), and single-cell labeling could be routinely achieved (Fig. 3D). Meanwhile, GFP expression was extremely strong in the labeled cells, clearly revealing morphology.
Figure 3.

Labeling strategy for single-cell analysis. A, rAAV and pseudotyped rabies virus used for intravitreal injections. B, Scheme of experimental design. C, Three GFP medium-field amacrine cells were discretely labeled in a retina. The image shows an overlay of GFP (green) and tdTomato labeling (red). Note the colocalization of GFP and tdTomato in the somata. Scale bar 100 μm. D, A single wide-field amacrine cell was labeled in a different retina. The image is shown as GFP labeling alone. Inset, Coexpression of GFP (green) and tdTomato (red) in the soma. Scale bar, 1 mm. Retinas in C and D are from CRH-ires-Cre × Ai9 mice. E, Dose-dependent labeling of Cre-expressing cells in the CRH-ires-Cre driver by the rAAV/EnvA rabies virus combination. Because labeling density is more sensitive to the dose of EnvA rabies virus than to that of rAAV, we fixed the amount of rAAV while adjusting the dose of EnvA rabies virus and measured the number of labeled cells/retina. A total of 5 × 10⁹ genome copies of rAAV2(YF4)-CBA-DIO-TVA were injected into an eye followed by a variable dose of EnvA-SADΔG-GFP (plotted on a logarithmic scale). Single-cell labeling occurred at 500 (0.44 ± 0.16 labeled cells/retina)–1000 (1.58 ± 0.34 labeled cells /retina) IU of EnvA-SADΔG-GFP. Data are presented as mean ± SEM (n = 13 retinas for 100 IU; n = 16 retinas for 500 IU; n = 12 retinas for 1000 IU; n = 14 retinas for 5000 IU, and n = 6 retinas for 10,000 IU).
Table 1.
Titer and timing of viral injections
| Cre driver | Cell type | Titer of rAAVa (genome copies) | rAAV injection site | Titer of RVa (infectious units) | RV injection site | Timing of RV injection (post rAAV injection) |
|---|---|---|---|---|---|---|
| CRH | CRH-1 AC | 5 × 10⁹ | Eye | 500–1000 | Eye | 5 weeks |
| CRH | CRH-2 AC | |||||
| VIP | VIP-1 AC | |||||
| nNOS | nNOS-1 AC | |||||
| nNOS | nNOS-2 AC | |||||
| SST | SST-1 AC | |||||
| CCK | SAC | |||||
| CCK | A17 | |||||
| CCK | CCK-1 RGC | 1 × 10¹⁰ | Eye | 106 | LGN or SC | 5 weeks |
| CCK | CCK-2 RGC | |||||
| CCK | CCK-3 RGC | |||||
| CCK | M1 cells | 1.5 × 10⁹ | M1 | 300 | M1 | 3 weeks |
| CCK | S1 cells | S1 | S1 | |||
| CCK | V1 cells | V1 | V1 | |||
| CCK | SC cells | SC | SC | |||
| SST | M1 cells | 1.5 × 10⁹ | M1 | 30 | M1 | 3 weeks |
| SST | S1 cells | S1 | S1 | |||
| SST | V1 cells | V1 | V1 | |||
| SST | SC cells | SC | SC | |||
| CCK | LGN cells | 1.5 × 10⁹ | LGN | 3000 | LGN | 3 weeks |
| SST | LGN cells | 1.5 × 10⁹ | LGN | 3000 | LGN | 3 weeks |
AC, Amacrine cell.
arAAV2 (YF4)-CBA-DIO- TVA.
bRabies virus EnvA-SADΔG-GFP.
The CRH-ires-Cre driver targets two types of amacrine cells
Sparse labeling in the CRH-ires-Cre line revealed two morphological types of displaced amacrine cells. The first type (named CRH-1) was a medium-field cell with a small soma (11.3 ± 2.3 μm in diameter, n = 18 cells from 11 retinas) and an intermediate-sized dendritic tree (224 ± 36 μm in diameter). A hallmark of these cells was the presence of spiny dendrites distributed asymmetrically around the soma (Figs. 3C, 4A). The soma gave rise to 4–6 primary arbors that further branched and stratified within a narrow band near the GCL [83 ± 7% of the IPL, sublamina 8 (SL8)–SL9; Fig. 4B, Table 2]. CRH-1 amacrine cells use GABA as a neurotransmitter (Fig. 4I), and do not appear in previous classifications of amacrine cells (MacNeil and Masland, 1998; MacNeil et al., 1999; Badea and Nathans, 2004).
Figure 4.

The CRH-ires-Cre driver targets two amacrine cell types. A, B, CRH-1 amacrine cell. Flat-mount view of a CRH-1 amacrine cell is shown in A (inset shows the spiny dendrites), and side view with ChAT (blue) is shown in B. Scale bars: A, 50 μm; B, 10 μm. C–H, CRH-2 amacrine cell. A flat-mount retina with a single GFP-labeled CRH-2 wide-field amacrine cell is shown in C. Neurolucida tracing from C is shown in D, with the dendrites and soma drawn in green, the axon-like processes drawn in red, and the outline of the retina marked in white. The region around the soma (marked with the box in C) is enlarged in E, with soma and ON arbors labeled in green and OFF arbors pseudocolored in red. F, Side view with ChAT (blue) of a center region, including the soma, dendrites, and axon-like processes (boxed region in E). G, Side view of a proximal segment of the axon-like process near the soma (yellow arrow in E). H, Side view of a distal segment of the axon-like process (yellow arrow in C). I, J, CRH-1 (I) and CRH-2 (J) amacrine cells are both GABAergic. CRH amacrine cells (green) are colabeled with an antibody against GABA (red). scale bar 10 μm. Scale bars: C, D, 1 mm; E, in 50 μm; F–H, 10 μm.
Table 2.
Summary of amacrine cell types in Cre driver lines
| Cre driver | Cell type | Soma location | Soma diameter (μm) | Dendritic diameter (μm) | Dendritic stratification (% in IPL) | Axon-like process stratification (% in IPL) |
|---|---|---|---|---|---|---|
| CRH | CRH-1 AC (n = 18 from 11 retinas) | GCL | 11.3 ± 2.3 | 224 ± 36 | 83 ± 7 (on) | NA |
| CRH | CRH-2 AC (n = 10 from 10 retinas) | GCL | 13.9 ± 2.0 | 311 ± 51 | 84 ± 6 (on) | 83 ± 5 (proximal) |
| 9 ± 5 (off) | 84 ± 3 (distal) | |||||
| VIP | VIP-1 ACa (n = 22 from 7 retinas) | INL | 11.0 ± 1.1 | 294 ± 90 (on) | 67 ± 11 (on) | NA |
| 280 ± 83 (off) | 14 ± 8 (off) | |||||
| nNOS | nNOS-1 ACa (n = 10 from 10 retinas) | GCL | 13.9 ± 1.3 | 266 ± 50 | 84 ± 5 (on) | 84 ± 7 (proximal) |
| 8 ± 6 (off) | 83 ± 4 (distal) | |||||
| nNOS | nNOS-2 ACa (n = 8 from 3 retinas) | INL (75%) GCL (25%) | 12.0 ± 2.0 | 2620 ± 570 | 47 ± 3 | NA |
| SST | SST-1 ACa (n = 17 from 17 retinas) | GCL | 15.6 ± 2.0 | 337 ± 64 | 88 ± 10 (on) | 86 ± 9 (proximal) |
| 8 ± 3 (distal) | ||||||
| CCK | SAC (n = 9 from 6 retinas) | GCL INL | 13.0 ± 1.9 | 266 ± 31 | 60 ± 2 (on) | NA |
| CCK | A17 (n = 5 from 5 retinas) | INL | 10.9 ± 1.3 | 848 ± 45 | 90 ± 2 (on) | NA |
Data are presented as mean ± SD. AC, Amacrine cell; NA, not applicable.
aCells express the protein corresponding to the promoter.
The second labeled cell type (CRH-2) was a bistratified wide-field amacrine cell (Fig. 4C,D). CRH-2 cells had a complex, “disorganized” morphology that is characteristic of many types of wide-field amacrine cells. A displaced soma (13.9 ± 2.0 μm diameter, n = 10 cells from 10 retinas) gave rise to 3–6 thick primary dendrites (Fig. 4E). Primary dendrites tapered and gave rise to multiple thinner branches that ramified distally, close to the INL (9 ± 5% of the IPL, SL1–SL2), or near the GCL (84 ± 6% of the IPL, SL8–SL9; Fig. 4F, Table 2). Thick primary dendrites also gave rise to one or two very thin axon-like processes that branched further to produce 3–5 processes, all near the bottom of the IPL (83 ± 5% of the IPL for the proximal segments, and 84 ± 3% for the distal segments; Fig. 4G,H, Table 2). These processes crossed extensively near the soma before extending to the entire retina. CRH-2 amacrine cells were GABAergic (Fig. 4J), and are morphologically similar to the previously described A1 wide-field amacrine cell (Famiglietti, 1992; Stafford and Dacey, 1997; Badea and Nathans, 2004).
A type of wide-field amacrine cell is targeted in the VIP-ires-Cre driver
The VIP-ires-Cre driver line demonstrated a relatively simple Cre expression pattern. All the GFP-labeled amacrine cells appeared to belong to a single type (VIP-1; Fig. 5A). Most (91%) VIP-1 somata were located in the INL and had a diameter of 11.0 ± 1.1 μm. Primary dendrites emerged from the soma and descended to the bottom of sublamina b where they extensively ramified (67 ± 11% of the IPL, SL6–SL8, n = 22 cells from 7 retinas; Fig. 5B). A few processes emerged from the soma and ramified near the INL (14 ± 8% of the IPL, SL1–SL3). The ON and OFF dendritic fields were 294 ± 90 and 280 ± 83 μm in diameter, respectively. Many of the cells had a relatively long process that extended ∼400 μm from the soma (Fig. 5D). These cells used GABA as neurotransmitter (Fig. 5C) and resemble previously described “waterfall” cells in mouse (Badea and Nathans, 2004).
Figure 5.

The VIP-ires-Cre driver targets one amacrine cell type. A, A VIP-1 wide-field amacrine cell is shown in flat-mount view with soma and ON arbors labeled in green, and OFF arbors pseudocolored in red. Scale bar, 50 μm. B, Side view with ChAT (blue) of the cell in A. Scale bar, 10 μm. C, The VIP-1 amacrine cell is GABAergic. Scale bar, 10 μm. D, A VIP-1 amacrine cell with “tail” (yellow arrow). Soma and ON arbors are labeled in green and OFF arbors are labeled in red. Scale bar, 100 μm.
The nNOS-CreER driver targets two types of wide-field amacrine cells
The nNOS-CreER driver specifically marked two types of wide-field amacrine cells. The first type (nNOS-1) was morphologically similar and probably identical to the CRH-2 amacrine cell (Fig. 6A–F). The soma was 13.9 ± 1.3 μm in diameter (n = 10 cells from 10 retinas) and located in the GCL. Two sets of arbors stratified in two layers: sparse, axon-like arbors intersected each other near the soma before extending across the entire retina near the bottom of the IPL; and small, thick arbors crossed the IPL in the distal direction and ramified at the INL/IPL border. Both nNOS-1 and CRH-2 amacrine cells were labeled by a nNOS antibody (Fig. 6H,I) and, thus, are likely to be the same cell type.
Figure 6.

Labeling in the nNOS-CreER driver line. A, nNOS-1 wide-field amacrine cell. A single nNOS-1 wide-field amacrine cell was labeled in a whole-mount retina. Scale bar, 1 mm. B, Neurolucida tracing of A, with the dendrites and soma drawn in green, the axon-like processes drawn in red, and the outline of the retina marked in white. Scale bar, 1 mm. C, Enlarged view of the boxed region in A, with the soma and ON arbors labeled in green and the OFF arbors labeled in red. Scale bar, 50 μm. D, Side view with ChAT (blue) of the boxed region in C, including the soma, dendrites, and axon-like processes. E, Side view of a segment of axon-like process near the soma (yellow arrow in C). F, Side view of a distal segment of axon-like process (yellow arrow in A). Scale bars: D–F, 10 μm. G, The nNOS-1 amacrine cell is GABAergic. Scale bar, 10 μm. H, I, Both nNOS-1 and CRH-2 amacrine cells are positive for nNOS. Scale bars, 10 μm. J, Three nNOS-2 wide-field amacrine cells reconstructed from a projected image. Scale bar, 500 μm. K–M, Morphologies of nNOS-2 amacrine cells. Each cell was pseudocolored corresponding to J. Top, Enlarged view of a center region including the soma and nearby arbors. Scale bar, 20 μm. Side view with ChAT (blue) of the boxed region is shown in the middle. Scale bar, 10 μm. Bottom, Side view of the distal arbors (arrows in J). Scale bar, 10 μm. N, The nNOS-2 amacrine cell is GABAergic. Scale bar, 10 μm.
The somata of the second type of amacrine cell (nNOS-2) were 12.0 ± 2.0 μm in diameter (n = 8 cells from 3 retinas) and located in either the INL (∼75% of the sample) or the GCL (∼25% of the sample). nNOS-2 cell processes arborized in the middle of the IPL midway between the upper and lower ChAT bands. We were unable to label nNOS-2 amacrine cells without also labeling nNOS-1 cells. This is most likely because nNOS-1 amacrine cell processes were located closer to the viral entry site and were thus preferential targets for viral infection. However, the layer-specific distribution of these two types allowed us to make a clean separation. Figure 6J shows three nNOS-2 amacrine cells reconstructed from a whole-mount retinal image stack that spanned the IPL. nNOS-2 cells had a simple morphology. A single primary arbor descended vertically to the middle of the IPL and branched into 2–3 straight, thick primary processes (Fig. 6K–M). These processes branched again near the soma and typically spread in two groups of relatively straight arbors running in the opposite directions (Fig. 6J). The arbors were ∼1.5 mm long and strictly monostratified in the middle of the IPL (47 ± 3% of the IPL, SL5; Fig. 6K–M). nNOS-2 cells resemble the previously identified “bifid” cell (Badea and Nathans, 2004). Both nNOS-1 and nNOS-2 cells were GABAergic (Fig. 6G,N).
The SST-ires-Cre driver targets starburst and one type of displaced wide-field amacrine cell
One of the types of amacrine cells identified in the SST-ires-Cre driver line was distributed circumferentially in the retina, and had somata displaced in the GCL. These cells (SST-1) appeared to constitute a single morphological type. A large soma (15.6 ± 2.0 μm diameter, n = 17 cells from 17 retinas) gave rise to 2–3 thick “dendrite-like” processes and one long, fine axon-like process (Fig. 7A–C). The dendrite-like arbors typically branched once and then extended in a zigzag pattern (Fig. 7C). These arbors were 200 μm long and ramified at the GCL border (88 ± 10% of the IPL, SL9–SL10; Fig. 7D). The axon-like arbor and its branches started off near the GCL border (86 ± 9%, SL8–SL10; Fig. 7E), traveled across the width of the IPL with or without an intermediate transition in the middle of IPL (Fig. 7F), and ended by ramifying at the INL border (8 ± 3%, SL1–SL2; Fig. 7G). SST amacrine cells were GABAergic (Fig. 7H), but differed from CRH-2 and nNOS-1 amacrine cells in several ways. First, the soma was located in the retinal periphery instead of being evenly distributed as observed for CRH-2 and nNOS-1 amacrine cells. Second, the axon-like processes covered a smaller area of the retina. Third, and most important, the dendrite-like arbors stratified near the GCL and the long axon-like arbor terminated near the INL, an arrangement opposite to that observed for CRH-2 and nNOS-1 cells. SST-1 amacrine cells do not resemble previously described amacrine cell types (MacNeil and Masland, 1998; Badea and Nathans, 2004; Lin and Masland, 2006).
Figure 7.

Labeling in the SST-ires-Cre and CCK-ires-Cre driver lines. A, A flat-mounted retina with a single-labeled SST-1 amacrine cell. Scale bar, 1 mm. B, Neurolucida tracing of A, with the dendrites and soma drawn in green, the axon-like processes drawn in red, and the outline of the retina marked in white. Scale bar, 1 mm. C, Enlarged view of the boxed region in A. Scale bar, 50 μm. D, The side views with ChAT (blue) of the boxed region in C, including the soma, dendrites, and axon-like processes. Scale bars, 10 μm. E–G, An axon-like process starts near the GCL (E, marked with the yellow arrow in C), extends across the IPL (F, red arrow in A), and finally runs near the INL (G, blue arrow in A). Scale bars, 10 μm. H, The SST-1 amacrine cell is GABAergic. Scale bar, 10 μm. I, The displaced amacrine cells in the CCK-ires-Cre driver are SACs. A GFP-labeled SAC is shown in the flat-mount view (top; scale bar, 50 μm), and the side view with ChAT (bottom; scale bar, 10 μm). J, K, Cre-positive SACs in the GCL (J) and INL (K). A retina from a CCK-ires-Cre × Ai9 mouse was stained with antibody against ChAT. Note that only a fraction of the SACs (labeled with ChAT) express Cre in the CCK-ires-Cre driver line. Scale bars, 20 μm. L, A17 amacrine cells were targeted in the CCK-ires-Cre driver line. An A17 cell was labeled with GFP. The flat-mount view is shown in the top (scale bar, 100 μm) and the side view with ChAT labeling is shown in the bottom (scale bar, 10 μm).
In addition to SST-1 cells, starburst amacrine cells (SACs) were also present in the GCL of the SST-ires-Cre driver. Since SACs are a major amacrine cell type in another Cre driver (CCK-ires-Cre), we will describe this cell type in the next section.
The CCK-ires-Cre driver targets starburst and A17 cells
Although the broad labeling obtained in the Ai9 crosses usually makes cell type identification difficult, the amacrine cells labeled in the CCK-ires-Cre line belonged to well studied classes and were thus easy to identify. A displaced amacrine cell type had the distinctive morphology of SACs (Fig. 7I), which release both GABA and acetylcholine. SACs provide a critical inhibition that underlies the computation of directional selectivity in the retina. Immunostaining with an antibody directed against ChAT showed that 59 ± 9% of the SACs in the GCL and 30 ± 9% SACs in the INL expressed Cre (Fig. 7J,K, n = 667 cells for the GCL, n = 586 cells for the INL, from 6 retinas). This observation suggests that molecular heterogeneity might exist within SACs. Cre-positive SACs accounted for approximately half (45 ± 7%, n = 870 cells from 6 retinas) of the Cre-positive cells in the GCL.
The A17, a well studied amacrine cell type involved in the rod pathway, was also labeled in the CCK-ires-Cre driver line. A17 cells had radial, thin, nonbranching processes (∼400 μm long, n = 5 cells from 5 retinas) with numerous varicosities at regular intervals (Fig. 7L, top). The processes emerged from soma in the INL and descended rapidly to ramify in a band near the GCL (90 ± 2% of the IPL, SL10; Fig. 7L, bottom).
Cre-expression in RGCs
Although the Cre-driver lines were designed to label GABAergic interneurons, we also observed labeling in ganglion cells, which are excitatory projection neurons, in three lines: CRH-ires-Cre, SST-ires-Cre, and CCK-ires-Cre. We proceeded to individually label and characterize the anatomy of these ganglion cells for three reasons: first, to distinguish them from displaced amacrine cells; second, to provide a more complete picture of the inner retinal cells labeled in each line; and, third, to facilitate ganglion cell type-specific manipulations.
Our first step in this characterization was to separate Cre-expressing RGCs from other cell types, especially the wide-field amacrine cells, whose processes might interfere with RGC reconstruction. To accomplish this, we applied two different strategies. First, if ganglion cell labeling was sparse in the Ai9 cross, we focused solely on ganglion cells by crossing each Cre driver line with a Thy1-STOP-YFP mouse line (line 15; Buffelli et al., 2003) instead of the Ai9 reporter line. Thy1-STOP-YFP mice express EYFP under the control of the Thy-1 (mouse thymus cell antigen 1, theta) promoter in a Cre-dependent manner. Thy-1 is predominantly expressed in the axons of mature neurons. In the retina, immunohistochemistry shows that 70% of the Thy-1 label colocalizes with RGCs, whereas the rest colocalizes with amacrine and bipolar cells (Perry et al., 1984). Usually, expression of EYFP is blocked by a loxP-flanked STOP cassette inserted between the promoter and the EYFP gene. However, when crossed with Cre drivers, Cre-mediated recombination between loxP sites results in excision of the STOP cassette and subsequent expression of EYFP. We expected that breeding each Cre driver into a Thy1-STOP-YFP 15 background would lead to an expression of EYFP that is largely confined to ganglion cells. Second, if ganglion cell labeling was dense, we injected eyes with rAAV encoding for a floxed TVA and then transduced RGCs from their axonal terminals in a retino-recipient zone with EnvA-SADΔG-GFP, without infecting amacrine and other cell types in the retina.
As expected, crossing into a Thy1-STOP-YFP background removed most labeled amacrine cells from each Cre-driver line. In fact, two lines, VIP-ires-Cre and nNos-ires-CreER, no longer contained labeled cells, in agreement with a restricted expression of Cre to amacrine cells. In the CRH-ires-Cre, SST-ires-Cre, and CCK-ires-Cre driver lines, most amacrine cell labeling disappeared, whereas RGC labeling persisted (Fig. 8A). Among these three driver lines, the CRH-ires-Cre line displayed the sparsest labeled RGCs, the structures of which could be analyzed without further isolation. Both the CCK-ires-Cre and SST-ires-Cre driver lines had densely labeled RGCs that required further segregation. Since SST-RGCs appear to comprise a large number of cell types, we focused our analysis on the CRH-RGCs and CCK-RGCs. Our classification of RGCs was based on four parameters: soma size, dendritic stratification, dendritic field size in both the ON and OFF sublaminae, and the symmetry of the dendritic field. These parameters were quantitatively compared with previous publications before cell types were assigned.
Figure 8.

Cre-expressing RGCs in the CRH-ires-Cre driver line. A, Strategy for isolating Cre-expressing RGCs. Each Cre driver line was crossed with a Thy1-STOP-YFP 15 line (top). EYFP-labeled RGCs were observed in the CRH-ires-Cre, CCK-ires-Cre, and SST-ires-Cre lines, with flat-mount views shown in the middle (scale bar, 50 μm), and side views with ChAT (blue) shown in the bottom (scale bar, 10 μm). B, A flat-mount retina from a CRH-ires-Cre × Thy1-STOP-YFP 15 mouse. Scale bar, 100 μm. C–F, Morphology of different types of CRH-RGCs. Flat-mount views are shown in the top (scale bar, 50 μm), and side views with ChAT (blue) are shown in the bottom (scale bar, 20 μm). G, Coronal view of CRH-RGC axonal projections within the retino-recipient zone of the SC (left) and the dLGN (right). All the RGC axons from both eyes were labeled with CTb-594 (red); CRH-RGC axons were labeled with GFP (green). Scale bar, 200 μm.
RGC subtypes in the CRH-ires-Cre driver line
In the CRH-ires-Cre driver line, RGCs comprised 8 ± 2% of Cre-positive cells (Fig. 1C). Breeding into a Thy1-STOP-YFP 15 background efficiently removed labeling in many amacrine cells and increased the proportion of labeled RCGs to 48 ± 7% (n = 638 cells from 8 retinas). EYFP-labeled RGCs were spaced far enough apart for us to perform single-cell reconstruction (Fig. 8B).
CRH-RGCs can be classified into three morphological types. More than 75% of CRH-RGCs (named CRH-1 RGCs) had large somata (21.1 ± 2.4 μm, n = 17 cells from 5 retinas) and dendritic fields (294 ± 33 μm). The soma produced 3–7 primary dendrites that branched at acute angles (Fig. 8C,D, top). Detailed morphological analysis suggests that two subtypes may exist in this CRH-1 RGC population. One type stratified in SL4 (37 ± 1% of the IPL; Fig. 8C, bottom), whereas the other type stratified in both SL4 and SL1–SL2 (Fig. 8D, bottom). The CRH-1 RGCs strongly resemble W7 RGCs (Kim et al., 2010) and functional OFF-αRGCs (Pang et al., 2003), corresponding to A2 (Sun et al., 2002), cluster 7 (Badea and Nathans, 2004), cluster 10 (Kong et al., 2005), M9 (Coombs et al., 2006), G3 (Völgyi et al., 2009), and tOFF-αRGCs in CB2-GFP mice (Huberman et al., 2008).
The second population of CRH-RGCs (CRH-2 RGCs) was highly asymmetric, with structural features strongly resembling JAM-B RGCs (Kim et al., 2008). Somata were relatively small (12.4 ± 1.2 μm, n = 11 cells from 5 retinas), and all of the dendrites lay on the ventral side of the soma and pointed in a ventral direction with a slight nasal bias (Fig. 8E, top). The soma gave off 1–2 primary dendrites that branched a few times in the middle of the IPL before further branching and terminating between SL2 and SL3 (14 ± 3% of the IPL; Fig. 8E, bottom).
The third population (CRH-3 RGCs) shared similarities with CRH-2 RGCs, in that both had asymmetric dendritic arbors pointing in the ventral direction (Fig. 8F, top). However, several major differences existed between the two subtypes. First, CRH-3 RGCs had much larger somata (20.5 ± 3.6 μm, n = 11 cells from 5 retinas). Second, the area of the CRH-3 RGC dendritic field (∼58,000 μm2) was three times larger than that of the CRH-2 RGC (∼19,000 μm2). Third, the CRH-3 RGC stratified within a narrow band in SL4 (37 ± 3% of the IPL; Fig. 8F, bottom), below the stratum where CRH-2 RGC dendrites resided.
CRH-RGC axon terminals projected to the deep regions of the retino-recipient zones in both the SC and dLGN (Fig. 8G). To label the RGC axon terminals in the brain, we injected the eyes with rAAV2 carrying Cre-dependent GFP (rAAV2(YF4)-CBA-DIO-GFP). We injected CTb-594 in the same eye to mark the entire retino-recipient zone. Notably, a majority of the GFP-labeled axons originated from CRH-1 RGCs (presumably OFF-αRGCs), which make up >75% of CRH-RGCs (CRH-2 and CRH-3 RGCs make up the remaining 25%). Therefore, in addition to the soma and dendritic morphology, the axonal projection pattern of this type of CRH-RGC was also consistent with OFF-αRGCs (Huberman et al., 2008; Kim et al., 2010).
RGC subtypes in the CCK-ires-Cre driver line
In CCK-ires-Cre × Thy1-STOP-YFP XV mice, EYFP-labeled RGCs were so dense that almost every cell had dendritic arbors that overlapped with neighbors. To achieve a sparser labeling of RGCs, we returned to the EnvA-SADΔG-GFP labeling strategy. In this case, however, we injected EnvA-SADΔG-GFP into the retino-recipient regions (SC or LGN) instead of the eyes (Fig. 9A). This strategy allows TVA-expressing RGCs to take up EnvA-SADΔG-GFP through their axonal terminals and removes the opportunity for labeling of other retinal cell types. As before, the density of labeled RGCs was controlled by adjusting the doses of rAAV2(YF4)-CBA-DIO-TVA and EnvA-SADΔG-GFP. As expected, 6 d after EnvA-SADΔG-GFP injection, RGCs were exclusively labeled with GFP at a low density, allowing for single-cell reconstruction (Fig. 9B). Close examination revealed three subtypes of GFP-labeled RGCs: two bistratified and one monostratified. No differences in the RGC labeling pattern were observed between the SC and LGN injections.
Figure 9.

Cre-expressing RGCs in the CCK-ires-Cre driver line. A, Strategy using rAAV/EnvA rabies virus to label CCK-RGCs from axonal terminals. B, GFP-labeled CCK-RGCs in a flat-mount retina from a CCK-ires-Cre mouse. Scale bar, 100 μm. C–F, Morphology of different types of CCK-RGCs. Flat-mount view of each type of RGC (green) are shown in the top, with soma and ON arbors labeled in green and OFF arbors pseudocolored in red. Scale bar, 50 μm. Side views with ChAT-band (blue) are shown in the bottom. Scale bars, 20 μm. G, Coronal view of CCK-RGC axonal terminals in the SC, the dLGN, and the vLGN. All RGC axons from both eyes are labeled with CTb-594 (red); CCK-RGC axons are labeled with GFP (green). Scale bar, 200 μm.
The most abundant CCK-RGCs (named CCK-1 RGCs; 70% of the sample, n = 28 cells from 8 retinas) were small bistratified RGCs. Their dendritic arbors were positioned at 67 ± 4% (SL7–SL8) and 18 ± 6% (SL2–SL3) of the IPL, and partially overlapped with the ChAT-positive bands (Fig. 9C, bottom). Compared with the ON-OFF direction-selective ganglion cells (DSGCs) described below, this type of RGCs has a smaller dendritic field and more broadly stratified dendritic arbors that extend closer to the nuclear layers (INL and GCL). Notably, ∼50% of the processes in the ON layer originated from dendrites that had already traveled down to the OFF layer and then climbed back to the ON layer. This structural arrangement led to a “broken” appearance in the flat-mount view as well as many crossing branches in the side view (Fig. 9C). These unique morphological features bear a strong resemblance to the recently identified s-BGCs in a PCP2-Cre mouse line (Ivanova et al., 2013).
The second most abundant CCK-RGCs (CCK-2 RGCs; 20% of the sample, n = 12 cells from 8 retinas) were the well characterized ON-OFF DSGCs. The ON and OFF dendrites arborized at 61 ± 3% (SL6–SL7) and 29 ± 4% (SL3–SL4) of the IPL, respectively, completely costratifying with the ChAT-positive bands (Fig. 9D,E, bottom). The dendritic arbors could be symmetric (Fig. 9D, top), or asymmetric (Fig. 9E, top). The symmetric RGCs have similar sizes of ON and OFF dendritic fields. In the asymmetric cells, the OFF dendritic field was 80% larger than the ON field (Table 3). The dendrites in asymmetric RGCs pointed in the ventral direction, consistent with BD-RGCs (Kay et al., 2011b) and Hb9+ DSGCs (Trenholm et al., 2011).
Table 3.
Summary of RGC types in Cre driver lines
| Cre driver | Cell type | Soma diameter (μm) | Dendritic field diameter (μm) | Symmetry index | Dendritic stratification (% in IPL) |
|---|---|---|---|---|---|
| CRH | CRH-1 RGCa (n = 17 from 5 retinas) (OFF-αRGC) | 21.1 ± 2.4 | 294 ± 33 | 0.09 ± 0.05 | 37 ± 1 (off) |
| CRH | CRH-2 RGCb (n = 11 from 5 retinas) (JAM-B RGC) | 12.4 ± 1.2 | 177 ± 32 | 0.45 ± 0.02 | 14 ± 3 (off) |
| CRH | CRH-3 RGC (n = 11 from 5 retinas) | 20.5 ± 3.6 | 247 ± 31 | 0.33 ± 0.07 | 37 ± 3 (off) |
| CCK | CCK-1 RGCc (n = 28 from 8 retinas) (S-BGC) | 15.6 ± 2.2 | 192 ± 35 (on) | 0.09 ± 0.06 (on) | 67 ± 4 (on) |
| 161 ± 28 (off) | 0.10 ± 0.05 (off) | 18 ± 6 (off) | |||
| CCK | CCK-2 RGCd (n = 12 from 8 retinas) DSGC (Symm) | 17.9 ± 3.3 | 268 ± 80 (on) | 0.13 ± 0.06 (on) | 61 ± 3 (on) |
| 254 ± 69 (off) | 0.08 ± 0.07 (off) | 29 ± 4 (off) | |||
| CCK | CCK-2 RGCe (n = 11 from 8 retinas) BD-RGC | 17.9 ± 3.4 | 194 ± 53 (on) | 0.37 ± 0.08 (on) | 61 ± 2 (on) |
| 268 ± 39 (off) | 0.29 ± 0.09 (off) | 28 ± 2 (off) | |||
| CCK | CCK-3 RGCf (n = 10 from 8 retinas) (ON-αRGC) | 18.6 ± 6.6 | 343 ± 82 | 0.07 ± 0.04 | 83 ± 5 (on) |
Data are presented as mean ± SD. Equivalent cells are indicated in footnotes a–f.
aW7 RGCs (Kim et al., 2010); OFF-αRGCs (Pang et al., 2003); A2 (Sun et al., 2002); cluster 7 (Badea and Nathans, 2004); cluster 10 (Kong et al., 2005); M9 (Coombs et al., 2006); G3 (Volgyi et al., 2009); tOFF-αRGCs in CB2-GFP mice (Huberman et al., 2008).
bJAM-B RGCs (Kim et al., 2008).
cs-BGCs (Ivanova et al., 2013).
dD2 (Sun et al., 2002); Bistratified cluster 2 (Badea and Nathans, 2004); M12 and M13 (Coombs et al., 2006); G17 (Volgyi et al., 2009).
eBD-RGCs (Kay et al., 2011); Hb9 + DSGCs (Trenholm et al., 2011).
fON-αRGCs (Pang et al., 2003).
The third type of RGC in the CCK-ires-Cre driver line (CCK-3 RGCs, 10% of the sample, n = 10 cells from 8 retinas) was a type of monostratified cell with a large dendritic field (∼340 μm in diameter). CCK-3 RGCs had 4–7 smooth primary dendrites that branched without overlapping (Fig. 9F, top). The dendrites were monostratified and occupied a narrow band at 83 ± 5% of the IPL (SL8–SL9; Fig. 9F, bottom). These morphological features strongly resemble those of ON-αRGCs in mice (Pang et al., 2003).
The axons of CCK-RGCs projected to retino-recipient zones in the SC, dLGN, and vLGN (ventral lateral geniculate nucleus; Fig. 9G), as well as the nucleus of optic tract, medial terminal nucleus, and dorsal terminal nucleus (data not shown). In the SC, vLGN, and dLGN, robust GFP-labeled terminals were observed in a thin superficial layer. In this study, we restricted our retrograde labeling of RGCs to the SC and LGN. Since 70–100% of RCGs project to the SC (Hofbauer and Dräger, 1985), it is likely that we labeled all the Cre-positive RCG types. However, we cannot exclude the possibility that some RCGs do not project to either the SC or LGN, in which case these neurons would not be retrogradely labeled by our injections.
Evaluation of the completeness of labeling of Cre-positive cell types
Our next step was to verify whether the virus-identified cell types represent most or all of the Cre-expressing cell types in these driver lines. To evaluate the completeness of labeling, we crossed each Cre driver line with the Ai9 reporter mice and measured the distributions of tdTomato-labeled (i.e., Cre-positive) soma diameters. We next determined whether the cell types identified with rAAV/EnvA rabies virus (or Thy1-STOP-YFP 15 crossing for CRH-RGCs) were representative of the same distributions. In addition, for Cre driver lines that had labeling in discrete IPL strata, we compared the labeled strata in Cre × Ai9 crosses with those of cells labeled with rAAV/EnvA rabies virus. Although unlikely, it is possible, that this analysis would not distinguish between two amacrine or ganglion cell types with nearly the same soma size and dendrite stratification level.
To simplify the analysis, we first sorted tdTomato-labeled cells in Cre × Ai9 mice into two populations, GABAergic (presumptive amacrine cells) and non-GABAergic, by labeling the retina with an antibody against GABA. The non-GABAergic cells were presumed to be RGCs insofar as immunohistochemistry showed that they also lacked glycine (data not shown), another amacrine cell transmitter. In two lines, VIP-ires-Cre and nNOS-ires-CreER, nearly all tdTomato-labeled cells were GABAergic (Fig. 10A,B), consistent with the restricted expression of Cre to amacrine cells. In the INL of the VIP-ires-Cre driver (n = 154 cells from 4 retinas), and separately in the GCL (n = 330 cells from 4 retinas) and INL (n = 402 cells from 4 retinas) of the nNOS-ires-CreER driver, the soma diameters were well fitted with single Gaussian distributions, each with a mean and SD similar to those obtained from neurons labeled by rAAV/EnvA rabies virus in the same lines (Fig. 10A,B, Tables 2, 4). In addition, in the VIP-ires-Cre driver, vertical sections showed that the strata labeled in the Ai9 cross occupied two major bands (SL1–SL3 and SL6–SL8), similar to the virus-labeled VIP-1 amacrine cell (Fig. 5, Table 2). Thus, the rAAV/EnvA rabies virus may label all of the Cre-positive amacrine cell types in the VIP-ires-Cre and nNOS-ires-CreER lines.
Figure 10.
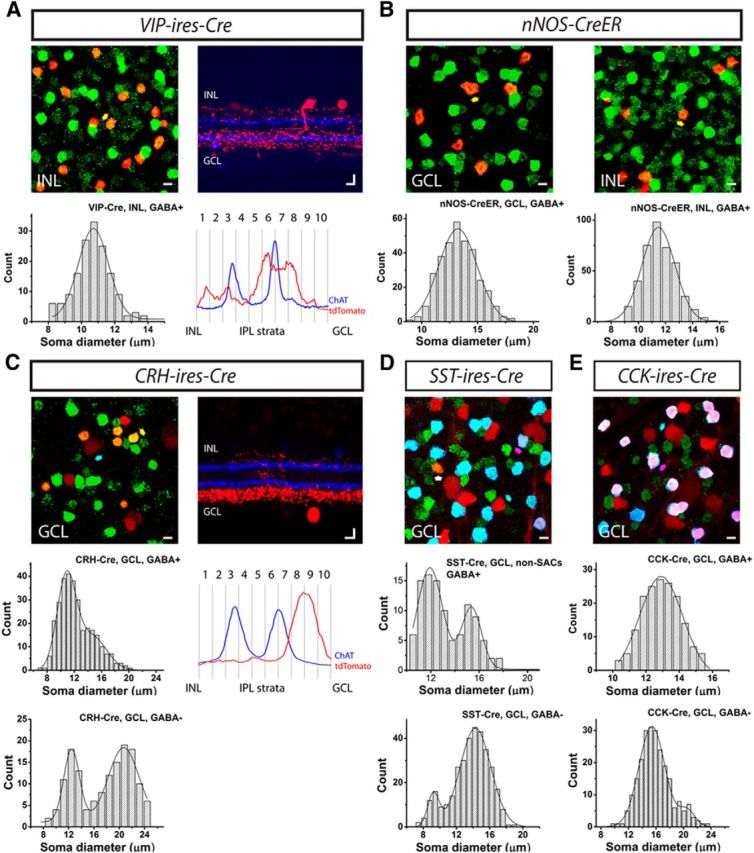
Evaluation of the completeness of labeling in Cre driver lines based on soma diameter and level of dendritic stratification. A–E, Five Cre driver lines, including VIP-ires-Cre (A), nNOS-ires-CreER (B), CRH-ires-Cre (C), SST-ires-Cre (D), and CCK-ires-Cre (E), were crossed with Ai9 reporter mice (tdTomato; red), and the retinas were further stained with an antibody against GABA (green). A, B, All tdTomato-labeled cells were GABAergic (GABA+; yellow arrow shows an example of somatic colocalization). C–E, In addition to GABAergic cells (yellow arrow), non-GABAergic cells (GABA−; cyan arrow) were also observed, with somata labeled with tdTomato, but not GABA. D, E, GABAergic cells were further separated with an antibody against ChAT (blue). Cells labeled with tdTomato, GABA, and ChAT were SACs (pink arrow), whereas cells labeled with tdTomato and GABA but not ChAT were non-SAC GABAergic cells (white arrow). Evidently, all of the GABAergic cells in the CCK-ires-Cre retina were SACs. The soma diameters of GABAergic cells (A–C) in the INL (A), GCL and INL (B), and GCL (C), and non-GABAergic cells (C–E), SACs (E), and non-SAC GABAergic cells (D) in the GCL were measured and plotted as distribution histograms. The histograms were fitted with either single or double Gaussian curves (see Table 3 for fit parameters). The non-GABAergic cells (presumptive RGCs) in the SST-ires-Cre line (D) were omitted from our classification due to the high abundance of labeled cell types, but their soma sizes were analyzed here for completeness. The IPL strata in the VIP-ires-Cre and CRH-ires-Cre were further analyzed in A and C. Vertical slices of the retinas were stained with an antibody against ChAT (blue), and 10 strata in the IPL were defined using the ChAT bands. Stratification of tdTomato-labeled arbors was quantified relative to the ChAT. Scale bar, 10 μm.
Table 4.
Comparison of cell types estimated from soma analysis and identified with rAAV/EnvA rabies virus or Thy1-STOP-YFP 15 crossing
| Cre driver | GABA expression | Fitting, number of Gaussians | Soma diameters from the fit (μm) | Corresponding cell types |
|---|---|---|---|---|
| CRH | GABAergic (ACs) | Two | 10.8 ± 2.8 | CRH-1 AC |
| 14.5 ± 4.4 | CRH-2 AC | |||
| (p = 1.00, χ2 test) | ||||
| CRH | non-GABAergic (RGCs) | Two | 12.5 ± 2.5 | CRH-2 RGC |
| 20.7 ± 4.9 | CRH-1 RGC & CRH-3 RGC | |||
| (p = 0.98, χ2 test) | ||||
| VIP | GABAergic (ACs) | One | 10.7 ± 1.8 | VIP-1 AC |
| (p = 1.00, χ2 test) | ||||
| nNOS | GABAergic (GCL) | One | 13.2 ± 3.4 | nNOS-1 AC |
| (p = 0.84, χ2 test) | ||||
| nNOS | GABAergic (INL) | One | 11.5 ± 2.4 | nNOS-2 AC |
| (p = 0.80, χ2 test) | ||||
| SST | non-SAC GABAergic (ACs) | Two | 11.9 ± 2.1 | N.O. |
| 15.4 ± 1.6 | SST-1 AC | |||
| (p = 0.99, χ2 test) | ||||
| SST | non-GABAergic (RGCs) | Two | 9.2 ± 1.4 | NA |
| 14.3 ± 3.7 | ||||
| (p = 0.99, χ2 test) | ||||
| CCK | GABAergic (ACs) | One | 12.9 ± 2.3 | SAC |
| (p = 0.98, χ2 test) | ||||
| CCK | non-GABAergic (RGCs) | Two | 15.4 ± 3.7 | CCK-1 RGC |
| 20.5 ± 2.3 | CCK-2 RGC & CCK-3 RGC | |||
| (p = 1.00, χ2 test) |
rAAV injections were performed on 5- to 6-week-old mice. Data are presented as mean ± SD. ACs, Amacrine cells; NA, not applicable; N.O., not observed.
In three other lines, CRH-ires-Cre, SST-ires-Cre, and CCK-ires-Cre, Cre expression was localized to both GABAergic and non-GABAergic cells (Fig. 10C–E), consistent with Cre expression in both amacrine cells and RGCs. In the CRH-ires-Cre driver, the soma diameters of the GABAergic cells were well fitted with two Gaussian functions which had peak diameters that closely matched those of CRH-1 and CRH-2 amacrine cells (Fig. 10C, n = 306 cells from 5 retinas; Tables 2, 4). The soma diameters of the non-GABAergic cells (Fig. 10C, n = 146 cells from 5 retinas; Tables 2, 4) in the CRH-ires-Cre driver were separated into two distinct populations, one small (peak diameter = 12.5 ± 2.5 μm), corresponding to CRH-2 RGCs (Fig. 8E, Tables 3, 4) and the other large (20.7 ± 4.9 μm), likely corresponding to a mixture of CRH-1 and CRH-3 RGC somata (Fig. 8C,D,F, Tables 3, 4). In cross section, the retina showed a major band in SL8–SL9 of the IPL (Fig. 10C), in line with the strong expression of Cre in CRH-1 and CRH-2 amacrine cells. A sparse arbor distribution in the outer half of the IPL was most likely due to RGC dendrites. Therefore, both the soma and strata analyses suggest that we may have identified all the cell types in the CRH-ires-Cre driver.
In the SST-ires-Cre and CCK-ires-Cre drivers, GABAergic cells comprised, respectively, 25 ± 6% (n = 710 cells from 6 retinas) and 45 ± 7% (n = 870 cells from 6 retinas) of the total cells in the GCL. In both lines, we observed Cre expression in SACs in the GCL. To further simplify our analysis, we separated the GABAergic cells into SACs and non-SACs by labeling with an antibody against ChAT. All of the GABAergic cells in the GCL of the CCK-ires-Cre driver were SACs (n = 168 cells from 5 retinas). The non-GABAergic cells (n = 237 cells from 5 retinas) in this line contained two populations, suggested by a distribution of soma diameters that were well fitted by two Gaussian functions. The larger population of cells (91 ± 3%, n = 216 cells) had a diameter of 15.4 ± 3.7 μm, whereas the remaining cells (9 ± 2%, n = 21 cells) could be grouped into a population with a diameter of 20.5 ± 2.3 μm. The soma diameter of the first population is in agreement with that found for the CCK-1 RGCs (Fig. 9C, Tables 3, 4), which were the most abundant RGCs in our classification. The second population matched a mixture diameter of the CCK-2 and CCK-3 RGC somata (Fig. 9D–F, Tables 3, 4). Therefore, three RGC types identified by retrograde labeling from the SC and LGN could explain the two peaks in the distribution of GABA-lacking RGCs.
In the SST-ires-Cre driver, the GCL contained both SACs (68% of the GABAergic cells) and non-SAC GABAergic cells (32% of the GABAergic cells; n = 334 cells from 6 retinas). The somata of non-SAC GABAergic cells (n = 107 cells from 6 retinas) showed a distribution that was fitted with two Gaussians. One Gaussian peak had a diameter of 15.4 ± 1.6 μm, corresponding to that of the SST-1 amacrine cells (Fig. 7A-G, Tables 2, 4). The remaining non-SAC GABAergic cells had a soma diameter of 11.9 ± 2.1 μm. Our viral strategy did not label an amacrine cell type with a soma diameter in the range of 11.9 μm and, thus, at least one cell type may be absent from our viral classification. In summary, our rabies virus-based cell type characterization identified most of the Cre-expressing cells in three driver lines, CRH-ires-Cre, VIP-ires-Cre, and nNOS-ires-CreER, and in the GCL layer of a fourth, CCK-ires-Cre driver line. In addition, our approach identified most of the displaced amacrine cells in the fifth SST-ires-Cre driver line.
The rAAV/EnvA rabies virus approach identifies specific cell types in other brain regions
The Cre driver lines analyzed in this study were originally designed to target cortical GABAergic neurons (Taniguchi et al., 2011). To verify that the rAAV/EnvA rabies virus approach can be used to sparsely label and identify specific cell types in the cerebral cortex and other brain regions, we used our approach on the CCK-ires-Cre and SST-ires-Cre drivers and focused on five regions: M1, S1, V1, LGN, and SC. First, rAAV2(YF4)-CBA-DIO-TVA was injected into each brain region in double-transgenic Cre driver × Ai9 mice. Three weeks after rAAV injection, EnvA-SADΔG-GFP was injected into the same site. The brain was examined 7 d later. We verified the targeted expression of GFP in Cre-expressing cells by observing somatic coexpression of GFP and tdTomato. As in the retina, there was an optimal viral dose for sparse neuronal labeling that varied with Cre driver line and brain region (Table 1). For the CCK-ires-Cre driver, sparse labeling was routinely achieved when 1.5 × 10⁹ genome copies of rAAV and 300 IU of EnvA-SADΔG-GFP were injected into M1, S1, V1, and SC. To label the same brain regions in the SST-ires-Cre driver required the same amount of rAAV (1.5 × 10⁹ genome copies) combined with tenfold less EnvA-SADΔG-GFP (30 IU). On the other hand, to label LGN in both CCK-ires-Cre and SST-ires-Cre drivers, a higher dose of EnvA-SADΔG-GFP (3 × 10³ IU) was required when 1.5 × 10⁹ genome copies of rAAV were injected. Under the appropriate conditions, single-cell morphology could be routinely revealed in each brain region (Fig. 11).
Figure 11.

rAAV/EnvA rabies virus labels individual cells in the cerebral cortex and other brain regions. rAAV2(YF4)-CBA-DIO-TVA (1.5 × 10⁹ genome copies) and EnvA-SADΔG-GFP were injected into M1, S1,V1, LGN, and SC in two Cre drivers crossed with the Ai9 reporter: CCK-ires-Cre × Ai9 and SST-ires-Cre × Ai9. The doses of EnvA-SADΔG-GFP injected into each region were: 300 IU for M1, S1, V1, and SC in CCK-ires-Cre driver; 30 IU for M1, S1, V1, and SC in SST-ires-Cre driver; and 3 × 10³ IU for the LGN in both drivers. Cre expression in each region is revealed by tdTomato labeling (red); GFP labeling of individual cells is shown in green. Insets, Coexpression of GFP (green) and tdTomato (red) in the somata. Scale bars, 100 μm.
rAAV/EnvA rabies virus facilitates cell type-specific functional imaging and optogenetic manipulation
We have so far used the rAAV/EnvA rabies virus strategy to label individual neurons for anatomical characterization. However, the large capacity of the rabies virus genome (∼10 kb) makes it suitable for expressing a wide range of genetic and optogenetic tools (Osakada et al., 2011). To test the feasibility of using the rAAV/EnvA rabies virus approach for functional studies, we replaced GFP with either a genetically encoded calcium indicator, GCaMP3 (Tian et al., 2009; Borghuis et al., 2011; Yonehara et al., 2013), or an optogenetic protein, ChR2-venus (Boyden et al., 2005; Petreanu et al., 2009).
We expressed GCaMP3 in both the amacrine and ganglion cells by making sequential intravitreal injections of rAAV2(YF4)-CBA-DIO-TVA and EnvA-SADΔG-GCaMP3 in the CRH-ires-Cre and CCK-ires-Cre driver lines (Fig. 12A–D). Light responses were elicited by a 565 nm LED flash (200 ms), and fluorescence responses were imaged with a two-photon microscope. Strong fluorescence responses were detected in both the soma and proximal processes of CRH-2 amacrine cells (Fig. 12A). The fluorescence transients were faster in the proximal processes compared with the soma, reflected by both the times to peak (Fig. 12B) and decay time constants (Fig. 12C). The light stimulus also evoked fluorescence transients in the somata of CCK-RGCs (Fig. 12D).
Figure 12.
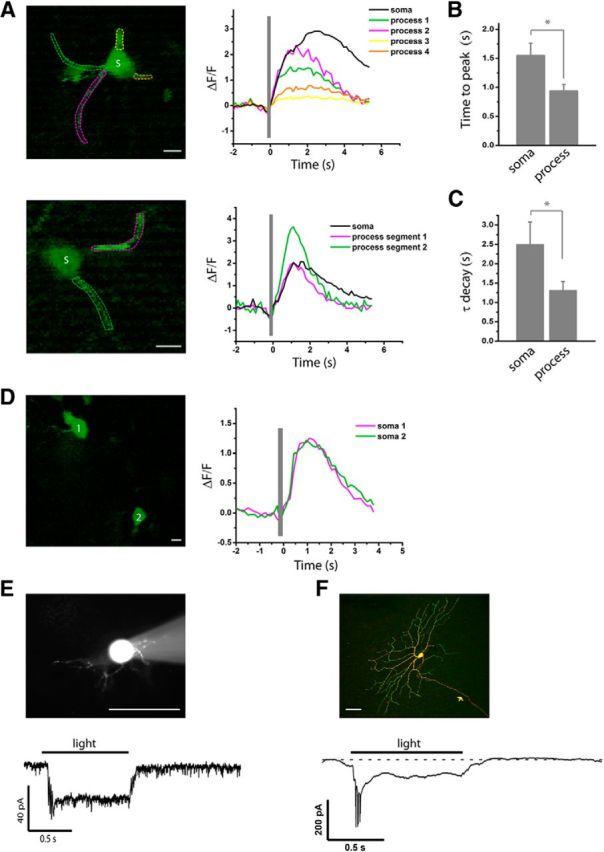
rAAV/EnvA rabies virus-mediated expression of GCaMP3 and ChR2 permits cell type-specific functional imaging and optogenetic manipulation in the retina. GCaMP3 or ChR2-venus was delivered to the retina by intravitreal injection of rAAV2(YF4)-CBA-DIO-TVA followed by either EnvA-SADΔG-GCaMP3 or EnvA-SADΔG-ChR2-venus. A–D, Light-evoked GCaMP3 responses recorded from Cre-expressing amacrine and ganglion cells. The visual stimulus was a brief light flash (timing shown by the gray bar). The fluorescence responses of the calcium indicator were imaged with a two-photon microscope. A, Light-evoked GCaMP3 responses recorded from the somas (S) and proximal processes of two CRH-2 amacrine cells. Regions of interest are marked by colored dashed lines, with corresponding traces presented in the same color. B, C, Comparison of rise (B) and decay (C) kinetics of GCaMP3 responses recorded from the soma and proximal processes of three CRH-2 amacrine cells including the two cells shown in A. Time to peak is measured from the end of light flash to the peak of fluorescence response. Decay time constant is calculated from a single exponential fit to each response. Data are presented as mean ± SEM (n = 3 for soma and n = 8 for process), *p < 0.05. D, Light-evoked GCaMP3 responses recorded from the somas of two CCK-RGCs. E, F, ChR2 enables light-controlled activation of Cre-expressing amacrine and ganglion cells. E, Sustained inward current recorded from a ChR2-positive CRH-1 amacrine cell (shown with sulforhodamine 101 fill during whole-cell recording) in response to a 470 ± 20 nm light stimulus (duration indicated by the horizontal bar). F, Current spikes followed by a sustained inward current recorded in a ChR2-positive CRH-RGC in response to the stimulus. The cell is shown with antibody staining after whole-cell recording and fixation. Green, ChR2-venus; red, Neurobiotin fill; arrow, RGC axon. For both E and F, the stimulus intensity was 3.05 W-cm−2. The currents were recorded in voltage clamp at a holding potential of −70 mV. The holding current in E was −31.5 pA and in F was −6.2 pA. Traces are averages of 3 or more responses. Scale bars: A, D, 10 μm; E, F, 50 μm (n = 8 cells from 3 mice for E and F).
The feasibility of using EnvA-ChR2-venus to manipulate the membrane voltage of specific cell types was tested in the Cre-expressing amacrine and ganglion cells in the CRH-ires-Cre driver. Intravitreal injection of rAAV2(YF4)-CBA-DIO-TVA followed by EnvA-SADΔG-ChR2-venus resulted in sparse labeling of multiple cell types. Illumination of ChR2-positive CRH-1 amacrine cells (Fig. 12E) and CRH-RGCs (Fig. 12F) with blue light briskly induced steady inward currents in both types.
The results show that rAAV/EnvA rabies virus-mediated expression of GCaMP3 and ChR2 can be used to monitor and manipulate neural activity in specific cell types.
Discussion
The use of Cre drivers in combination with either floxed reporter lines or viral delivery has revolutionized the study of neuronal processing by enabling the manipulation of specific neuron populations. With numerous Cre driver lines generated by individual laboratories and GENSAT (Gene Expression Nervous System Atlas), there is a need to characterize the cell type-specific patterns of Cre expression throughout the nervous system. Since the brain contains large numbers of cell types, even specific promoters usually target Cre expression to multiple cell types. Manipulations that involve several neuron types at once are less experimentally useful than those confined to a single type. Thus, it is important not only to screen Cre-driver lines to determine the labeled neuron types, but to develop methods to restrict labeling from several types to one.
Comparison with other approaches
We demonstrate that, in addition to its use in monosynaptic-transsynaptic tracing, EnvA-pseudotyped rabies is useful for cell type-specific labeling. Our approach to labeling individual neuron types in living tissue offers several advantages over the traditional methods of intracellular tracer injection and newer rAAV approaches. Like tracer injection, EnvA-pseudotyped rabies produces labeling of individual cells with a high signal-to-background ratio. However, unlike tracer injection, a genetic approach provides a consistent supply of neurons belonging to a single type, and does so with minimal labor beyond that required to breed mice and inject eyes. In addition, due to strong expression and long equilibration time, EnvA-pseudotyped rabies fills the entire neuron, including very thin neurites, whereas tracer injection can lead to an incomplete fill. Newer rAAV approaches can produce brightly labeled cells with relatively little effort. However, because the rAAV genome does not replicate in cells (Deyle and Russell, 2009), efforts to produce sparse labeling by reducing rAAV titer may also result in decreased labeling intensity, assuming a relationship between cell transduction number and expression level. In contrast, EnvA-pseudotyped rabies virus retains the ability to replicate its genome; thus, robust labeling can still be achieved in an infected neuron when only one or a few viral particles are present. The ability to obtain robust yet sparse labeling proved critical for delineating the processes of individual wide-field amacrine cells, which can span the entire retina.
Limitations of the rAAV/EnvA rabies virus approach
A potential limitation of the rAAV/EnvA rabies virus approach is that labeling requires that both viruses have access to the target cell. Accessibility may be limited by virus size and penetration properties, neuron distance from the inner limiting membrane at the vitreal surface of the retina, and a recognition mismatch in the case of rAAV between the virus and the targeted cell. In fact, we were unable to label subsets of Cre-expressing amacrine cells in the INL in three lines, including CRH-ires-Cre, SST-ires-Cre, and CCK-ires-Cre. Since most Cre-expressing amacrine cells were located in the GCL in these three lines, the error produced by decreased access to INL somata is likely small. Future modifications of viral capsid proteins to produce better penetration (Dalkara et al., 2013) and recognition could extend the approach to cell types that currently cannot be revealed by rAAV/EnvA rabies virus.
Identification of amacrine cell types
An unbiased, large-scale characterization of amacrine cells was first performed by MacNeil and Masland (MacNeil and Masland, 1998; MacNeil et al., 1999) in the rabbit retina with a photofilling technique. Subsequently, Badea and Nathans (2004) systematically surveyed amacrine cells in the mouse retina by randomly delivering a genetically directed alkaline phosphatase. This latter approach has been enormously useful for identifying rare cell types including wide-field amacrine cells. Later, Lin and Masland (2006) surveyed wide-field amacrine cells in a transgenic mouse strain that expressed GFP in a variety of retinal cells. Together, these studies revealed that amacrine cells are the most diverse class of neurons in the retina, comprising as many distinct types as in the rest of the retina combined. This heterogeneity has impeded the study of function because, except for a few types (e.g., the AII, A17, dopaminergic, and starburst amacrine cells), it has been difficult to repeatedly recognize and target cells for recording based on morphological criteria. The need for cell type-specific markers is especially acute for wide-field amacrine cells, which have broad ramifications, low abundance, and deeply buried cell bodies that are poorly accessible to whole-cell recording.
To date, only a handful of Cre driver lines targeting amacrine cells have been reported, including a ChAT-cre/Jax line with labeled SACs (Ivanova et al., 2010), a Neurod6-Cre line with labeled nGnG (neither glycinergic nor GABAergic) amacrine cells (Kay et al., 2011a), and a VGLUT3-cre line with labeled VGLUT3+ amacrine cells (Grimes et al., 2011). We characterized the amacrine cell expression patterns in nine newly developed Cre lines (Taniguchi et al., 2011) that used promoters for neuropeptides, transcription factors, and transmitter pathway enzymes that are commonly found in GABAergic interneurons. We identified two new types of amacrine cells, a medium-field CRH-1 and a wide-field SST-1, and several wide-field amacrine cells that have been described but not systematically studied due to a lack of genetic markers: CRH-2 (nNOS-1), VIP-1, and nNOS-2. We showed that the CRH-1 is an asymmetric medium-field amacrine cell that is monostratified near the GCL border (Yeh and Olschowka, 1989). Medium-field amacrine cells typically have diffuse dendrites spanning several strata in the IPL and thus probably participate in “vertical integration” (MacNeil and Masland, 1998; Roska and Werblin, 2001). The horizontally spanning morphology of the CRH-1 amacrine cells suggests that it might perform a different computation versus other medium-field amacrine cells. In contrast to medium-field cells, wide-field amacrine cells are hypothesized to modulate retinal processing in a global fashion. Wide-field amacrine cells can be divided into two groups, axonless and axon-bearing (or polyaxonal). Here, we identified two axonless wide-field amacrine cells: VIP-1 and nNOS-2. The other two amacrine cell types, CRH-2 (nNOS-1) and SST-1, have long-range axon-like processes that covered a large portion of the retina. In agreement with previous studies, the level of stratification is a major parameter for distinguishing between the different types of wide-field amacrine cells (Badea and Nathans, 2004; Lin and Masland, 2006). CRH-2 (nNOS-1) amacrine cells send a majority of their dendritic arbors to SL1–SL2 while maintaining their axons in SL9–SL10. SST-1 amacrine cells have exactly the opposite arrangement. It has been reported that, in axon-bearing wide-field amacrine cells, the dendrites receive input from bipolar cells and the axons propagate action potentials from the soma to the periphery (Cook and Werblin, 1994; Völgyi et al., 2001; Davenport et al., 2007). Thus, these cells might be functionally polarized like conventional neurons.
Ganglion cells (RGCs) are a much better understood class compared with amacrine cells, but are difficult to individually target because of a paucity of distinctive molecular markers. Approximately 20 subtypes of RGCs have been morphologically identified, but fewer than half have well described local circuits and central projections. Although several Cre drivers targeting specific types of RGCs have been described (Münch et al., 2009; Ivanova et al., 2010, 2013; Kim et al., 2010; Farrow et al., 2013), at least half of the RGC types lack specific drivers. In this study, we identified five RGC subtypes in the CRH-Cre driver and CCK-Cre driver lines. Since our approach includes a virus used for monosynaptic tracing (Wickersham et al., 2007a,b), retrograde tracing of the presynaptic partners of ganglion cells is enabled. Similarly, the ability to reliably and reproducibly identify the postsynaptic relay neurons of RGCs can be enhanced by genetic access to specific cell types.
Conclusion
Current genetic approaches use specific promoters with the goal of targeting expression to a single cell type. However, most lines show Cre expression in multiple cell types, precluding a simple analysis of single-cell morphology and stratification. We show that individual cells and types can be resolved by concatenating virus treatments. Viruses such as the rabies used in this study can be engineered to selectively transduce cell types by modifying recognition properties of the virus coat and cell membrane. The selectivity can be further enhanced by using specific promoters to control transgene expression. In addition, when the targeted cell types have unique axonal projections, viral infection can be initiated from their axonal terminals as demonstrated by our retrograde labeling of RGCs in the CCK-ires-Cre driver line. This approach has proved to be especially efficient in separating RGCs from other retinal cell types. Other viruses, such as vesicular stomatitis virus, lentivirus, and herpes virus, have been modified for use in pathway tracing (Mazarakis et al., 2001; Lima et al., 2009; Beier et al., 2011; Kato et al., 2011). In the near future, applying a sequence of viruses with different specificities may offer the possibility of targeting different labels to specific neuron types or individual neurons.
Footnotes
This work was supported by NIH Grants R01EY018204 (S.H.D.) and T32EY007128 (Y.Z.), and by Research to Prevent Blindness. W.W.H. was supported by NIH Grants R01EY11123 and P30EY021721, and grants from the Macular Vision Research Foundation, Foundation Fighting Blindness, Eldon Family Foundation, Vision for Children, and Research to Prevent Blindness. We thank Drs. Ian Wickersham and Edward Callaway for generously providing cell lines and plasmids for rabies virus production, and Vince Chiodo for providing recombinant adeno-associated virus. We thank Dr. Gregory Schwartz for careful reading and insightful comments on this manuscript.
W.W.H. and the University of Florida have a financial interest in the use of AAV therapies and own equity in a company (AGTC Inc.) that might, in the future, commercialize some aspects of this work. The remaining authors declare no competing financial interests.
References
- Badea TC, Nathans J. Quantitative analysis of neuronal morphologies in the mouse retina visualized by using a genetically directed reporter. J Comp Neurol. 2004;480:331–351. doi: 10.1002/cne.20304. [DOI] [PubMed] [Google Scholar]
- Beier KT, Saunders A, Oldenburg IA, Miyamichi K, Akhtar N, Luo L, Whelan SP, Sabatini B, Cepko CL. Anterograde or retrograde transsynaptic labeling of CNS neurons with vesicular stomatitis virus vectors. Proc Natl Acad Sci U S A. 2011;108:15414–15419. doi: 10.1073/pnas.1110854108. [DOI] [PMC free article] [PubMed] [Google Scholar]
- Borghuis BG, Tian L, Xu Y, Nikonov SS, Vardi N, Zemelman BV, Looger LL. Imaging light responses of targeted neuron populations in the rodent retina. J Neurosci. 2011;31:2855–2867. doi: 10.1523/JNEUROSCI.6064-10.2011. [DOI] [PMC free article] [PubMed] [Google Scholar]
- Boyden ES, Zhang F, Bamberg E, Nagel G, Deisseroth K. Millisecond-timescale, genetically targeted optical control of neural activity. Nat Neurosci. 2005;8:1263–1268. doi: 10.1038/nn1525. [DOI] [PubMed] [Google Scholar]
- Buffelli M, Burgess RW, Feng G, Lobe CG, Lichtman JW, Sanes JR. Genetic evidence that relative synaptic efficacy biases the outcome of synaptic competition. Nature. 2003;424:430–434. doi: 10.1038/nature01844. [DOI] [PubMed] [Google Scholar]
- Cook PB, Werblin FS. Spike initiation and propagation in wide field transient amacrine cells of the salamander retina. J Neurosci. 1994;14:3852–3861. doi: 10.1523/JNEUROSCI.14-06-03852.1994. [DOI] [PMC free article] [PubMed] [Google Scholar]
- Coombs J, van der List D, Wang GY, Chalupa LM. Morphological properties of mouse retinal ganglion cells. Neuroscience. 2006;140:123–136. doi: 10.1016/j.neuroscience.2006.02.079. [DOI] [PubMed] [Google Scholar]
- Dalkara D, Byrne LC, Klimczak RR, Visel M, Yin L, Merigan WH, Flannery JG, Schaffer DV. In vivo-directed evolution of a new adeno-associated virus for therapeutic outer retinal gene delivery from the vitreous. Sci Transl Med. 2013;5:189ra176. doi: 10.1126/scitranslmed.3005708. [DOI] [PubMed] [Google Scholar]
- Davenport CM, Detwiler PB, Dacey DM. Functional polarity of dendrites and axons of primate A1 amacrine cells. Vis Neurosci. 2007;24:449–457. doi: 10.1017/S0952523807070010. [DOI] [PMC free article] [PubMed] [Google Scholar]
- Deyle DR, Russell DW. Adeno-associated virus vector integration. Curr Opin Mol Ther. 2009;11:442–447. [PMC free article] [PubMed] [Google Scholar]
- Diamond JS, Lukasiewicz PD. Amacrine cells: seeing the forest and the trees. Vis Neurosci. 2012;29:1–2. doi: 10.1017/S0952523812000016. [DOI] [PubMed] [Google Scholar]
- Famiglietti EV. Polyaxonal amacrine cells of rabbit retina: morphology and stratification of PA1 cells. J Comp Neurol. 1992;316:391–405. doi: 10.1002/cne.903160402. [DOI] [PubMed] [Google Scholar]
- Farrow K, Teixeira M, Szikra T, Viney TJ, Balint K, Yonehara K, Roska B. Ambient illumination toggles a neuronal circuit switch in the retina and visual perception at cone threshold. Neuron. 2013;78:325–338. doi: 10.1016/j.neuron.2013.02.014. [DOI] [PubMed] [Google Scholar]
- Grimes WN, Seal RP, Oesch N, Edwards RH, Diamond JS. Genetic targeting and physiological features of VGLUT3+ amacrine cells. Vis Neurosci. 2011;28:381–392. doi: 10.1017/S0952523811000290. [DOI] [PMC free article] [PubMed] [Google Scholar]
- Hayes BP. Cell populations of the ganglion cell layer: displaced amacrine and matching amacrine cells in the pigeon retina. Exp Brain Res. 1984;56:565–573. doi: 10.1007/BF00237998. [DOI] [PubMed] [Google Scholar]
- Hofbauer A, Dräger UC. Depth segregation of retinal ganglion cells projecting to mouse superior colliculus. J Comp Neurol. 1985;234:465–474. doi: 10.1002/cne.902340405. [DOI] [PubMed] [Google Scholar]
- Huang ZJ, Zeng H. Genetic approaches to neural circuits in the mouse. Annu Rev Neurosci. 2013;36:183–215. doi: 10.1146/annurev-neuro-062012-170307. [DOI] [PubMed] [Google Scholar]
- Huberman AD, Manu M, Koch SM, Susman MW, Lutz AB, Ullian EM, Baccus SA, Barres BA. Architecture and activity-mediated refinement of axonal projections from a mosaic of genetically identified retinal ganglion cells. Neuron. 2008;59:425–438. doi: 10.1016/j.neuron.2008.07.018. [DOI] [PMC free article] [PubMed] [Google Scholar]
- Ivanova E, Hwang GS, Pan ZH. Characterization of transgenic mouse lines expressing Cre recombinase in the retina. Neuroscience. 2010;165:233–243. doi: 10.1016/j.neuroscience.2009.10.021. [DOI] [PMC free article] [PubMed] [Google Scholar]
- Ivanova E, Lee P, Pan ZH. Characterization of multiple bistratified retinal ganglion cells in a Purkinje cell protein 2-Cre transgenic mouse line. J Comp Neurol. 2013;521:2165–2180. doi: 10.1002/cne.23279. [DOI] [PMC free article] [PubMed] [Google Scholar]
- Kato S, Kobayashi K, Inoue K, Kuramochi M, Okada T, Yaginuma H, Morimoto K, Shimada T, Takada M. A lentiviral strategy for highly efficient retrograde gene transfer by pseudotyping with fusion envelope glycoprotein. Hum Gene Ther. 2011;22:197–206. doi: 10.1089/hum.2009.179. [DOI] [PubMed] [Google Scholar]
- Kay JN, Voinescu PE, Chu MW, Sanes JR. Neurod6 expression defines new retinal amacrine cell subtypes and regulates their fate. Nat Neurosci. 2011a;14:965–972. doi: 10.1038/nn.2859. [DOI] [PMC free article] [PubMed] [Google Scholar]
- Kay JN, De la Huerta I, Kim IJ, Zhang Y, Yamagata M, Chu MW, Meister M, Sanes JR. Retinal ganglion cells with distinct directional preferences differ in molecular identity, structure, and central projections. J Neurosci. 2011b;31:7753–7762. doi: 10.1523/JNEUROSCI.0907-11.2011. [DOI] [PMC free article] [PubMed] [Google Scholar]
- Kim IJ, Zhang Y, Yamagata M, Meister M, Sanes JR. Molecular identification of a retinal cell type that responds to upward motion. Nature. 2008;452:478–482. doi: 10.1038/nature06739. [DOI] [PubMed] [Google Scholar]
- Kim IJ, Zhang Y, Meister M, Sanes JR. Laminar restriction of retinal ganglion cell dendrites and axons: subtype-specific developmental patterns revealed with transgenic markers. J Neurosci. 2010;30:1452–1462. doi: 10.1523/JNEUROSCI.4779-09.2010. [DOI] [PMC free article] [PubMed] [Google Scholar]
- Kolb H, Nelson R, Mariani A. Amacrine cells, bipolar cells and ganglion cells of the cat retina: a Golgi study. Vis Res. 1981;21:1081–1114. doi: 10.1016/0042-6989(81)90013-4. [DOI] [PubMed] [Google Scholar]
- Kong JH, Fish DR, Rockhill RL, Masland RH. Diversity of ganglion cells in the mouse retina: unsupervised morphological classification and its limits. J Comp Neurol. 2005;489:293–310. doi: 10.1002/cne.20631. [DOI] [PubMed] [Google Scholar]
- Lima SQ, Hromádka T, Znamenskiy P, Zador AM. PINP: a new method of tagging neuronal populations for identification during in vivo electrophysiological recording. PLoS One. 2009;4:e6099. doi: 10.1371/journal.pone.0006099. [DOI] [PMC free article] [PubMed] [Google Scholar]
- Lin B, Masland RH. Populations of wide-field amacrine cells in the mouse retina. J Comp Neurol. 2006;499:797–809. doi: 10.1002/cne.21126. [DOI] [PubMed] [Google Scholar]
- MacNeil MA, Masland RH. Extreme diversity among amacrine cells: implications for function. Neuron. 1998;20:971–982. doi: 10.1016/S0896-6273(00)80478-X. [DOI] [PubMed] [Google Scholar]
- MacNeil MA, Heussy JK, Dacheux RF, Raviola E, Masland RH. The shapes and numbers of amacrine cells: matching of photofilled with Golgi-stained cells in the rabbit retina and comparison with other mammalian species. J Comp Neurol. 1999;413:305–326. doi: 10.1002/(SICI)1096-9861(19991018)413:2<305::AID-CNE10>3.0.CO%3B2-E. [DOI] [PubMed] [Google Scholar]
- Madisen L, Zwingman TA, Sunkin SM, Oh SW, Zariwala HA, Gu H, Ng LL, Palmiter RD, Hawrylycz MJ, Jones AR, Lein ES, Zeng H. A robust and high-throughput Cre reporting and characterization system for the whole mouse brain. Nat Neurosci. 2010;13:133–140. doi: 10.1038/nn.2467. [DOI] [PMC free article] [PubMed] [Google Scholar]
- Mazarakis ND, Azzouz M, Rohll JB, Ellard FM, Wilkes FJ, Olsen AL, Carter EE, Barber RD, Baban DF, Kingsman SM, Kingsman AJ, O'Malley K, Mitrophanous KA. Rabies virus glycoprotein pseudotyping of lentiviral vectors enables retrograde axonal transport and access to the nervous system after peripheral delivery. Hum Mol Genet. 2001;10:2109–2121. doi: 10.1093/hmg/10.19.2109. [DOI] [PubMed] [Google Scholar]
- Münch TA, da Silveira RA, Siegert S, Viney TJ, Awatramani GB, Roska B. Approach sensitivity in the retina processed by a multifunctional neural circuit. Nat Neurosci. 2009;12:1308–1316. doi: 10.1038/nn.2389. [DOI] [PubMed] [Google Scholar]
- Osakada F, Mori T, Cetin AH, Marshel JH, Virgen B, Callaway EM. New rabies virus variants for monitoring and manipulating activity and gene expression in defined neural circuits. Neuron. 2011;71:617–631. doi: 10.1016/j.neuron.2011.07.005. [DOI] [PMC free article] [PubMed] [Google Scholar]
- Pang JJ, Gao F, Wu SM. Light-evoked excitatory and inhibitory synaptic inputs to ON and OFF alpha ganglion cells in the mouse retina. J Neurosci. 2003;23:6063–6073. doi: 10.1523/JNEUROSCI.23-14-06063.2003. [DOI] [PMC free article] [PubMed] [Google Scholar]
- Perry VH. Evidence for an amacrine cell system in the ganglion cell layer of the rat retina. Neuroscience. 1981;6:931–944. doi: 10.1016/0306-4522(81)90174-3. [DOI] [PubMed] [Google Scholar]
- Perry VH, Morris RJ, Raisman G. Is Thy-1 expressed only by ganglion cells and their axons in the retina and optic nerve? J Neurocytol. 1984;13:809–824. doi: 10.1007/BF01148495. [DOI] [PubMed] [Google Scholar]
- Petreanu L, Mao T, Sternson SM, Svoboda K. The subcellular organization of neocortical excitatory connections. Nature. 2009;457:1142–1145. doi: 10.1038/nature07709. [DOI] [PMC free article] [PubMed] [Google Scholar]
- Petrs-Silva H, Dinculescu A, Li Q, Deng WT, Pang JJ, Min SH, Chiodo V, Neeley AW, Govindasamy L, Bennett A, Agbandje-McKenna M, Zhong L, Li B, Jayandharan GR, Srivastava A, Lewin AS, Hauswirth WW. Novel properties of tyrosine-mutant AAV2 vectors in the mouse retina. Mol Ther. 2011;19:293–301. doi: 10.1038/mt.2010.234. [DOI] [PMC free article] [PubMed] [Google Scholar]
- Roska B, Werblin F. Vertical interactions across ten parallel, stacked representations in the mammalian retina. Nature. 2001;410:583–587. doi: 10.1038/35069068. [DOI] [PubMed] [Google Scholar]
- Saszik S, DeVries SH. A mammalian retinal bipolar cell uses both graded changes in membrane voltage and all-or-nothing Na+ spikes to encode light. J Neurosci. 2012;32:297–307. doi: 10.1523/JNEUROSCI.2739-08.2012. [DOI] [PMC free article] [PubMed] [Google Scholar]
- Siegert S, Scherf BG, Del Punta K, Didkovsky N, Heintz N, Roska B. Genetic address book for retinal cell types. Nat Neurosci. 2009;12:1197–1204. doi: 10.1038/nn.2370. [DOI] [PubMed] [Google Scholar]
- Stafford DK, Dacey DM. Physiology of the A1 amacrine: a spiking, axon-bearing interneuron of the macaque monkey retina. Vis Neurosci. 1997;14:507–522. doi: 10.1017/S0952523800012165. [DOI] [PubMed] [Google Scholar]
- Sun W, Li N, He S. Large-scale morphological survey of mouse retinal ganglion cells. J Comp Neurol. 2002;451:115–126. doi: 10.1002/cne.10323. [DOI] [PubMed] [Google Scholar]
- Taniguchi H, He M, Wu P, Kim S, Paik R, Sugino K, Kvitsani D, Fu Y, Lu J, Lin Y, Miyoshi G, Shima Y, Fishell G, Nelson SB, Huang ZJ. A resource of Cre driver lines for genetic targeting of GABAergic neurons in cerebral cortex. Neuron. 2011;71:995–1013. doi: 10.1016/j.neuron.2011.07.026. [DOI] [PMC free article] [PubMed] [Google Scholar]
- Tian L, Hires SA, Mao T, Huber D, Chiappe ME, Chalasani SH, Petreanu L, Akerboom J, McKinney SA, Schreiter ER, Bargmann CI, Jayaraman V, Svoboda K, Looger LL. Imaging neural activity in worms, flies and mice with improved GCaMP calcium indicators. Nat Methods. 2009;6:875–881. doi: 10.1038/nmeth.1398. [DOI] [PMC free article] [PubMed] [Google Scholar]
- Trenholm S, Johnson K, Li X, Smith RG, Awatramani GB. Parallel mechanisms encode direction in the retina. Neuron. 2011;71:683–694. doi: 10.1016/j.neuron.2011.06.020. [DOI] [PMC free article] [PubMed] [Google Scholar]
- Völgyi B, Xin D, Amarillo Y, Bloomfield SA. Morphology and physiology of the polyaxonal amacrine cells in the rabbit retina. J Comp Neurol. 2001;440:109–125. doi: 10.1002/cne.1373. [DOI] [PubMed] [Google Scholar]
- Völgyi B, Chheda S, Bloomfield SA. Tracer coupling patterns of the ganglion cell subtypes in the mouse retina. J Comp Neurol. 2009;512:664–687. doi: 10.1002/cne.21912. [DOI] [PMC free article] [PubMed] [Google Scholar]
- Wickersham IR, Finke S, Conzelmann KK, Callaway EM. Retrograde neuronal tracing with a deletion-mutant rabies virus. Nat Methods. 2007a;4:47–49. doi: 10.1038/nmeth999. [DOI] [PMC free article] [PubMed] [Google Scholar]
- Wickersham IR, Lyon DC, Barnard RJ, Mori T, Finke S, Conzelmann KK, Young JA, Callaway EM. Monosynaptic restriction of transsynaptic tracing from single, genetically targeted neurons. Neuron. 2007b;53:639–647. doi: 10.1016/j.neuron.2007.01.033. [DOI] [PMC free article] [PubMed] [Google Scholar]
- Yeh HH, Olschowka JA. A system of corticotropin releasing factor-containing amacrine cells in the rat retina. Neuroscience. 1989;33:229–240. doi: 10.1016/0306-4522(89)90324-2. [DOI] [PubMed] [Google Scholar]
- Yonehara K, Farrow K, Ghanem A, Hillier D, Balint K, Teixeira M, Jüttner J, Noda M, Neve RL, Conzelmann KK, Roska B. The first stage of cardinal direction selectivity is localized to the dendrites of retinal ganglion cells. Neuron. 2013;79:1078–1085. doi: 10.1016/j.neuron.2013.08.005. [DOI] [PubMed] [Google Scholar]
- Zhong L, Li B, Mah CS, Govindasamy L, Agbandje-McKenna M, Cooper M, Herzog RW, Zolotukhin I, Warrington KH, Jr, Weigel-Van Aken KA, Hobbs JA, Zolotukhin S, Muzyczka N, Srivastava A. Next generation of adeno-associated virus 2 vectors: point mutations in tyrosines lead to high-efficiency transduction at lower doses. Proc Natl Acad Sci U S A. 2008;105:7827–7832. doi: 10.1073/pnas.0802866105. [DOI] [PMC free article] [PubMed] [Google Scholar]