Abstract
It is well established that stance duration changes more than swing duration for a given change in cycle duration. Small variations in cycle duration are also observed at any given speed on a step-by-step basis. To evaluate the step-by-step effect of speed on phase variations, we measured the slopes of the linear regressions between the phases (i.e., stance, swing) and cycle duration during individual episodes at different treadmill speeds in five adult cats. We also determined the pattern of dominance, defined as the phase that varies most with cycle duration. We found a significant effect of speed on hindlimb phase variations, with significant differences observed between the slowest speed of 0.3 m/s compared with faster speeds. Moreover, although patterns of phase dominance were primarily stance/extensor dominated at the slowest speeds, as speed increased the patterns were increasingly categorized as covarying, whereby both stance/extensor and swing/flexor phases changed in approximately equal proportion with cycle duration. Speed significantly affected the relative duration of support periods as well as interlimb phasing between homolateral and diagonal pairs of limbs but not between homologous pairs of limbs. Speed also significantly affected the consistency of interlimb coordination on a step-by-step basis, being less consistent at the slowest speed of 0.3 m/s compared with faster speeds. We found a strong linear relationship between hindlimb phase variations and the consistency of interlimb coordination. Therefore, results show that phase variations on a step-by-step basis are modulated by speed, which appears to influence the consistency of interlimb coordination.
Keywords: locomotion, speed, phase variations, interlimb coordination
during overground or treadmill locomotion, the cycle can be broadly divided into stance and swing phases. Numerous studies have shown that cycle duration is reduced as speed increases, which is accomplished primarily by a reduction in the duration of the stance phase, while the duration of the swing phase is much less affected (reviewed in Frigon 2012; Gossard et al. 2011). This can be demonstrated by plotting the durations of the stance and swing phases as a function of cycle duration and measuring the slopes of the linear regressions (Halbertsma 1983). In most terrestrial walking species, including insects, birds, rodents, reptiles, dogs, cats, macaques, and humans, the slope of the regression between the stance phase and cycle duration (rSTA) is steeper than the slope of the regression between the swing phase and cycle duration (rSW) (Arshavskii et al. 1965; Cohen and Gans 1975; Frigon et al. 2013; Gabriel and Buschges 2007; Goslow et al. 1973; Grillner et al. 1979; Grillner and Dubuc 1988; Grillner and Zangger 1984; Gruhn et al. 2009; Halbertsma 1983; Jacobson and Hollyday 1982; Musselman and Yang 2007; Nilsson et al. 1985; Vilensky 1983; Wetzel and Stuart 1976; Williams 1981; Yang et al. 2005), In other words, the stance phase varies more than the swing phase for a given change in cycle duration.
Phase variations (i.e., as a function of cycle duration) have also been studied during fictive locomotion in curarized decerebrate cats (Frigon and Gossard 2009, 2010; Gossard et al. 2011; Grillner and Zangger 1979; Yakovenko et al. 2005) and in neonatal rodents (Juvin et al. 2007) to gain insight into the neural control of locomotion. In such preparations, the phases of extensor and flexor activity, which roughly correspond to the stance and swing phases of real locomotion (i.e., as opposed to fictive locomotion), respectively, are measured from bursts recorded in peripheral nerves or ventral roots. Results obtained during fictive locomotion have been used to model the functional organization of spinal locomotor networks, so-called central pattern generators (CPGs) (Markin et al. 2010; Spardy et al. 2011a, 2011b; Yakovenko et al. 2005). The concept of “phase dominance” was introduced to denote the phase that showed the most variation as a function of cycle duration (Fleshman et al. 1984; Frigon 2012; Frigon and Gossard 2009, 2010; Gossard et al. 2011; Yakovenko et al. 2005). For example, when the slope of the regression between the burst of extensor activity and cycle duration (rEXT) is steeper than the slope of the regression between the burst of flexor activity and cycle duration (rFLEX), the pattern is said to be “extensor dominated.” Frigon and Gossard introduced criteria to objectively establish the pattern of phase dominance during fictive locomotion (Frigon and Gossard 2009, 2010). It was shown that patterns of phase dominance are influenced by the type of preparation. For instance, during fictive locomotion that is spontaneously occurring in decerebrate cats, or that is evoked pharmacologically in spinal-transected decerebrate cats, patterns were found to be primarily extensor dominated (Frigon and Gossard 2009, 2010; Gossard et al. 2011; Grillner and Dubuc 1988; Grillner and Zangger 1979). In contrast, when fictive locomotion was elicited by stimulating the mesencephalic locomotor region (MLR), the patterns were mostly flexor dominated (Yakovenko et al. 2005). MLR stimulation could even switch an extensor-dominated locomotor-like pattern into a flexor-dominated pattern (Frigon and Gossard 2009). Sensory feedback can also modify patterns of phase dominance and/or the slopes of the linear regressions (Fleshman et al. 1984; Frigon and Gossard 2010; Juvin et al. 2007; Kriellaars et al. 1994; Musselman and Yang 2007; Pearson and Rossignol 1991).
Previous studies during overground or treadmill locomotion averaged phase durations at a given speed to measure the slopes of the linear regressions between the stance phase and cycle duration and between the swing phase and cycle duration. While this provides a general indication of the effect of speed on relative phase durations, it does not assess whether variations are influenced by speed on a step-by-step basis. In the present study, we determined variations in phase durations for individual episodes in the fore- and hindlimbs at several speeds, similar to what previous studies did with multiple episodes of fictive locomotion in decerebrate cats (Frigon and Gossard 2009; Yakovenko et al. 2005). However, during treadmill locomotion, speed can be precisely controlled. A change in treadmill speed directly affects cycle duration, as opposed to fictive locomotion, where changes in cycle duration occur spontaneously.
An important functional aspect to consider is that modulation of phase variations with a change in speed could influence interlimb coordination. Coordinated movement of the four limbs (i.e., interlimb coordination) is a fundamental requirement for quadrupedal locomotion. Precise and flexible control of interlimb coordination allows transitions between gait patterns, such as walking, trotting, and galloping. It also allows the animal to change locomotor speed while maintaining dynamic stability. Although a few studies have investigated interlimb coordination as a function of speed and/or the type of gait pattern in terrestrial quadrupedal mammals during overground and/or treadmill locomotion (Abourachid et al. 2007; English 1979; English and Lennard 1982; Gray 1968; Maes et al. 2008; Maes and Abourachid 2013; Miller et al. 1975a, 1975b; Wetzel and Stuart 1976), the step-by-step control of interlimb coordination with a change in speed is largely unknown. A better understanding of speed control on a step-by-step basis is crucial because one missed step can disrupt dynamic stability and lead to a fall, thus risking injury.
Therefore, the first objective of this study was to evaluate the step-by-step regulation of phase variations over a range of treadmill speeds. The second objective was to quantify interlimb coordination over a range of treadmill speeds and determine whether there is a correlation between changes in phase variations and the consistency of interlimb coordination across speeds. The results provide additional insight on the neurophysiological control of locomotion and are a necessary step to evaluate adaptive mechanisms that regulate locomotor speed and interlimb coordination with novel experimental paradigms designed to perturb interlimb coordination (e.g., Frigon et al. 2013; Thibaudier et al. 2013), as well as in animals after injury.
MATERIALS AND METHODS
Animals and Ethical Considerations
All procedures were approved by the Animal Care Committee of the Université de Sherbrooke and were in accordance with policies and directives of the Canadian Council on Animal Care. Before and after experiments, animals were housed and fed within designated areas. Five adult cats (1 male, 4 females) weighing between 3.5 and 7.7 kg were used. Cats were trained to walk on an animal treadmill with two independently controlled running surfaces 120 cm long and 30 cm wide (Bertec, Columbus, OH). A Plexiglas separator (120 cm long, 3 cm high, 0.5 cm wide) was placed between the left and right belts. Two Plexiglas separators (120 cm long, 50 cm high) were also placed 30 cm apart to constrain the animal to walk with the left and right sides separately on the two belts. Cats were given food and affection as reward. The animals were trained to walk on two separate belts because they also performed bouts of split-belt locomotion during these sessions (data not shown) (Frigon et al. 2013).
General surgical procedures.
The implantation surgery was performed under aseptic conditions in an operating room with sterilized equipment. Prior to surgery, the cat was sedated with an intramuscular (im) injection of butorphanol (0.4 mg/kg), acepromazine (0.1 mg/kg), and glycopyrrolate (0.01 mg/kg). Induction was done with ketamine-diazepam (0.11 ml/kg in a 1-to-1 ratio im). Once anesthetized, the cat was quickly intubated with a flexible endotracheal tube and anesthesia was maintained by adjusting isoflurane concentration as needed (1.5–3%). The fur overlying the back, stomach, and hindlimbs was shaved with electric clippers, and loose hair was vacuumed. The level of anesthesia was confirmed and adjusted throughout the surgery by monitoring cardiac and respiratory rates, by applying pressure to the paw to detect limb withdrawal, and by assessing jaw tone. Body temperature was monitored with a rectal thermometer. During surgery an antibiotic (Convenia, 0.1 ml/kg) was injected subcutaneously and a transdermal fentanyl patch (25 μg/h) was taped to the back of the animal 2–3 cm from the base of the tail. During surgery and ∼7 h later, another analgesic (buprenorphine 0.01 mg/kg) was administered subcutaneously. After surgery, cats were placed in an incubator and closely monitored until they regained consciousness.
Electromyography.
Pairs of Teflon-insulated multistrain fine wires (AS633; Cooner Wire, Chatsworth, CA) were directed subcutaneously from a head-mounted 24-pin connector (Hirose Electric) and sewn into the belly of selected hindlimb and forelimb muscles for bipolar recordings. The electromyographs (EMGs) were differentially preamplified (10×, custom-made system), band-pass filtered (30–1,000 Hz), and then amplified (100–5,000×) with a 16-channel amplifier (A-M Systems model 3500, Sequim, WA). EMG data were then digitized (2,000 Hz) with a NI card (NI 6032E), acquired with custom-made acquisition software, and stored on a computer. Onsets and offsets of EMG bursts were determined visually with custom-made software. Only EMG bursts with clear onsets and offsets were retained for analysis.
Experimental Protocol
Each cat performed two sessions that included several locomotor episodes with the left and right belts operating at the same speed (i.e., tied-belt locomotion). Within a session, the goal was to obtain ∼15 cycles at 8 different speeds, ranging from 0.3 to 1.0 m/s in 0.1 m/s increments. The different speeds were presented randomly from one session to another, and ∼30 s of rest was given between episodes.
Data Acquisition and Analysis
Kinematics.
Videos of the left and right sides were captured with two cameras (Basler) at 60 (n = 8 sessions) or 100 (n = 2 sessions) frames/s. A custom-made LabVIEW program acquired the images and synchronized the cameras. Videos were analyzed off-line. Cycle duration was measured from successive paw contacts. Paw contact was defined as the first frame where the paw makes visible contact with the treadmill surface. Stance duration corresponded to the interval of time from paw contact to the most caudal displacement of the paw relative to the hip (Halbertsma 1983) or the shoulder, while swing duration was measured as cycle duration minus stance duration. During a normalized cycle (i.e., from successive right hindlimb contacts) there are eight different epochs that can be determined based on the pattern of limb supports (Gray 1968; Wetzel and Stuart 1976). Each support period was calculated across sessions/animals.
Phase intervals were calculated by measuring the interval of time between contacts of two limbs and expressed as a function of cycle duration of the right hindlimb (English 1979; English and Lennard 1982; Orsal et al. 1990). Phase intervals were measured for four different limb pairs: homologous forelimbs, homologous hindlimbs, right homolateral limbs, and diagonal coupling between the right hindlimb and left forelimb. Phase intervals were then expressed in degrees to illustrate their continuous nature and possible distributions (English and Lennard 1982). The coupling of the left homolateral limbs and the diagonal coupling of the left hindlimb and right forelimb are not shown because they are virtually identical to the right homolateral coupling and the diagonal coupling of the right hindlimb and left forelimb, respectively. In each episode, the difference between the phase interval obtained during a cycle and the mean phase interval of the episode was measured. This is termed the absolute deviation of the phase interval, and it was calculated for the four limb pairs to quantify the consistency of interlimb coordination on a step-by-step basis at every speed tested.
Electromyography.
The EMGs of several hindlimb and forelimb muscles were obtained concurrently with video recordings. Only EMGs from the hindlimbs were analyzed because we did not have reliable recordings from a forelimb flexor muscle. To determine the duration of the hindlimb extensor phase, the duration of the lateral gastrocnemius (LG), medial gastrocnemius (MG), or vastus lateralis (VL) burst was measured. LG, MG, and VL burst durations are known to change with stance duration (Halbertsma 1983). To determine the duration of the hindlimb flexor phase, the duration of the sartorius (Srt) burst was measured, which is known to change with swing duration (Halbertsma 1983). Cycle duration used to calculate rEXT and rFLEX was measured from successive extensor and flexor burst onsets, respectively. EMG data from Srt and one extensor (LG, MG, or VL) from the left or right side were recorded from 4 cats in 8 of 10 sessions. In one cat, extensor EMGs did not have a clear enough onset and offset to provide useful data. All EMG burst onsets and offsets were tagged manually by the same experimenter (A. Frigon) with custom-made software.
Statistical Analysis
Statistical tests were performed with Statgraphics Centurion XVI (StatPoint Technologies) or with IBM SPSS Statistics 20.0. For each episode, phase (stance, swing, extensor, flexor) durations were plotted as a function of cycle duration. The slopes (rSTA, rSW, rEXT, rFLEX) of the linear regressions between the phase durations and cycle duration were measured. For each episode, rSTA and rSW or rEXT and rFLEX were compared with one another with a multiple regression analysis (Comparison of Regression Lines in Statgraphics). An analysis of variance (ANOVA) was used to determine whether the regressions were significant (Simple Regression in Statgraphics). For comparison with previous studies, we also averaged the durations of the various phases and cycle duration at a given speed. We then plotted the phases as a function of cycle duration across speeds within a session to measure the slopes of the linear regressions (i.e., rSTA, rSW, rEXT, rFLEX). Within the session, the same tests were used to determine whether rSTA and rSW, as well as rEXT and rFLEX, were significantly different from one another and whether the regressions were significant.
To determine the pattern of dominance, we used three criteria: 1) a slope more positive or more negative than 0.4 or −0.4, respectively, 2) a significant regression, and 3) a significant difference between rSTA and rSW or between rEXT and rFLEX. An episode was classified as covarying (i.e., both phases vary in approximately equal proportion with cycle duration) if there was no significant difference between rSTA and rSW or between rEXT and rFLEX and if one of the slopes was more positive or more negative than 0.4 or −0.4, respectively, with at least one of the regressions being significant. An episode was said to be invariant if both rSTA and rSW or rEXT and rFLEX were between 0.4 and −0.4, or if both regressions were not significant.
For each session, rSTA and rSW were averaged at each speed for the left and right fore- and hindlimbs. A three-factor (8 speeds, 2 sides, 2 limbs) repeated-measures (i.e., session) ANOVA was performed on rSTA and rSW (General Linear Model in SPSS). A repeated-measures ANOVA was not performed for EMG data because EMGs were available in one hindlimb only and for a smaller number of sessions. A one-factor (8 speeds) repeated-measures ANOVA was performed on hindlimb rSTA and rSW (see results), on the eight support periods, on the mean phase intervals of the four limb pairings, and on the absolute deviation of the phase interval for the four limb couplings. If there was a significant effect of speed detected by the one-factor repeated-measures ANOVA, pairwise comparisons with a Bonferroni correction were performed for some of the variables. We performed two sessions per cat and compared across sessions/animals for two main reasons. First, performing two sessions per cat allowed a comparison between sessions for the same animal. Second, it reduced the number of animals required, an important ethical consideration when studying relatively large mammals with invasive procedures. Statistical significance for all tests was set at P < 0.05.
RESULTS
Speed-Dependent Modulation of Locomotor Pattern
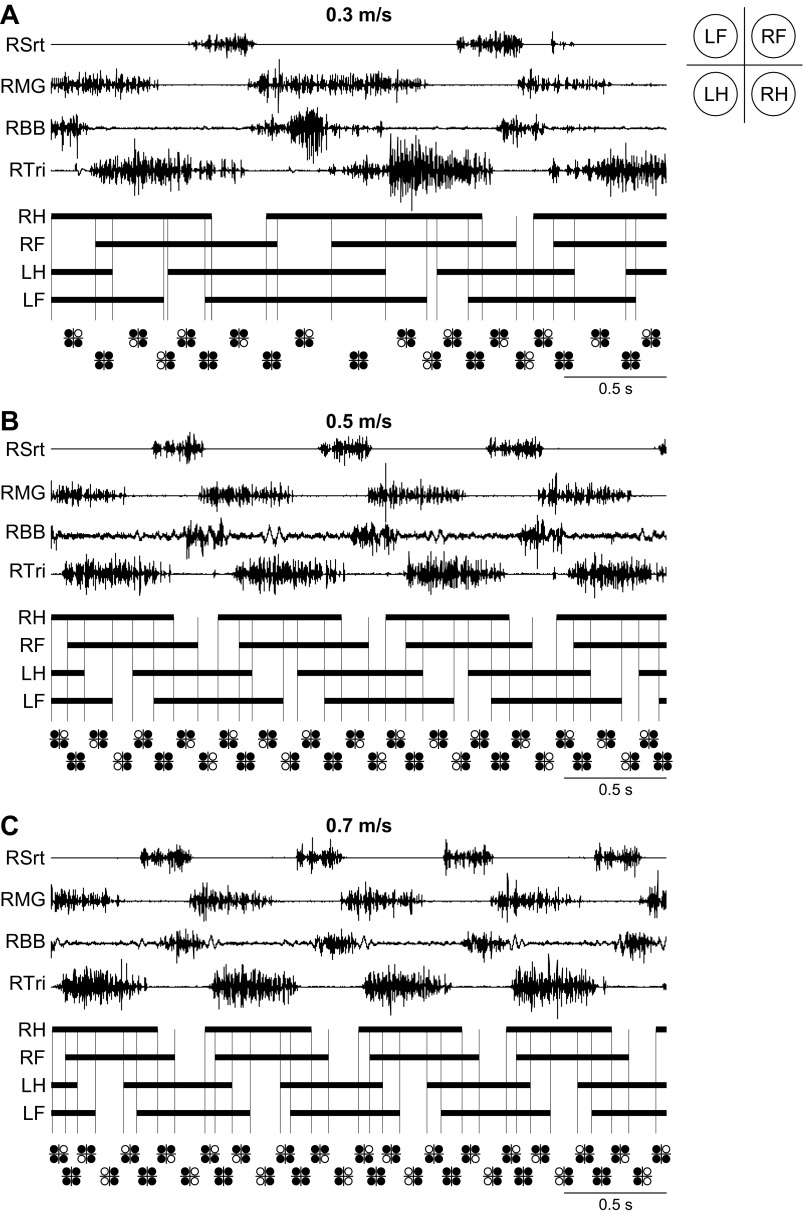
Figure 1 shows the locomotor pattern at three different speeds in a single cat. All three panels are arranged in the same way, with EMG activity from four muscles followed by the stance phases of each limb and the support patterns below (i.e., the limbs contacting the surface). The footfall pattern remained consistent across speeds and proceeded with right hindlimb (RH), right forelimb (RF), left hindlimb (LH), and left forelimb (LF) contacts. This is termed a lateral sequence, where contact of the hindlimb is followed by contact of the homolateral forelimb (Hildebrand 1967; Lemelin et al. 2003; Stevens 2006; Thibaudier et al. 2013). This sequence was found in all episodes analyzed. A complete cycle (i.e., from successive RH contacts) contained eight distinct time phases, or support periods, each characterized by the pattern of limbs that are supporting the body (reviewed in Gray 1968; Wetzel and Stuart 1976). With an increase in speed, stance duration was decreased, which altered the number of limbs contacting the surface within a time phase. In the examples shown in Fig. 1, at 0.3 m/s (Fig. 1A), 0.5 m/s (Fig. 1B), and 0.7 m/s (Fig. 1C), the sequence of limb supports followed a consistent 3-4-3-2-3-4-3-2 pattern in this cat.
Fig. 1.
The locomotor pattern at 3 treadmill speeds during a session in 1 cat: electromyography from 4 muscles of the right forelimb and right hindlimb with corresponding stance (thick horizontal black lines) and swing (intervals between stance phases) phases of all 4 limbs during 3 s of treadmill locomotion at speeds of 0.3 m/s (A), 0.5 m/s (B), and 0.7 m/s (C). Intervals between vertical lines are used to identify the pattern of leg support, which is shown for each support period below the stance phases. LF, left forelimb; LH, left hindlimb; RF, right forelimb; RH, right hindlimb; RBB, right biceps brachii; RMG, right medial gastrocnemius; RSrt, right sartorius; RTri, right triceps brachii.
Speed-Dependent Modulation of Cycle and Phase Durations
Figure 2 shows cycle and phase durations of the right forelimb and right hindlimb in an intact adult cat (Fig. 2, A–C, same session as Fig. 1) and across sessions/animals (Fig. 2, D–F). As speed increased, cycle duration, measured from successive right forelimb (Fig. 2, A and D) or right hindlimb (Fig. 2, B and E) contacts or from successive right extensor burst onsets (Fig. 2, C and F) decreased. Stance phase and extensor burst durations decreased with increasing speed, while swing phase and flexor burst durations were much less affected. The left forelimb and left hindlimb showed changes in cycle and phase durations similar to the homologous limbs of the right side (data not shown).
Fig. 2.
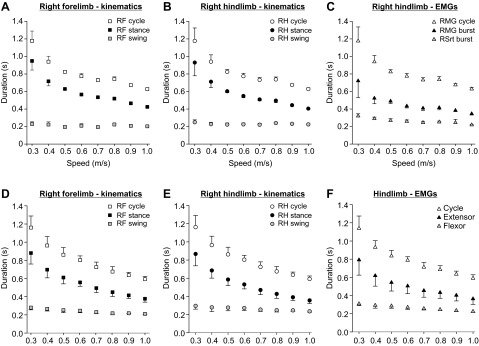
Effect of speed on phase and cycle durations of RF and RH within a session for 1 cat and across sessions/animals. A–C: phase (i.e., stance, swing) and cycle duration measured from kinematic events in RF (A) and RH (B) as well as from EMG burst onsets and offsets in RH (C). Each data point in A–C is the mean ± SD of 8–15 cycles. D–F: phase (i.e., stance, swing) and cycle duration measured from kinematic events in RF (D) and RH (E) as well as from EMG burst onsets and offsets in LH or RH (F) across sessions/animals. Each data point in D–F is the mean ± SD of 10 and 8 sessions for kinematic and EMG data, respectively.
In Fig. 2, A–C, cycle, stance, and swing durations were averaged at a given speed and then plotted as a function of speed. Using these data, we plotted stance and swing phase durations as well as extensor and flexor burst durations as a function of cycle duration to then measure the slopes of the linear regressions between these variables for the session. Figure 3 shows that rSTA was significantly greater than rSW in the forelimbs (Fig. 3A) and hindlimbs (Fig. 3B). In the hindlimbs, rEXT was significantly greater than rFLEX (Fig. 3C). Thus, when taking an average of phase and cycle durations at each speed to measure the slopes of the linear regressions between the phases and cycle duration across speeds within a session, the pattern of phase dominance was stance- or extensor-dominated, as shown previously (reviewed in Gossard et al. 2011). In total, the pattern of phase dominance was determined in 10 sessions (5 cats × 2 sessions) for the left and right fore- and hindlimbs with kinematic data and in 8 sessions (4 cats × 2 sessions) unilaterally for the hindlimbs with EMG data. In all instances (40/40 for kinematic data, 8/8 for EMG data), the pattern of dominance within a session was stance- or extensor-dominated.
Fig. 3.
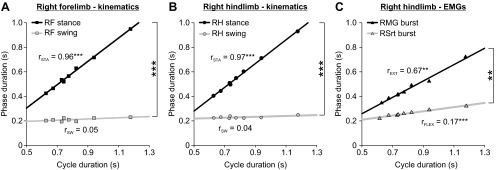
Effect of speed on the linear regressions between the phases and cycle duration within a session of 1 cat: simple linear regression analyses of phase durations as a function of cycle duration from the data shown in Fig. 2, A–C. Values of the slopes of the linear regressions between stance and cycle duration (rSTA) and between swing and cycle duration (rSW) are indicated for RF (A) and RH (B). The slopes of the linear regressions between the extensor burst duration and cycle duration (rEXT) and between the flexor burst duration and cycle duration (rFLEX) are shown in C for RH. Asterisks indicate a significant regression or significant differences between rSTA and rSW or between rEXT and rFLEX (multiple-regression analysis, P < 0.05): **P < 0.01, ***P < 0.001.
Phase Variations and Patterns of Phase Dominance During Individual Episodes Over a Range of Treadmill Speeds
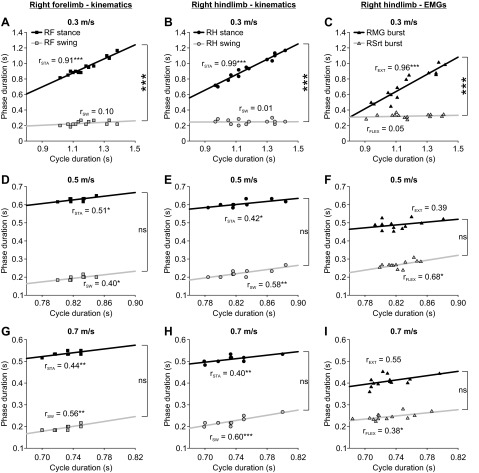
Although the treadmill imposed a constant speed, there were variations in cycle and phase durations in the fore- and hindlimbs at any given speed. To evaluate the effect of treadmill speed on the regulation of phase variations, we plotted the stance and swing phases as a function of cycle duration and measured the slopes of the linear regressions in the fore- and hindlimbs during individual episodes at every speed tested. We also measured the slopes of the linear regressions for extensor and flexor EMG bursts as a function of cycle duration in the hindlimbs at every speed tested. Figure 4 shows linear regressions between the phases and cycle duration for the right forelimb and right hindlimb at three speeds in a single cat (same cat and session as Figs. 1 and 3). At 0.3 m/s, rSTA was significantly greater than rSW in the right forelimb (Fig. 4A) and right hindlimb (Fig. 4B). Similarly, rEXT was significantly greater than rFLEX in the right hindlimb (Fig. 4C). Thus at 0.3 m/s the pattern was stance- or extensor-dominated. However, at 0.5 m/s (Fig. 4, D and E) and 0.7 m/s (Figs. 4, G and H), rSTA and rSW were not significantly different from one another in the right forelimb and right hindlimb (P > 0.05). In a similar vein, at 0.5 m/s (Fig. 4F) and 0.7 m/s (Fig. 4I) rEXT was not significantly different from rFLEX in the right hindlimb. Therefore, at 0.5 m/s and 0.7 m/s the patterns covaried, meaning that both stance and swing phase durations or extensor and flexor burst durations changed in approximately similar proportions as a function of cycle duration.
Fig. 4.
Phase variations during individual episodes at 3 treadmill speeds for RF and RH of a cat in a single session. Each row represents a different locomotor episode. Simple linear regression analyses of phase durations as a function of cycle duration were measured from kinematic events (RF, A, D, G; RH, B, E, H) or from EMG data (RH, C, F, I). rSTA, rSW, rEXT, and rFLEX are indicated for each episode. Asterisks indicate a significant regression or significant differences between rSTA and rSW or between rEXT and rFLEX (multiple-regression analysis, P < 0.05): *P < 0.05, **P < 0.01, ***P < 0.001; ns, not significant.
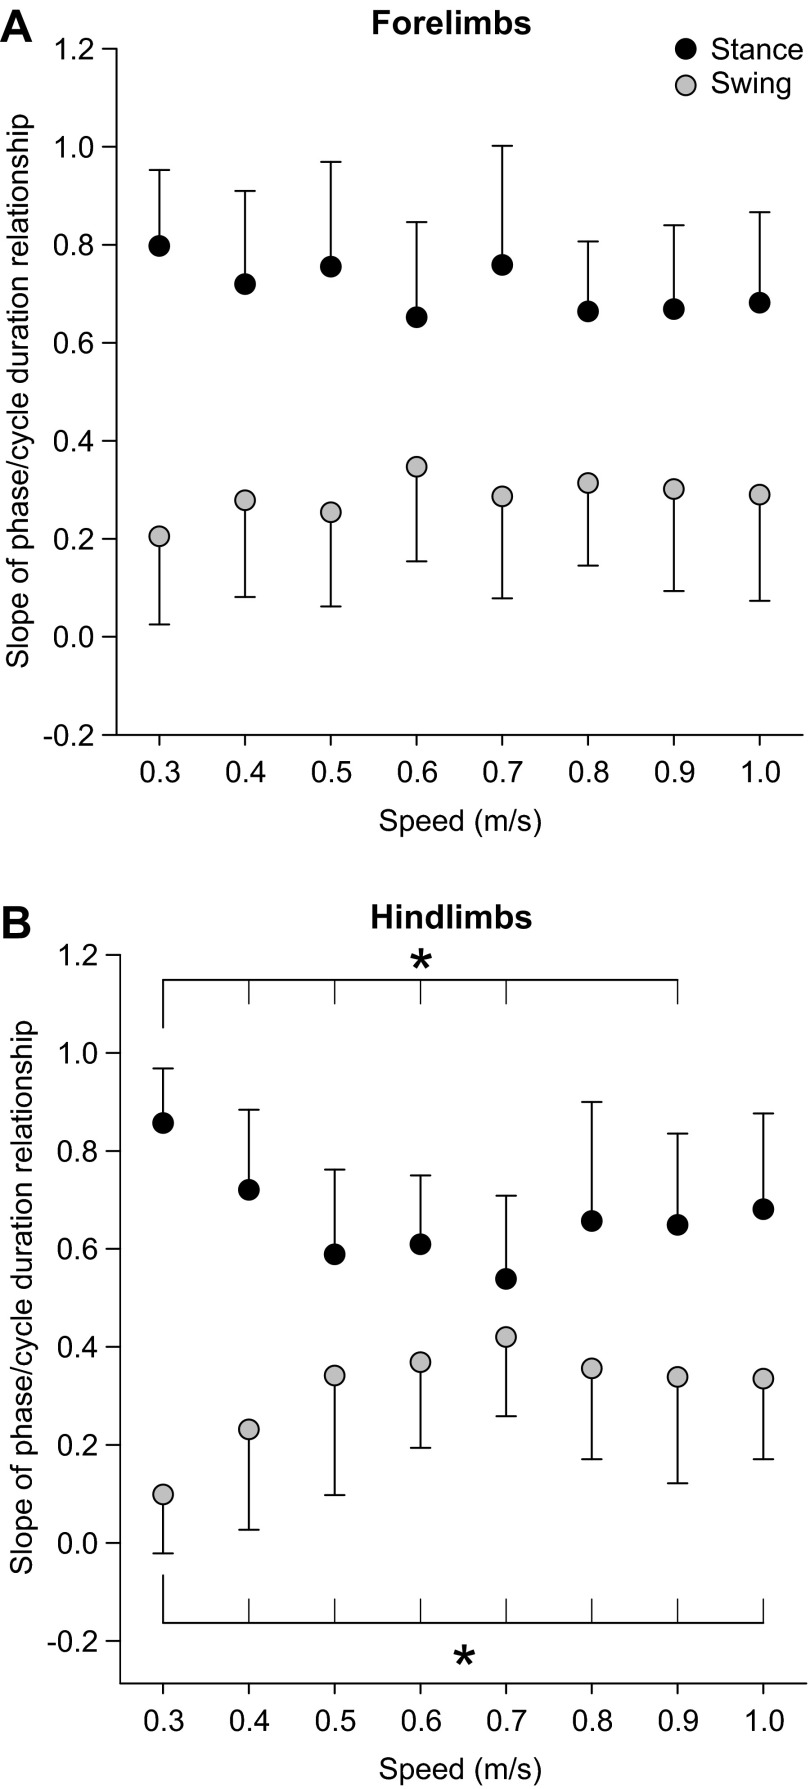
Figure 5 shows rSTA and rSW as a function of speed across sessions/animals, where each data point is the average ± SD of 10 sessions. A three-factor (speed, side, limbs) repeated-measures ANOVA revealed a significant effect of speed on rSTA and rSW for the fore- and hindlimbs (P < 0.05, Greenhouse-Geisser correction). There was a significant effect of limbs (forelimbs vs. hindlimbs) on rSTA (P < 0.05, sphericity assumed) and a significant interaction between limbs and speed (P < 0.01, Greenhouse-Geisser correction). There was no significant effect of limbs on rSW (P = 0.23, sphericity assumed). There was also no significant effect of side (left vs. right) on rSTA (P = 0.84, sphericity assumed) and rSW (P = 0.30, sphericity assumed). We then performed a one-factor (speed) ANOVA on pooled rSTA and rSW values of the fore- and hindlimbs, followed by pairwise comparisons if there was a significant effect of speed. There was no significant effect of speed on rSTA (P = 0.13, sphericity assumed) and rSW (P = 0.52, sphericity assumed) of the forelimbs (Fig. 5A). However, there was a significant effect of speed on rSTA (P < 0.001, sphericity assumed) and rSW (P < 0.001, Greenhouse-Geisser correction) of the hindlimbs (Fig. 5B). All significant differences occurred between the slowest speed of 0.3 m/s and faster speeds (P < 0.05, pairwise comparisons). Therefore, an increase in speed alters the regulation of phase variations and there is a differential modulation of phase variations as a function of speed between the fore- and hindlimbs.
Fig. 5.
Effect of speed on the regulation of phase variations across sessions/animals. rSTA and rSW are shown for the forelimbs (A) and the hindlimbs (B). There was no significant effect of side on rSTA and rSW (3-factor repeated-measures analysis of variance, P > 0.05). As such, data were pooled for the left and right sides. Each data point in the figure is the mean ± SD of 20 episodes (10 sessions × 2 sides). Asterisks indicate significant differences (pairwise comparisons with Bonferroni correction) between speeds for hindlimb rSTA and rSW, with the long vertical line indicating the start of the comparisons (i.e., from 0.3 m/s to other speeds). *P < 0.05.
To provide another measure of phase variations as a function of speed, we determined patterns of phase dominance in all episodes at all speeds tested. The five cats each performed two sessions, and rSTA and rSW were measured for the left and right forelimbs and hindlimbs at eight different speeds for a total of 80 episodes (5 cats × 2 sessions × 8 speeds). Thus 160 comparisons between rSTA and rSW were made for the fore- and hindlimbs (80 episodes × 2 sides). EMG data were available to measure rEXT and rFLEX in the left or right hindlimb in 64 episodes (4 cats × 2 sessions × 8 speeds). In the forelimbs (Fig. 6A), the majority of episodes were stance dominated at 0.3 m/s, although there was one swing-dominated and one covarying episode. At speeds of 0.4–1.0 m/s, stance-dominated and covarying episodes were approximately equally represented. There was a swing-dominated episode at 0.4 m/s and one at 0.6 m/s. In the hindlimbs, all episodes were stance- (Fig. 6B) or extensor- (Fig. 6C) dominated at 0.3 m/s. As speed increased, more episodes showed a covarying-type pattern of phase dominance. Four episodes were found to be swing dominated: two at 0.7 m/s, one at 0.8 m/s, and one at 0.9 m/s. For EMG data, two episodes at 0.7 m/s and 0.8 m/s were invariant. When patterns of phase dominance obtained with EMG bursts were compared with those obtained with kinematic events, 81.3% (52/64) of episodes showed an equivalent pattern of phase dominance. In other words, 81.3% of episodes categorized as extensor-dominated or covarying (no flexor-dominated episodes were found) based on EMG data were stance dominated or covarying based on kinematic data, respectively.
Fig. 6.
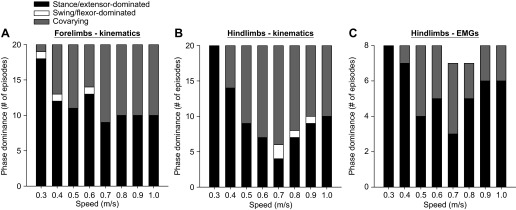
Effect of treadmill speed on the patterns of phase dominance for all episodes. The pattern of phase dominance was established by 3 criteria (see materials and methods). A and B: 160 episodes were analyzed based on kinematic events (5 cats × 2 sessions × 2 sides × 8 speeds) for the forelimbs (A) and the hindlimbs (B) and were classified as stance dominated, swing dominated, or covarying. C: 64 episodes were also analyzed based on EMG burst durations (4 cats × 2 sessions × 1 side × 8 speeds) and were classified as extensor dominated, flexor dominated, or covarying. Note that in C 2 episodes were classified as invariant (1 episode at 0.7 m/s and 1 at 0.8 m/s).
Speed-Dependent Modulation of Limb Supports
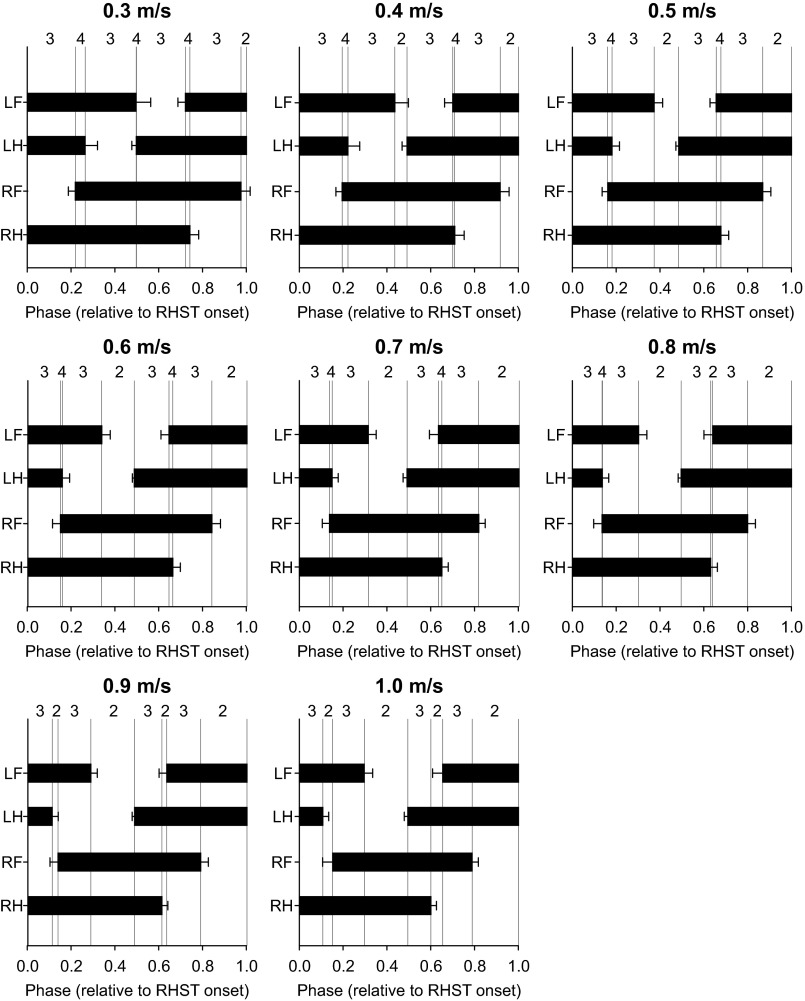
As a result of changes in the relative duration of the stance and swing phases in each limb with a change in speed, the pattern of limb supports was altered. Figure 7 shows the averaged support periods normalized to cycle duration across sessions/animals. The numbers above the panels indicate the number of limbs contacting the ground during the eight time phases of the cycle. At the slowest speed of 0.3 m/s, the sequence of limbs contacting the ground was variable, with a 3-4-3-4-3-4-3-2 pattern. From 0.4 m/s to 0.7 m/s, the sequence was consistent with a 3-4-3-2-3-4-3-2 pattern. At 0.8 m/s the sequence was again variable, with a 3-4-3-2-3-2-3-2 pattern, while at the fastest speeds of 0.9 m/s and 1.0 m/s it became a 3-2-3-2-3-2-3-2 pattern.
Fig. 7.
Footfall patterns and periods of support across sessions at all speeds tested. All panels are organized in the same way, with horizontal bars representing the average stance phase duration ± SD of the 4 limbs. Stance durations are normalized to RH onset (RHST). Each horizontal bar is the average of 10 sessions (5 cats × 2 sessions). Intervals between vertical lines are used to identify support periods. The numbers above the panels indicate the number of limbs contacting the treadmill surface during a support period.
Changes in the relative duration of the stance and swing phases with speed also altered the relative duration of each of the eight support periods during a normalized cycle across sessions/animals (Fig. 8). Figure 7 can be used as a reference to verify the onsets and offsets of the eight support periods. All eight support periods were significantly affected by speed (P < 0.001, 1-factor repeated-measures ANOVA, Greenhouse-Geisser correction). Across sessions, support period 1 was a period of triple support at all speeds, with RH, LH, and LF contacting the surface. Period 1 terminated with RF contact at speeds of 0.3–0.8 m/s or with LH liftoff at speeds of 0.9 m/s and 1.0 m/s. Support period 2 was a period of quadruple support at speeds of 0.3–0.8 m/s that ended with LH liftoff. At speeds of 0.9 m/s and 1.0 m/s, support period 2 was a period of diagonal double support (indicated by negative values), with RH and LF contacting the surface, that began with LH liftoff and terminated with RF contact. Support period 3 was a period of triple support at all speeds tested, with RH, RF, and LF contacting the surface. Period 3 began with LH liftoff from 0.3 to 0.8 m/s or with RF contact at 0.9 and 1.0 m/s. Period 3 ended with LF liftoff at all speeds tested. Support period 4 consisted of homolateral double support, with RH and RF contacting the surface, that began with LF liftoff and ended with LH contact. Support period 5 was a period of triple support at all speeds tested, with RH, RF, and LH contacting the surface. This period began with LH contact and ended with LF contact at speeds of 0.3–0.7 m/s or with RH liftoff from 0.8 to 1.0 m/s. Support period 6 was a period of quadruple support from 0.3 to 0.7 m/s that began with LF contact and ended with RH liftoff. At speeds of 0.8–1.0 m/s, support period 6 consisted of diagonal double support (indicated by negative values), with RF and LH contacting the surface, that began with RH liftoff and ended with LF contact. Support period 7 was a period of triple support, with RF, LH, and LF contacting the surface. It began at RH liftoff at 0.3–0.7 m/s or at LF contact at speeds of 0.8–1.0 m/s, and it ended with RF liftoff. Support period 8 was a period of double support, with LH and LF contacting the surface. It began at RF liftoff and ended at RH contact (beginning of next cycle). Therefore, an increase in speed is mostly accomplished by reducing periods of triple support (Fig. 8, A, C, E, and G) and increasing periods of homolateral double support (Fig. 8, D and H). At slower speeds there were periods of quadruple support that were substituted by periods of diagonal double support at higher speeds (Fig. 8, B and F). In summary, a change in locomotor speed alters phase durations. In turn, a change in phase durations alters the pattern of limbs contacting the surface and the relative duration of each of the eight support periods within a normalized locomotor cycle.
Fig. 8.
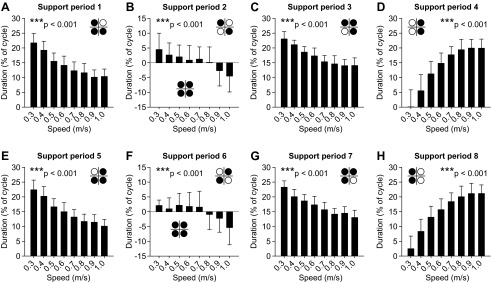
Effect of treadmill speed on the 8 support periods across sessions. A–H indicate support periods 1–8, respectively. The limbs contacting the surface during each period are shown with a footfall diagram (see Fig. 1). Note that support periods 2 (B) and 6 (F) have 2 different footfall patterns, with positive and negative values representing periods of quadruple and double support, respectively. Each vertical bar is the average of 10 sessions (5 cats × 2 sessions) expressed as % of the cycle. Every support period was significantly affected by speed: ***P < 0.001 (1-factor repeated-measures ANOVA).
Speed-Dependent Modulation of Interlimb Coordination
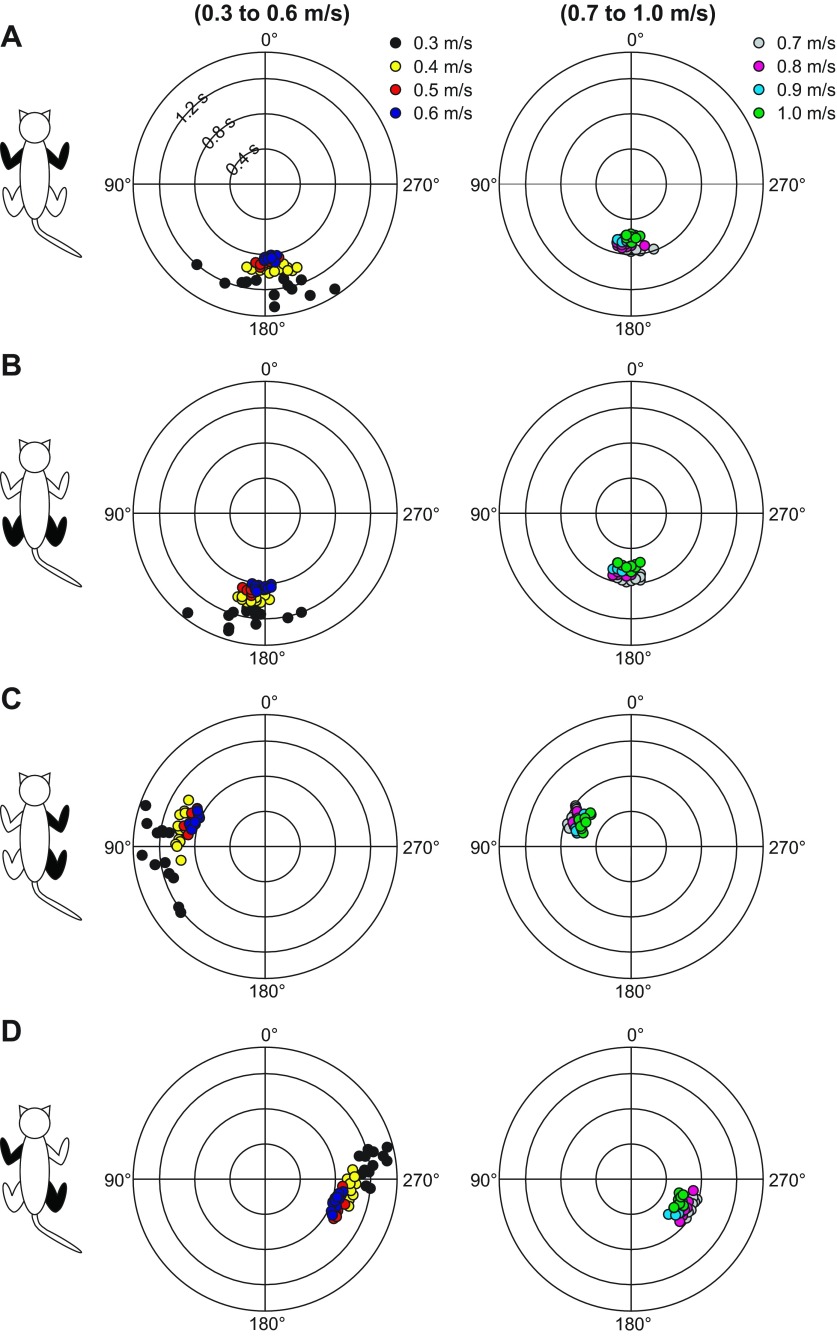
As shown in Fig. 7, changes in the relative duration of the stance and swing phases with speed altered the phasing between paw contacts within a normalized cycle. To quantify speed-dependent changes in interlimb phasing, we used an approach similar to previous studies (English 1979; English and Lennard 1982; Orsal et al. 1990), whereby we measured the phasing between four pairs of limbs at speeds of 0.3–1.0 m/s, in 0.1 m/s increments. Values of 0° or 360° indicate a strict in-phase coupling, while a value of 180° indicates a strict out-of-phase coupling. Previous studies have used values between 270° and 90° to denote an in-phase coupling and values between 90° and 270° for out-of-phase coupling (English and Lennard 1982). Figure 9 shows an example for a single cat in which each data point represents a locomotor cycle. As can be seen, at the slowest speed of 0.3 m/s, the coupling was more variable for all four pairs and became more consistent with increasing speed. At speeds of 0.5–1.0 m/s, all locomotor cycles were tightly clustered around a value. The coupling between homologous forelimbs (Fig. 9A) and hindlimbs (Fig. 9B) was around 180°, indicating a strict out-of-phase coupling. Right homolateral coupling was dispersed around 90° at 0.3 m/s and 0.4 m/s and became tightly clustered around 60° at faster speeds (Fig. 9C). Diagonal coupling between RH and LF maintained an out-of-phase pattern with values around 270° (Fig. 9D).
Fig. 9.
Interlimb phasing over a range of treadmill speeds during quadrupedal locomotion in a session from 1 cat. The phase interval between limb contacts was measured between the left and right forelimbs (A), the left and right hindlimbs (B), the right forelimb and right hindlimb (C), and the left forelimb and right hindlimb (D). The limb pairs shown in each panel are shown in black in the cat diagram on left. The phase interval was then normalized to the cycle duration of the right hindlimb. In the circular plots, phase intervals are expressed in degrees around the circumference while cycle durations are plotted in radii. The values indicated in A for cycle duration are the same in all panels. Left and right: speeds from 0.3 m/s to 0.6 m/s and from 0.7 m/s to 1.0 m/s, respectively. Each data point represents a locomotor cycle.
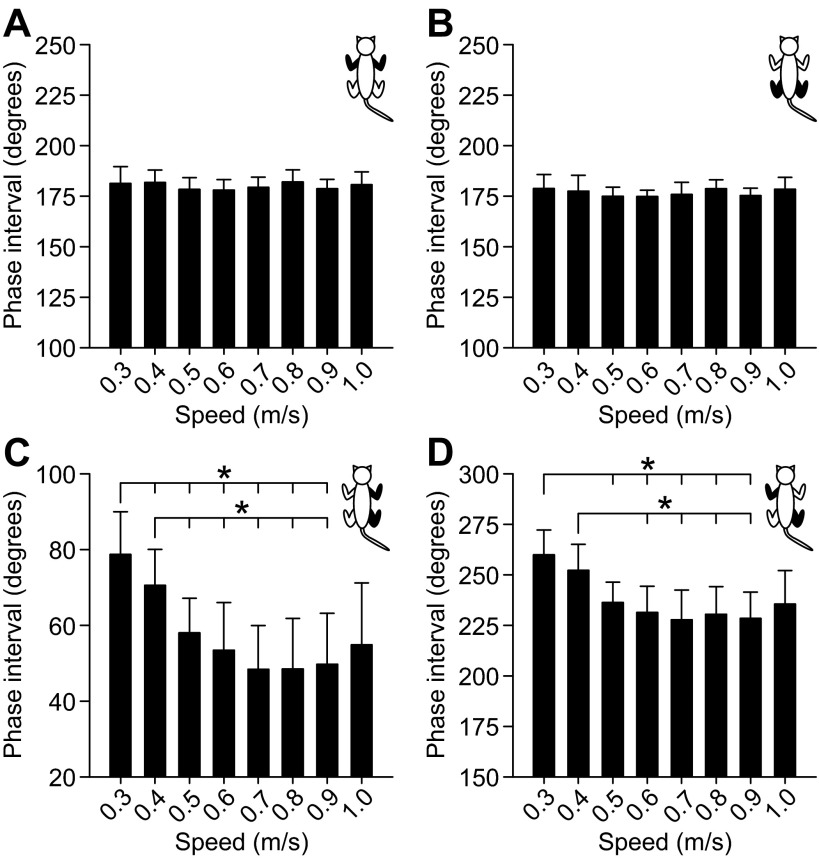
Figure 10 summarizes the coupling between pairs of limbs across sessions/animals. In this figure, each bar represents the mean ± SD phase interval across sessions/animals (n = 10 sessions). There was no significant effect of speed on homologous forelimb (Fig. 10A) and hindlimb (Fig. 10B) coupling (P > 0.05, 1-factor repeated-measures ANOVA). Right homolateral coupling (Fig. 10C) and the diagonal coupling between RH and LF (Fig. 10D) were significantly affected by speed (P < 0.001, 1-factor repeated-measures ANOVA, Greenhouse-Geisser correction). Pairwise comparisons showed that all significant differences were found between the slowest speeds of 0.3 m/s and 0.4 m/s and other faster speeds. Therefore, treadmill speed over the range tested influenced the coordination between the fore- and hindlimbs (i.e., homolateral and diagonal coupling) but not the out-of-phase coupling between homologous limbs.
Fig. 10.
Effect of treadmill speed on the mean phase interval of the 4 different limb pairs across sessions/animals. The mean phase interval between limb contacts is shown for 4 different limb pairs: the left and right forelimbs (A), the left and right hindlimbs (B), the right forelimb and right hindlimb (C), and the left forelimb and right hindlimb (D). The limb pairs shown in each panel are shown in black in the cat diagram at top right. For each cycle, the phase interval was measured between limb contacts and then normalized to the cycle duration of the right hindlimb. It was then multiplied by 360 and expressed in degrees. Each bar is the mean ± SD phase interval of 10 sessions (5 cats × 2 sessions). Asterisks indicate significant differences (pairwise comparisons with Bonferroni correction) between speeds, with the long horizontal line indicating the start of the comparisons (i.e., from 0.3 m/s to other speeds). *P < 0.05.
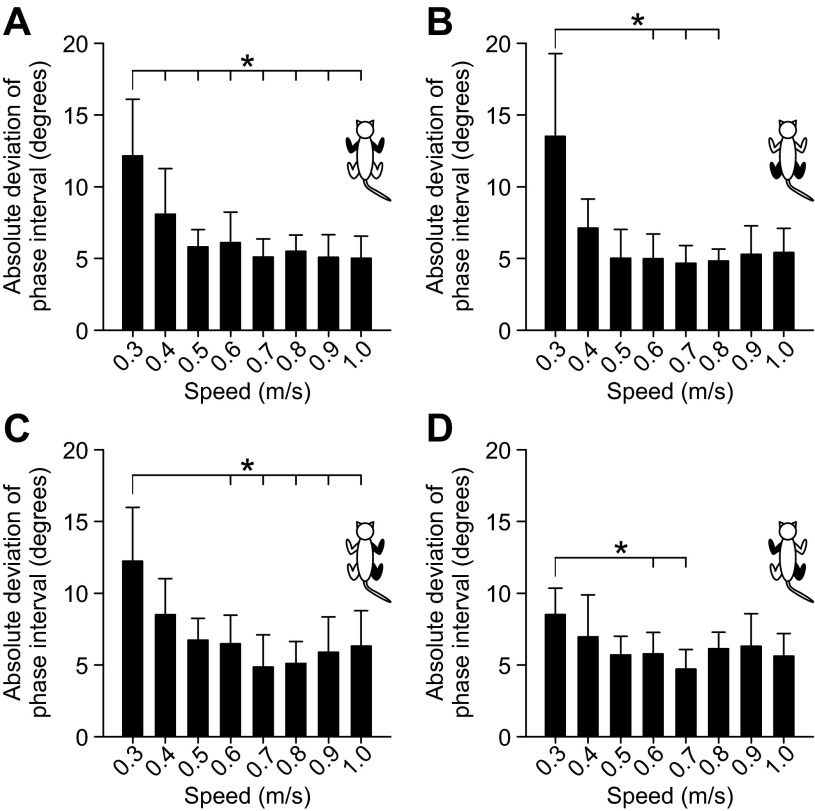
To determine whether the consistency of interlimb phasing was affected by speed, we measured the absolute deviation from the mean value at each speed for the four different couplings (Fig. 11). As an example, in Fig. 9 the values of each data point (i.e., a cycle) for a given limb pair are subtracted from the mean of all data points for that speed. The absolute value is then taken and averaged for the episode. There was a significant effect of speed on the absolute deviation of the phase interval for all four limb pairs (P < 0.001, 1-factor repeated-measures ANOVA). Pairwise comparisons showed that all significant differences were found between the slowest speed of 0.3 m/s and other faster speeds. Therefore, these results indicate that interlimb coordination is more variable, or less consistent, at 0.3 m/s.
Fig. 11.
Effect of treadmill speed on the absolute deviation of phase intervals of the 4 different limb pairs across sessions/animals. The absolute deviation of phase intervals was measured by calculating the absolute difference from the mean at every speed for each cat to then calculate the group average. The averaged absolute deviation of phase intervals is shown for 4 different limb pairs: the left and right forelimbs (A), the left and right hindlimbs (B), the right forelimb and right hindlimb (C), and the left forelimb and right hindlimb (D). The limb pairs shown in each panel are shown in black in the cat diagram at top right. Each bar is the average ± SD absolute deviation of 10 sessions (5 cats × 2 sessions). Asterisks indicate significant differences (pairwise comparisons with Bonferroni correction) between speeds, with the long horizontal line indicating the start of the comparisons (i.e., from 0.3 m/s to other speeds). *P < 0.05.
Relation Between Phase Variations and the Consistency of Interlimb Coordination
Figure 5 showed that the slopes of the linear regressions between the phases (stance, swing) and cycle duration were significantly affected by speed. Figure 11 showed that the absolute deviation of the mean of the phase intervals was significantly affected by speed for all four limb pairs. To determine whether there was a relationship between these variables, we plotted absolute deviation values for the four limb couplings as a function of hindlimb rSTA and rSW. We then measured Pearson's correlation coefficient (PCC) to determine the strength of these relationships. The correlation coefficients were all higher than 0.85 and were all significant at P < 0.01 or P < 0.001 (Fig. 12), indicating that there was a strong linear correlation between hindlimb phase variations and the step-by-step consistency of interlimb coordination.
Fig. 12.
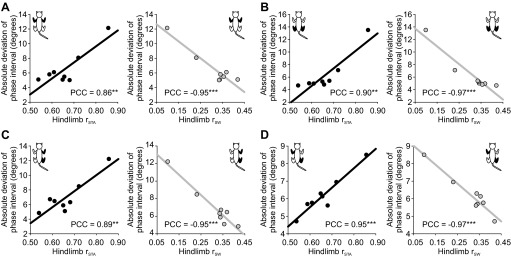
Correlation between phase variations and the consistency of interlimb coordination. A–D show linear regressions between the average absolute deviation of the phase interval for 4 different limb pairs (indicated by black limbs in cat diagram at top left or top right) and hindlimb rSTA (i.e., the slope of the linear regression between stance and cycle duration; left) or hindlimb rSW (i.e., the slope of the linear regression between swing and cycle duration; right). Pearson's correlation coefficient (PCC) is indicated on each panel. Asterisks indicate whether the correlation was significant: **P < 0.01, ***P < 0.001.
Tied-Belt vs. Single-Belt Locomotion
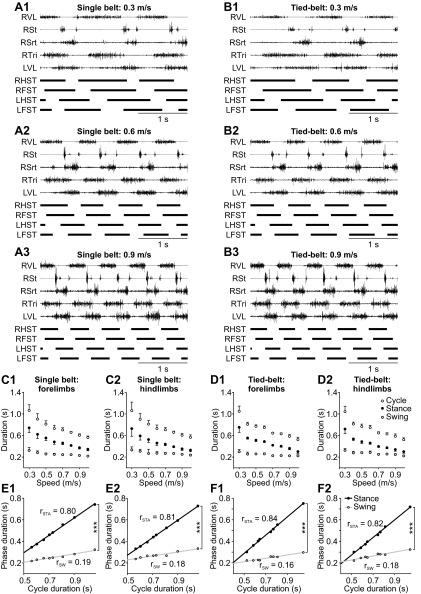
In our experiments, cats walked on two separate belts because they also often performed bouts of left-right split-belt locomotion during these sessions (Frigon et al. 2013). The use of different experimental paradigms within a session is done to maximize the scientific output of each animal. To exclude the possibility that our results were influenced by having cats walk on two separate belts (i.e., tied-belt locomotion), we compared the pattern of one cat during tied-belt and single-belt locomotion across speeds. Figure 13 shows that the locomotor pattern was similar during single-belt (Fig. 13, A, C, and E) and tied-belt (Fig. 13, B, D, and F) locomotion. The slopes of the linear regressions between the phases and cycle duration for the forelimbs (compare Fig. 13, E1 and F1) and hindlimbs (compare Fig. 13, E2 and F2) during single-belt and tied-belt locomotion were almost identical within the session. Thus it is unlikely that our results were influenced by the tied-belt condition.
Fig. 13.
Effect of single-belt vs. tied-belt locomotion on the locomotor pattern in 1 cat. A and B: electromyography from 5 muscles of the right forelimb or hindlimb with stance phases in all 4 limbs (thick horizontal black lines) for 3 s of treadmill locomotion at speeds of 0.3 m/s (1), 0.6 m/s (2), and 0.9 m/s (3) during single-belt (A) and tied-belt (B) locomotion. C and D: stance, swing, and cycle durations in the forelimbs (1) and hindlimbs (2) during single-belt (C) and tied-belt (D) locomotion. Each data point in C and D is the mean ± SD of 13–15 cycles. E and F: simple linear regression analyses of phase durations as a function of cycle duration from the data shown in C and D. The values of rSTA and rSW are indicated. Asterisks indicate significant differences between rSTA and rSW (multiple regression analysis, P < 0.05): ***P < 0.001. LFST, left forelimb stance; LHST, left hindlimb stance; LVL, left vastus lateralis; RFST, right forelimb stance; RHST, right hindlimb stance; RSrt, right sartorius; RSt, right semitendinosus; RTri, right triceps brachii; RVL, right vastus lateralis.
DISCUSSION
The primary novel finding of the present study was that phase variations in the hindlimbs were significantly affected by treadmill speed and that this correlated with the consistency of interlimb coordination on a step-by-step basis. Moreover, the relative duration of all eight support periods as well as the interlimb phasing between the fore- and hindlimbs (homolateral and diagonal coupling) were significantly affected by speed.
Technical Considerations
Measurements of phase and cycle durations are influenced by the sampling rate (i.e., 60 frames/s) used for video recordings. However, we think that this effect on our results is negligible for the following reasons. The largest changes in rSTA and rSW occurred at the slowest speeds. For example, in Fig. 4, rSTA in the hindlimbs decreased from 0.99 at 0.3 m/s (Fig. 4B) to 0.42 at 0.5 m/s (Fig. 4E) while rSW increased from 0.01 (Fig. 4B) to 0.58 (Fig. 4E). At 0.3 m/s, hindlimb stance and swing durations ranged from 0.70 to 1.17 s and from 0.20 to 0.30 s, respectively. At 0.5 m/s, hindlimb stance and swing durations ranged from 0.58 to 0.63 s and from 0.20 to 0.27 s, respectively. Thus, even though swing duration varied within a narrower range at 0.5 m/s compared with 0.3 m/s, rSW increased considerably and the regression of rSW at 0.5 m/s was statistically significant (P < 0.01). Despite the small variations in stance and swing durations at speeds of 0.5 m/s and higher, rSTA and rSW were statistically significant in the majority of cases. At a sampling rate of 60 frames/s, phase and cycle durations are accurate within ±0.017 s. Thus with a range of 0.20–0.27 s this would induce a sampling error of ± 6.2–8.3%, which we feel is negligible because the small underestimation or overestimation of rSTA and rSW would average out across sessions/animals. Moreover, EMG was sampled at 2,000 Hz, where the sampling error would be ±0.0005 s. We found a close match between rSTA and rEXT and between rSW and rFLEX in our data (see Fig. 4) and in the patterns of phase dominance of the hindlimbs measured from kinematic and EMG data (Fig. 6). It has been shown that accuracy in determining stance and swing onsets can be subject dependent (Pantall et al. 2012). In the present study, kinematic events were carefully determined by two experimenters (A. Frigon, G. D'Angelo) and EMG burst onsets and offsets were determined by a single experimenter (A. Frigon). Because of consistent changes in phase and cycle durations across sessions/animals and speeds, it is unlikely that a sampling bias in event detection by the experimenters contributed substantially to the results. Therefore, we conclude that a change in the regulation of phase variations with locomotor speed is a real phenomenon with functional consequences for the control of locomotion.
Interlimb Coordination and Type of Gait Pattern as Function of Speed
During overground locomotion, English (1979) reported that homologous coupling in the fore- and hindlimbs of cats was primarily around 180°, similar to our results (Fig. 9 and Fig. 10). In the same study, homolateral and diagonal coupling were clustered around 180° and 0°, respectively, consistent with a trotting form of locomotion (English 1979). In the present study, we showed that homolateral coupling shifted from values between 45° and 90° at speeds of 0.3 m/s and 0.4 m/s to values clustered between 20° and 70° at higher speeds (see Fig. 10C for mean phase interval values), indicating a transition toward a pacing form of locomotion. It has been reported that cats tend to adopt a pacing gait on the treadmill (Blaszczyk and Loeb 1993). Blaszczyk and Loeb (1993) used homolateral phase differences (interval of time between stance onsets of the homolateral limbs divided by cycle duration) of 0–0.12 to denote a pacing gait during treadmill locomotion. Using the same calculation (data not shown), we found no episodes of pacing at speeds of 0.3 m/s and 0.4 m/s, one episode at 0.5 m/s, two episodes at 0.6 m/s, and three episodes at 0.7 m/s, 0.8 m/s, 0.9 m/s, and 1.0 m/s. Using criteria established by English and Lennard (1982) based on homolateral coupling (i.e., homolateral phase intervals between 315° and 45° in a counterclockwise direction), we found no episodes of pacing at speeds of 0.3 m/s and 0.4 m/s, one episode at 0.5 m/s, two episodes at 0.6 m/s, three episodes at 0.7 m/s and 0.8 m/s, and four episodes at 0.9 m/s and 1.0 m/s. The most frequent type of gait observed in the present study was a low lateral couplet (values between 45° and 90°) at all speeds tested. Because the largest changes in rSTA and rSW occurred at the slowest speeds (i.e., from 0.3 m/s to 0.4 m/s and from 0.4 m/s to 0.5 m/s), it is unlikely that an abrupt change in the gait pattern was responsible due to the fact that we found only one episode of pacing at speeds of 0.5 m/s and below. Differences in several parameters of the gait pattern between treadmill and overground locomotion have been well documented in cats (Blaszczyk and Loeb 1993; Wetzel et al. 1975). One important difference is that stance duration is consistently longer on the treadmill compared with overground locomotion at matched speeds (Blaszczyk and Loeb 1993). If the relative (i.e., as a function of cycle duration) duration of the stance and swing phases is involved in determining phase variations (Frigon and Gossard 2009, 2010), we would predict that the slope of the linear regression between the swing phase and cycle duration would be greater at matched speeds during overground locomotion.
Regulation of Phase Variations During Locomotion
To the best of our knowledge, this is the first study to detail the effect of speed on phase variations during real locomotion. The novelty is that instead of taking an average at a given speed to then plot the phases as a function of cycle duration over several speeds within a session, we measured the slope of the linear regressions between the various phases and cycle duration for individual episodes at several different speeds. This provides an indication of the regulation of phase variations on a step-by-step basis as a function of speed. This approach is similar to Yakovenko et al. (2005) and Frigon and Gossard (2009), where rEXT and rFLEX were determined for several individual episodes obtained during fictive locomotion in curarized decerebrate cats. However, during fictive locomotion, variations in phase and cycle durations occur spontaneously and walking speed cannot be directly manipulated, although pharmacology or electrical stimulation can increase or decrease cycle duration (e.g., Cowley and Schmidt 1994, 1995; Kiehn and Kjaerulff 1996). By analyzing individual episodes over a range of speeds during treadmill locomotion, we found that phase variations on a step-by-step basis were strongly influenced by speed.
Frigon and Gossard (2009) showed that the majority of episodes (24/35) were extensor-dominated during spontaneously occurring fictive locomotion in decerebrate cats, while a smaller percentage were classified as covarying (6/35), flexor dominated (3/35), and invariant (2/35). In the extensor-dominated episodes, cycle duration was 1.22 s ± 0.08 s, whereas in episodes that were covarying, flexor dominated, and invariant cycle durations were 0.91 ± 0.07 s, 0.97 ± 0.11 s, and 0.68 ± 0.04 s, respectively. Moreover, in the same study, 24/26 episodes of fictive locomotion, induced by clonidine or by stimulation of the sciatic nerve, were found to be extensor-dominated in chronically spinalized cats. In these episodes, cycle duration was 1.03 ± 0.08 s. According to our results and those of Halbertsma (1983), cycle durations of 1.03 s and 1.22 s are found at speeds between 0.25 m/s and 0.4 m/s, while cycle durations of 0.91 s and 0.97 s are found between speeds of 0.4 m/s and 0.5 m/s (see Fig. 2). In the present study, the only significant differences for rSTA and rSW were between the slowest speed of 0.3 m/s and faster speeds (Fig. 5B). Therefore, the results obtained in the present study and those obtained during fictive locomotion occurring spontaneously in decerebrate cats and in spinal-transected decerebrated cats are consistent with an effect of rhythm frequency on phase variations. Here we manipulated rhythm frequency (i.e., cycle duration) by changing treadmill speed.
A Sensory-Mediated Mechanism?
Why does the regulation of phase variations on a step-by-step basis change as a function of speed? During locomotion involving real movements (i.e., as opposed to fictive locomotion), spinal CPGs are constantly modulated by descending and sensory inputs that influence phase and cycle durations (Rossignol et al. 2006). Although we can only speculate, it is possible that at slow speeds of locomotion the control of phase variations is mostly governed by sensory feedback related to the stance phase, which occupies most of the cycle. It has been well established that sensory feedback related to limb loading and stretch of ankle extensors can prolong the duration of the stance or extensor phase (Conway et al. 1987; Duysens et al. 2000; Frigon et al. 2010; Frigon and Gossard 2010; Gossard et al. 1994; Guertin et al. 1995; Pearson 2008; Pearson and Collins 1993; Rossignol et al. 2006; Whelan et al. 1995). It has also been shown that sensory feedback from limb loading and/or stretch of ankle extensors can establish or strengthen extensor dominance (Frigon and Gossard 2010; Juvin et al. 2007; Musselman and Yang 2007). Stance-related inputs could even switch a flexor-dominated pattern into an extensor-dominated pattern (see Fig. 4B of Frigon and Gossard 2010). As speed increases, the swing phase occupies an increasingly greater proportion of the cycle and swing-related inputs have more time to influence phase and cycle durations while stance-related inputs have relatively less time. As stated previously, our working hypothesis is that the regulation of phase variations is determined in part by the relative duration of the stance and swing phases (Frigon and Gossard 2009, 2010). However, this cannot be the only mechanism involved, because hindlimb rSTA and rSW show a U-type pattern of change from 0.3 m/s to 1.0 m/s (Fig. 5B). Sensory feedback from group Ib afferents that signal muscle force could explain why rSTA and rSW tend to increase and decrease, respectively, at speeds of 0.8 m/s and higher. Larger ground reaction forces at higher speeds (see, e.g., Munro et al. 1987) would increase group Ib afferent feedback from extensor muscles, which is known to lengthen the duration of the stance/extensor phase during locomotion (Conway et al. 1987; Duysens et al. 2000; Frigon et al. 2010; Gossard et al. 1994; Guertin et al. 1995; Pearson and Collins 1993; Rossignol et al. 2006; Whelan et al. 1995). Greater group I feedback from extensor muscles at higher speeds would increase the excitability of the neuronal elements regulating the durations and variations for the stance/extensor phase, despite the fact that the swing phase occupies an increasingly greater proportion of the cycle. Therefore, during real locomotion phase variations are undoubtedly achieved by a complex interplay between intrinsic mechanisms regulating phase durations within spinal locomotor CPGs and inputs that alter their background excitability, as predicted by modeling efforts (Markin et al. 2010; Spardy et al. 2011b; Yakovenko et al. 2005).
Neural Control of Interlimb Coordination and Locomotor Speed in Mammals
It has been well documented that humans have conserved a quadrupedal-like control of the coordination between the arms and legs during bipedal walking, similar to the cat during quadrupedal locomotion (reviewed in Dietz 2002, 2011; Dietz and Michel 2009; Meyns et al. 2013; Zehr et al. 2004, 2009; Zehr and Duysens 2004). Some have suggested that interlimb coordination during quadrupedal locomotion is achieved by the use of a few basic patterns (Miller et al. 1975a; Miller and Van der Meche 1975), while others have emphasized the variability in interlimb patterns (Wetzel and Stuart 1976). English (1979) proposed that both viewpoints have merit. Recently, we showed that interlimb coordination during transverse split-belt locomotion (i.e., unequal speeds of the fore- and hindlimbs) was markedly different if the forelimbs walked faster than the hindlimbs in intact adult cats (Thibaudier et al. 2013). If the forelimbs walked faster than the hindlimbs, there was an uncoupling of the 1:1 fore:hind rhythm, with the forelimbs taking extra steps. If the hindlimbs walked faster than the forelimbs, a 1:1 fore:hind rhythm was always maintained. In the present study, a 1:1 fore:hind rhythm was maintained across speeds. Although some parameters changed gradually (i.e., leg support patterns, duration of support periods), others showed more pronounced changes from the slowest speeds of 0.3 m/s and 0.4 m/s to speeds of 0.5 m/s and higher (i.e., slopes of linear regressions between phases and cycle duration, interlimb phasing). We propose that although the control of interlimb coordination is flexible and gradual over a range of speeds in intact animals, it can abruptly change when transitioning from slow to moderate speeds and under certain conditions (i.e., forelimbs walking faster than the hindlimbs).
The neural control mechanisms of interlimb coordination and/or locomotor speed in mammals have begun to be elucidated in rodent preparations. For instance, glutamatergic mechanisms were shown to be important in regulating locomotor frequency in neonatal rodent in vitro preparations (Cazalets et al. 1992; Talpalar and Kiehn 2010). Genetic manipulations in mice have also identified different neuronal populations and their putative role in the control of interlimb coordination and speed during locomotion (reviewed in Goulding 2009; Kiehn 2011). The V1 population, a class of local circuit inhibitory neurons, appears critical for speed control, as their genetic ablation considerably prolongs cycle duration in mice (Gosgnach et al. 2006). Studies in neonatal rodents have shown that spinal neurons within a neuronal population, or from different neuronal populations, are recruited based on the locomotor frequency (Crone et al. 2008, 2009; Talpalar et al. 2013; Zhong et al. 2011). Similar results have been found in nonmammalian vertebrates, such as the zebrafish (Ampatzis et al. 2013; Ausborn et al. 2012; Gabriel et al. 2011; McLean et al. 2007, 2008; McLean and Fetcho 2009).
A few studies have found differential neural mechanisms controlling interlimb coordination as a function of locomotor speed in rodent preparations. For instance, V2a spinal interneurons, a class of ipsilaterally projecting glutamatergic neurons, are not required for left-right coordination at slow locomotor frequencies but become essential at higher frequencies in neonatal mice (Crone et al. 2008, 2009). Using intersectional genetics in mice, a recent study elegantly showed that, depending on the locomotor frequency, different populations of V0 neurons, a major class of commissural neurons located in the ventral spinal cord, were required for left-right coordination (Talpalar et al. 2013). Although the range of locomotor frequencies found in mice (slow: 2–4 Hz, moderate to fast: 4–10 Hz) is not directly comparable to the locomotor cadence of cats and humans, these studies illustrate a differential control of interlimb coordination based on the oscillation frequency of locomotor CPGs in mammals. In other words, the neural mechanisms (e.g., the active set of neurons) regulating interlimb coordination change from slow to fast locomotor speeds.
Functional Considerations and Concluding Remarks
An important question remains: What is the functional consequence of simultaneously regulating the stance and swing phases at moderate to fast speeds? Figure 12 showed that hindlimb phase variations strongly correlated with the consistency of interlimb coordination. It is possible that simultaneous regulation of stance and swing phases on a step-by-step basis improves the consistency of interlimb coordination, thus optimizing dynamic stability. It has also been proposed that less variable stance and swing durations at higher speeds improve dynamic stability (Maes et al. 2008; Seyfarth et al. 2003). Increased step variability during human walking has also been associated with greater energetic cost (O'Connor et al. 2012).
Recently, a study measured the slopes of the linear regressions between the phases and cycle duration after spinal lesions (spinal hemisection followed by spinal transection) to assess intrinsic changes within spinal locomotor networks (Martinez et al. 2012). However, as shown recently (Frigon et al. 2013) and in the present study, the slopes of these regressions can be altered by modifying left-right coordination and by locomotor speed. As such, changes in phase variations after spinal hemisection could be due to asymmetries in the gait pattern (e.g., asymmetry in sensory feedback from the left and right sides) or a change in cadence at a given treadmill speed, and not necessarily to plasticity within spinal locomotor CPGs.
From a clinical perspective, elucidating the mechanisms controlling locomotor speed and/or interlimb coordination is important because these two parameters are often severely disrupted after spinal cord injury and they seem to be deeply intertwined. For instance, in human patients with an incomplete spinal cord injury with residual capacity to walk, some of the most visible changes in the locomotor pattern are a reduction in preferred walking speed, an inability to walk at fast speeds, and/or a decreased capacity to sustain walking at fast speeds (Pepin et al. 2003a, 2003b). Spinal cord-injured patients display poor interlimb coordination between the arms and legs, and the majority of patients do not move their arms during walking (Tester et al. 2011, 2012). Impairments in interlimb coordination could be due to the slower walking speeds adopted by many spinal cord-injured patients, or the slower walking speeds could impair interlimb coordination. Therefore, a better understanding of how interlimb coordination and speed are regulated and adjusted before and after spinal lesions could lead to strategies aimed at promoting and sustaining faster walking speed in spinal cord-injured patients.
GRANTS
The present research was funded by a Discovery Grant and by a Research Tools and Infrastructure Grant from the Natural Sciences and Engineering Research Council of Canada to A. Frigon.
DISCLOSURES
No conflicts of interest, financial or otherwise, are declared by the author(s).
AUTHOR CONTRIBUTIONS
Author contributions: A.F. conception and design of research; A.F., G.D., Y.T., M.-F.H., A.T., and V.K. performed experiments; A.F., G.D., and C.D. analyzed data; A.F. interpreted results of experiments; A.F. prepared figures; A.F. drafted manuscript; A.F., G.D., Y.T., M.-F.H., A.T., V.K., and C.D. edited and revised manuscript; A.F., G.D., Y.T., M.-F.H., A.T., V.K., and C.D. approved final version of manuscript.
REFERENCES
- Abourachid A, Herbin M, Hackert R, Maes L, Martin V. Experimental study of coordination patterns during unsteady locomotion in mammals. J Exp Biol 210: 366–372, 2007 [DOI] [PubMed] [Google Scholar]
- Ampatzis K, Song J, Ausborn J, El Manira A. Pattern of innervation and recruitment of different classes of motoneurons in adult zebrafish. J Neurosci 33: 10875–10886, 2013 [DOI] [PMC free article] [PubMed] [Google Scholar]
- Arshavskii I, Kots I, Orlovskii GN, Rodionov IM, Shik ML. [Study of biomechanics of running dogs]. Biofizika 10: 665–671, 1965 [PubMed] [Google Scholar]
- Ausborn J, Mahmood R, El Manira A. Decoding the rules of recruitment of excitatory interneurons in the adult zebrafish locomotor network. Proc Natl Acad Sci USA 109: E3631–E3639, 2012 [DOI] [PMC free article] [PubMed] [Google Scholar]
- Blaszczyk J, Loeb GE. Why cats pace on the treadmill. Physiol Behav 53: 501–507, 1993 [DOI] [PubMed] [Google Scholar]
- Cazalets JR, Sqalli-Houssaini Y, Clarac F. Activation of the central pattern generators for locomotion by serotonin and excitatory amino acids in neonatal rat. J Physiol 455: 187–204, 1992 [DOI] [PMC free article] [PubMed] [Google Scholar]
- Cohen AH, Gans C. Muscle activity in rat locomotion: movement analysis and electromyography of the flexors and extensors of the elbow. J Morphol 146: 177–196, 1975 [DOI] [PubMed] [Google Scholar]
- Conway BA, Hultborn H, Kiehn O. Proprioceptive input resets central locomotor rhythm in the spinal cat. Exp Brain Res 68: 643–656, 1987 [DOI] [PubMed] [Google Scholar]
- Cowley KC, Schmidt BJ. A comparison of motor patterns induced by N-methyl-d-aspartate, acetylcholine and serotonin in the in vitro neonatal rat spinal cord. Neurosci Lett 171: 147–150, 1994 [DOI] [PubMed] [Google Scholar]
- Cowley KC, Schmidt BJ. Effects of inhibitory amino acid antagonists on reciprocal inhibitory interactions during rhythmic motor activity in the in vitro neonatal rat spinal cord. J Neurophysiol 74: 1109–1117, 1995 [DOI] [PubMed] [Google Scholar]
- Crone SA, Quinlan KA, Zagoraiou L, Droho S, Restrepo CE, Lundfald L, Endo T, Setlak J, Jessell TM, Kiehn O, Sharma K. Genetic ablation of V2a ipsilateral interneurons disrupts left-right locomotor coordination in mammalian spinal cord. Neuron 60: 70–83, 2008 [DOI] [PubMed] [Google Scholar]
- Crone SA, Zhong G, Harris-Warrick R, Sharma K. In mice lacking V2a interneurons, gait depends on speed of locomotion. J Neurosci 29: 7098–7109, 2009 [DOI] [PMC free article] [PubMed] [Google Scholar]
- Dietz V. Do human bipeds use quadrupedal coordination? Trends Neurosci 25: 462–467, 2002 [DOI] [PubMed] [Google Scholar]
- Dietz V. Quadrupedal coordination of bipedal gait: implications for movement disorders. J Neurol 258: 1406–1412, 2011 [DOI] [PubMed] [Google Scholar]
- Dietz V, Michel J. Human bipeds use quadrupedal coordination during locomotion. Ann NY Acad Sci 1164: 97–103, 2009 [DOI] [PubMed] [Google Scholar]
- Duysens J, Clarac F, Cruse H. Load-regulating mechanisms in gait and posture: comparative aspects. Physiol Rev 80: 83–133, 2000 [DOI] [PubMed] [Google Scholar]
- English AW. Interlimb coordination during stepping in the cat: an electromyographic analysis. J Neurophysiol 42: 229–243, 1979 [DOI] [PubMed] [Google Scholar]
- English AW, Lennard PR. Interlimb coordination during stepping in the cat: in-phase stepping and gait transitions. Brain Res 245: 353–364, 1982 [DOI] [PubMed] [Google Scholar]
- Fleshman JW, Lev-Tov A, Burke RE. Peripheral and central control of flexor digitorum longus and flexor hallucis longus motoneurons: the synaptic basis of functional diversity. Exp Brain Res 54: 133–149, 1984 [DOI] [PubMed] [Google Scholar]
- Frigon A. Central pattern generators of the mammalian spinal cord. Neuroscientist 18: 56–69, 2012 [DOI] [PubMed] [Google Scholar]
- Frigon A, Gossard JP. Asymmetric control of cycle period by the spinal locomotor rhythm generator in the adult cat. J Physiol 587: 4617–4628, 2009 [DOI] [PMC free article] [PubMed] [Google Scholar]
- Frigon A, Gossard JP. Evidence for specialized rhythm-generating mechanisms in the adult mammalian spinal cord. J Neurosci 30: 7061–7071, 2010 [DOI] [PMC free article] [PubMed] [Google Scholar]
- Frigon A, Hurteau MF, Thibaudier Y, Leblond H, Telonio A, D'Angelo G. Split-belt walking alters the relationship between locomotor phases and cycle duration across speeds in intact and chronic spinalized adult cats. J Neurosci 33: 8559–8566, 2013 [DOI] [PMC free article] [PubMed] [Google Scholar]
- Frigon A, Sirois J, Gossard JP. Effects of ankle and hip muscle afferent inputs on rhythm generation during fictive locomotion. J Neurophysiol 103: 1591–1605, 2010 [DOI] [PubMed] [Google Scholar]
- Gabriel JP, Ausborn J, Ampatzis K, Mahmood R, Eklof-Ljunggren E, El Manira A. Principles governing recruitment of motoneurons during swimming in zebrafish. Nat Neurosci 14: 93–99, 2011 [DOI] [PubMed] [Google Scholar]
- Gabriel JP, Buschges A. Control of stepping velocity in a single insect leg during walking. Philos Trans A Math Phys Eng Sci 365: 251–271, 2007 [DOI] [PubMed] [Google Scholar]
- Gosgnach S, Lanuza GM, Butt SJ, Saueressig H, Zhang Y, Velasquez T, Riethmacher D, Callaway EM, Kiehn O, Goulding M. V1 spinal neurons regulate the speed of vertebrate locomotor outputs. Nature 440: 215–219, 2006 [DOI] [PubMed] [Google Scholar]
- Goslow GE, Jr, Reinking RM, Stuart DG. The cat step cycle: hind limb joint angles and muscle lengths during unrestrained locomotion. J Morphol 141: 1–41, 1973 [DOI] [PubMed] [Google Scholar]
- Gossard JP, Brownstone RM, Barajon I, Hultborn H. Transmission in a locomotor-related group Ib pathway from hindlimb extensor muscles in the cat. Exp Brain Res 98: 213–228, 1994 [DOI] [PubMed] [Google Scholar]
- Gossard JP, Sirois J, Noue P, Cote MP, Menard A, Leblond H, Frigon A. Chapter 2—the spinal generation of phases and cycle duration. Prog Brain Res 188: 15–29, 2011 [DOI] [PubMed] [Google Scholar]
- Goulding M. Circuits controlling vertebrate locomotion: moving in a new direction. Nat Rev Neurosci 10: 507–518, 2009 [DOI] [PMC free article] [PubMed] [Google Scholar]
- Gray J. Animal Locomotion (The World Naturalist). New York: Norton, 1968 [Google Scholar]
- Grillner S, Dubuc R. Control of locomotion in vertebrates: spinal and supraspinal mechanisms. Adv Neurol 47: 425–453, 1988 [PubMed] [Google Scholar]
- Grillner S, Halbertsma J, Nilsson J, Thorstensson A. The adaptation to speed in human locomotion. Brain Res 165: 177–182, 1979 [DOI] [PubMed] [Google Scholar]
- Grillner S, Zangger P. On the central generation of locomotion in the low spinal cat. Exp Brain Res 34: 241–261, 1979 [DOI] [PubMed] [Google Scholar]
- Grillner S, Zangger P. The effect of dorsal root transection on the efferent motor pattern in the cat's hindlimb during locomotion. Acta Physiol Scand 120: 393–405, 1984 [DOI] [PubMed] [Google Scholar]
- Gruhn M, von Uckermann G, Westmark S, Wosnitza A, Buschges A, Borgmann A. Control of stepping velocity in the stick insect Carausius morosus. J Neurophysiol 102: 1180–1192, 2009 [DOI] [PMC free article] [PubMed] [Google Scholar]
- Guertin P, Angel MJ, Perreault MC, McCrea DA. Ankle extensor group I afferents excite extensors throughout the hindlimb during fictive locomotion in the cat. J Physiol 487: 197–209, 1995 [DOI] [PMC free article] [PubMed] [Google Scholar]
- Halbertsma JM. The stride cycle of the cat: the modelling of locomotion by computerized analysis of automatic recordings. Acta Physiol Scand Suppl 521: 1–75, 1983 [PubMed] [Google Scholar]
- Hildebrand M. Symmetrical gaits of primates. Am J Phys Anthropol 26: 119–130, 1967 [Google Scholar]
- Jacobson RD, Hollyday M. A behavioral and electromyographic study of walking in the chick. J Neurophysiol 48: 238–256, 1982 [DOI] [PubMed] [Google Scholar]
- Juvin L, Simmers J, Morin D. Locomotor rhythmogenesis in the isolated rat spinal cord: a phase-coupled set of symmetrical flexion extension oscillators. J Physiol 583: 115–128, 2007 [DOI] [PMC free article] [PubMed] [Google Scholar]
- Kiehn O. Development and functional organization of spinal locomotor circuits. Curr Opin Neurobiol 21: 100–109, 2011 [DOI] [PubMed] [Google Scholar]
- Kiehn O, Kjaerulff O. Spatiotemporal characteristics of 5-HT and dopamine-induced rhythmic hindlimb activity in the in vitro neonatal rat. J Neurophysiol 75: 1472–1482, 1996 [DOI] [PubMed] [Google Scholar]
- Kriellaars DJ, Brownstone RM, Noga BR, Jordan LM. Mechanical entrainment of fictive locomotion in the decerebrate cat. J Neurophysiol 71: 2074–2086, 1994 [DOI] [PubMed] [Google Scholar]
- Lemelin P, Schmitt D, Cartmill M. Footfall patterns and interlimb co-ordination in opossums (Family Didelphidae): evidence for the evolution of diagonal-sequence walking gaits in primates. J Zool Lond 260: 423–429, 2003 [Google Scholar]
- Maes L, Abourachid A. Gait transitions and modular organization of mammal locomotion. J Exp Biol 216: 2257–2265, 2013 [DOI] [PubMed] [Google Scholar]
- Maes LD, Herbin M, Hackert R, Bels VL, Abourachid A. Steady locomotion in dogs: temporal and associated spatial coordination patterns and the effect of speed. J Exp Biol 211: 138–149, 2008 [DOI] [PubMed] [Google Scholar]
- Markin SN, Klishko AN, Shevtsova NA, Lemay MA, Prilutsky BI, Rybak IA. Afferent control of locomotor CPG: insights from a simple neuromechanical model. Ann NY Acad Sci 1198: 21–34, 2010 [DOI] [PMC free article] [PubMed] [Google Scholar]
- Martinez M, Delivet-Mongrain H, Leblond H, Rossignol S. Incomplete spinal cord injury promotes durable functional changes within the spinal locomotor circuitry. J Neurophysiol 108: 124–134, 2012 [DOI] [PubMed] [Google Scholar]
- McLean DL, Fan J, Higashijima S, Hale ME, Fetcho JR. A topographic map of recruitment in spinal cord. Nature 446: 71–75, 2007 [DOI] [PubMed] [Google Scholar]
- McLean DL, Fetcho JR. Spinal interneurons differentiate sequentially from those driving the fastest swimming movements in larval zebrafish to those driving the slowest ones. J Neurosci 29: 13566–13577, 2009 [DOI] [PMC free article] [PubMed] [Google Scholar]
- McLean DL, Masino MA, Koh IY, Lindquist WB, Fetcho JR. Continuous shifts in the active set of spinal interneurons during changes in locomotor speed. Nat Neurosci 11: 1419–1429, 2008 [DOI] [PMC free article] [PubMed] [Google Scholar]
- Meyns P, Bruijn SM, Duysens J. The how and why of arm swing during human walking. Gait Posture 38: 555–562, 2013 [DOI] [PubMed] [Google Scholar]
- Miller S, Van Der Burg J, Van Der Meche F. Coordination of movements of the hindlimbs and forelimbs in different forms of locomotion in normal and decerebrate cats. Brain Res 91: 217–237, 1975a [DOI] [PubMed] [Google Scholar]
- Miller S, Van Der Burg J, Van Der Meche F. Locomotion in the cat: basic programmes of movement. Brain Res 91: 239–253, 1975b [DOI] [PubMed] [Google Scholar]
- Miller S, Van der Meche FG. Movements of the forelimbs of the cat during stepping on a treadmill. Brain Res 91: 255–269, 1975 [DOI] [PubMed] [Google Scholar]
- Munro CF, Miller DI, Fuglevand AJ. Ground reaction forces in running: a reexamination. J Biomech 20: 147–155, 1987 [DOI] [PubMed] [Google Scholar]
- Musselman KE, Yang JF. Loading the limb during rhythmic leg movements lengthens the duration of both flexion and extension in human infants. J Neurophysiol 97: 1247–1257, 2007 [DOI] [PubMed] [Google Scholar]
- Nilsson J, Thorstensson A, Halbertsma J. Changes in leg movements and muscle activity with speed of locomotion and mode of progression in humans. Acta Physiol Scand 123: 457–475, 1985 [DOI] [PubMed] [Google Scholar]
- O'Connor SM, Xu HZ, Kuo AD. Energetic cost of walking with increased step variability. Gait Posture 36: 02–107, 2012 [DOI] [PMC free article] [PubMed] [Google Scholar]
- Orsal D, Cabelguen JM, Perret C. Interlimb coordination during fictive locomotion in the thalamic cat. Exp Brain Res 82: 536–546, 1990 [DOI] [PubMed] [Google Scholar]
- Pantall A, Gregor RJ, Prilutsky BI. Stance and swing phase detection during level and slope walking in the cat: effects of slope, injury, subject and kinematic detection method. J Biomech 45: 1529–1533, 2012 [DOI] [PMC free article] [PubMed] [Google Scholar]
- Pearson KG. Role of sensory feedback in the control of stance duration in walking cats. Brain Res Rev 57: 222–227, 2008 [DOI] [PubMed] [Google Scholar]
- Pearson KG, Collins DF. Reversal of the influence of group Ib afferents from plantaris on activity in medial gastrocnemius muscle during locomotor activity. J Neurophysiol 70: 1009–1017, 1993 [DOI] [PubMed] [Google Scholar]
- Pearson KG, Rossignol S. Fictive motor patterns in chronic spinal cats. J Neurophysiol 66: 1874–1887, 1991 [DOI] [PubMed] [Google Scholar]
- Pepin A, Ladouceur M, Barbeau H. Treadmill walking in incomplete spinal-cord-injured subjects. 2. Factors limiting the maximal speed. Spinal Cord 41: 271–279, 2003a [DOI] [PubMed] [Google Scholar]
- Pepin A, Norman KE, Barbeau H. Treadmill walking in incomplete spinal-cord-injured subjects. 1. Adaptation to changes in speed. Spinal Cord 41: 257–270, 2003b [DOI] [PubMed] [Google Scholar]
- Rossignol S, Dubuc R, Gossard JP. Dynamic sensorimotor interactions in locomotion. Physiol Rev 86: 89–154, 2006 [DOI] [PubMed] [Google Scholar]
- Seyfarth A, Geyer H, Herr H. Swing-leg retraction: a simple control model for stable running. J Exp Biol 206: 2547–2555, 2003 [DOI] [PubMed] [Google Scholar]
- Spardy LE, Markin SN, Shevtsova NA, Prilutsky BI, Rybak IA, Rubin JE. A dynamical systems analysis of afferent control in a neuromechanical model of locomotion. I. Rhythm generation. J Neural Eng 8: 065003, 2011a [DOI] [PMC free article] [PubMed] [Google Scholar]
- Spardy LE, Markin SN, Shevtsova NA, Prilutsky BI, Rybak IA, Rubin JE. A dynamical systems analysis of afferent control in a neuromechanical model of locomotion. II. Phase asymmetry. J Neural Eng 8: 065004, 2011b [DOI] [PMC free article] [PubMed] [Google Scholar]
- Stevens NJ. Stability, limb coordination and substrate type: the ecorelevance of gait sequence pattern in primates. J Exp Zool A Comp Exp Biol 305: 953–963, 2006 [DOI] [PubMed] [Google Scholar]
- Talpalar AE, Bouvier J, Borgius L, Fortin G, Pierani A, Kiehn O. Dual-mode operation of neuronal networks involved in left-right alternation. Nature 500: 85–88, 2013 [DOI] [PubMed] [Google Scholar]
- Talpalar AE, Kiehn O. Glutamatergic mechanisms for speed control and network operation in the rodent locomotor CpG. Front Neural Circuits 4: 19, 2010 [DOI] [PMC free article] [PubMed] [Google Scholar]
- Tester NJ, Barbeau H, Howland DR, Cantrell A, Behrman AL. Arm and leg coordination during treadmill walking in individuals with motor incomplete spinal cord injury: a preliminary study. Gait Posture 36: 49–55, 2012 [DOI] [PMC free article] [PubMed] [Google Scholar]
- Tester NJ, Howland DR, Day KV, Suter SP, Cantrell A, Behrman AL. Device use, locomotor training and the presence of arm swing during treadmill walking after spinal cord injury. Spinal Cord 49: 451–456, 2011 [DOI] [PMC free article] [PubMed] [Google Scholar]
- Thibaudier Y, Hurteau MF, Telonio A, Frigon A. Coordination between the fore- and hindlimbs is bidirectional, asymmetrically organized, and flexible during quadrupedal locomotion in the intact adult cat. Neuroscience 240: 13–26, 2013 [DOI] [PubMed] [Google Scholar]
- Vilensky JA. Gait characteristics of two macaques, with emphasis on relationships with speed. Am J Phys Anthropol 61: 255–265, 1983 [DOI] [PubMed] [Google Scholar]
- Wetzel MC, Atwater AE, Wait JV, Stuart DC. Neural implications of different profiles between treadmill and overground locomotion timings in cats. J Neurophysiol 38: 492–501, 1975 [DOI] [PubMed] [Google Scholar]
- Wetzel MC, Stuart DG. Ensemble characteristics of cat locomotion and its neural control. Prog Neurobiol 7: 1–98, 1976 [DOI] [PubMed] [Google Scholar]
- Whelan PJ, Hiebert GW, Pearson KG. Stimulation of the group I extensor afferents prolongs the stance phase in walking cats. Exp Brain Res 103: 20–30, 1995 [DOI] [PubMed] [Google Scholar]
- Williams TL. Experimental analysis of the gait and frequency of locomotion in the tortoise, with a simple mathematical description. J Physiol 310: 307–320, 1981 [DOI] [PMC free article] [PubMed] [Google Scholar]
- Yakovenko S, McCrea DA, Stecina K, Prochazka A. Control of locomotor cycle durations. J Neurophysiol 94: 1057–1065, 2005 [DOI] [PubMed] [Google Scholar]
- Yang JF, Lamont EV, Pang MY. Split-belt treadmill stepping in infants suggests autonomous pattern generators for the left and right leg in humans. J Neurosci 25: 6869–6876, 2005 [DOI] [PMC free article] [PubMed] [Google Scholar]
- Zehr EP, Carroll TJ, Chua R, Collins DF, Frigon A, Haridas C, Hundza SR, Thompson AK. Possible contributions of CPG activity to the control of rhythmic human arm movement. Can J Physiol Pharmacol 82: 556–568, 2004 [DOI] [PubMed] [Google Scholar]
- Zehr EP, Duysens J. Regulation of arm and leg movement during human locomotion. Neuroscientist 10: 347–361, 2004 [DOI] [PubMed] [Google Scholar]
- Zehr EP, Hundza SR, Vasudevan EV. The quadrupedal nature of human bipedal locomotion. Exerc Sport Sci Rev 37: 102–108, 2009 [DOI] [PubMed] [Google Scholar]
- Zhong G, Sharma K, Harris-Warrick RM. Frequency-dependent recruitment of V2a interneurons during fictive locomotion in the mouse spinal cord. Nat Commun 2: 274, 2011 [DOI] [PMC free article] [PubMed] [Google Scholar]


