Abstract
Single-unit recording in monkeys and functional imaging of the human frontal lobe indicate that the supplementary eye field (SEF) and the frontal eye field (FEF) are involved in ocular decision making. To test whether these structures have distinct roles in decision making, single-neuron activity was recorded from each structure while monkeys executed an ocular go/nogo task. The task rule is to pursue a moving target if it intersects a visible square or “go zone.” We found that most SEF neurons showed differential go/nogo activity during the delay period, before the target intersected the go zone (delay period), whereas most FEF neurons did so after target intersection, during the period in which the movement was executed (movement period). Choice probability (CP) for SEF neurons was high in the delay period but decreased in the movement period, whereas for FEF neurons it was low in the delay period and increased in the movement period. Directional selectivity of SEF neurons was low throughout the trial, whereas that of FEF neurons was highest in the delay period, decreasing later in the trial. Increasing task difficulty led to later discrimination between go and nogo in both structures and lower CP in the SEF, but it did not affect CP in the FEF. The results suggest that the SEF interprets the task rule early but is less involved in executing the motor decision than is the FEF and that these two areas collaborate dynamically to execute ocular decisions.
Keywords: decision making, smooth pursuit, ocular baseball, go/nogo task, choice probability, rule-based decision
much research has been done to determine the functional pathways for decision making in the primate brain. Part of this work was initiated in visual cortex in studies that targeted the medial temporal cortex (MT) and the lateral intraparietal sulcus (LIP). MT is at the perceptual stage in the decision-making stream. It has been shown that MT neurons can indicate whether a stimulus moves in a direction with an angle clockwise or counterclockwise to a decision boundary [e.g., decide whether stimulus motion has a rightward or leftward component relative to up (Britten et al. 1996; Newsome et al. 1989)]. However, when the decision boundary is changed, because of their strict selectivity for the direction of the moving stimulus, MT neurons lack the flexibility to signal motion directions that fall outside of their tuning range (Britten et al. 1996). The relatively hard-wired nature of sensory motion neurons also limits their level of choice probability (CP), which characterizes how well a neuron reflects the behavioral decision that is specified by the motion stimulus (Britten et al. 1996; Purushothaman and Bradley 2005).
LIP is also involved in perceptual decision making (Shadlen and Newsome 2001). Neurons here are normally directionally selective (Andersen et al. 1992; Colby et al. 1996; Snyder et al. 2000), which should in theory limit the amount of flexibility they have in deciding the direction of moving stimuli. However, there is evidence that LIP neurons can modify their tuning to respond to motion directions that fall outside of their inherent tuning range to reclassify those motions when the decision boundary changes (Freedman and Assad 2006). In this work, the animals (and neurons) were trained to classify two sets of motions with respect to a single decision boundary. Most cells that were tested classified the motions correctly. Following a period of retraining with two new sets of motions and a new boundary, the neurons adjusted to the new boundary and were able to encode the new motions. This indicates that the LIP has a more flexible role than MT in decision making. Consistent with this, LIP neurons have higher CP than do MT neurons (Law and Gold 2008).
The frontal lobe could be involved in linking perceptual decisions performed in posterior cortical areas to movement decisions. Recent work has revealed neural activity related to sensorimotor decisions in various frontal substrates, including the prefrontal cortex (PFC; Muhammad et al. 2006; Wallis and Miller 2003; White and Wise 1999) and the premotor cortex (PMC; Muhammad et al. 2006; Wallis and Miller 2003). These studies have shown that PFC neurons encode perceptual categories, whereas those in the PMC display a mixture of activity reflecting either perceptual categories or motor alternatives. The differential activity in these areas is consistent with the anatomic organization of the frontal lobe, as the PFC receives inputs from posterior sensory areas (Miller 1999; Passingham 1985, 1993), and the PMC receives inputs from the PFC (Barbas and Pandya 1989, 1991; Pandya and Yeterian 1990). Therefore, there appears to be a cascade of neural events in the frontal lobe that transforms perceptual signals into motor decisions.
We have adopted a different type of task to study decision making in structures beyond perceptual areas that process motion for action. This task is a go/nogo eye movement task that we call “ocular baseball” (Heinen et al. 2006; Kim et al. 2005; Yang et al. 2010). In ocular baseball, a target approaches a visible go zone on a computer screen while the observer fixates a spot in the center of the screen. If the target intersects the zone, the observer must follow it with a pursuit eye movement; if not, the observer must maintain fixation. The delay period between when the target begins to move, and when it intersects the go zone allows us to distinguish whether neural activity is more related to rule interpretation or movement execution.
Recently, using a modified version of this task, we demonstrated that neurons in the supplementary eye field (SEF) are relatively flexible in their interpretation of a changing decision boundary (Heinen et al. 2012). These neurons interpret identical motion trajectories as conforming to different rule states (go vs. nogo) when the decision boundary is changed and can do it rapidly when it is changed from trial to trial. Because the interpretation is independent of motion direction, this places the SEF beyond motion perception regions in the decision-making stream. CP here is also high (Yang et al. 2010) relative to that of sensory neurons (Britten et al. 1996; Shadlen and Newsome 2001). However, the SEF may lie before movement control regions because SEF neurons have poor directional tuning and their activity does not agree with the movement on error trials (Yang et al. 2010). Consistent with this, the SEF is involved more in the ocular countermanding decision than in pursuit and saccade generation (Shichinohe et al. 2009; Stuphorn et al. 2009).
To complete the ocular decision process, signals from the SEF are likely transformed into a motor command. A candidate structure should have movement neurons that are directionally tuned, with activity that agrees with the movement decision. The frontal eye field (FEF) potentially participates in this transformation. The FEF has extensive reciprocal connections with the SEF (Huerta et al. 1987; Luppino et al. 2003). Both the SEF and FEF are active in many ocular decision tasks such as the antisaccade task (Amador et al. 2004; Schlag-Rey et al. 1997) and the countermanding paradigm (Brown et al. 2008; Hanes et al. 1998; Stuphorn and Schall 2006; Stuphorn et al. 2000). In a functional imaging study in humans designed to isolate cortical areas active during go/nogo ocular baseball, the SEF and FEF were active for the decision component of the task (Heinen et al. 2006).
Recent research suggests differential SEF and FEF involvement in decision making for smooth pursuit and saccades (Fukushima et al. 2011; Stuphorn et al. 2010). The SEF appears to be more involved in signaling and maintaining a decision during memory-based pursuit, whereas the FEF seems to be more directly responsible for pursuit generation (Fukushima et al. 2011). Compared with the FEF, SEF activity is more predictive of changes in saccade latency than saccade generation in a countermanding task (Hanes et al. 1998; Stuphorn et al. 2010). These findings suggest a more upstream position for the SEF than the FEF in eye movement generation during decision tasks.
The present study examined whether neurons in the FEF and SEF are involved in different stages of the ocular decision. We recorded the activity of neurons in each structure while monkeys performed the go/nogo ocular baseball task. Task difficulty was manipulated to alter the timing and accuracy of the decision, and activity was analyzed separately for the delay and movement periods of the task. CP as well as rule and directional selectivity (RI and DI) of SEF and FEF neurons were computed throughout the trial to determine the temporal evolution of task-related signals in each structure.
METHODS
Subjects and Surgical Procedures
Two juvenile, male macaque monkeys (ED and LE) were involved in the study. Surgeries were performed to implant SEF and FEF recording chambers, a head holder, and a search coil on one eye to measure eye movements. SEF chambers were centered 21.5 mm anterior and 18 mm to the right of centerline in Horsley-Clark stereotaxic coordinates; FEF chambers were centered 23 mm anterior and 18 mm to the left of centerline. The head holder was positioned on the midline. The search coil was constructed from Teflon-coated stainless steel wire and was implanted under the conjunctiva of one eye (Judge et al. 1980). All surgical procedures were approved by the Institutional Animal Care and Use Committee and were in compliance with the guidelines set forth in the National Institutes of Health (NIH) Guide for the Care and Use of Laboratory Animals.
Testing Procedure and the Ocular Go/Nogo Task
At the beginning of each recording session, the monkey was seated in a primate chair with his head fixed by a post. The eyes were 50 cm from the screen, and the line of sight was perpendicular to it. Eye position was first calibrated with a single dot of 0.5° angular extent that was shown 10° away from a central fixation point vertically or horizontally. An 85- to 100-mm tungsten electrode that usually had 1.0- to 2.0-MΩ impedance was then lowered into the chamber via a stainless steel tube to a predetermined site. The recording session typically lasted 2 h.
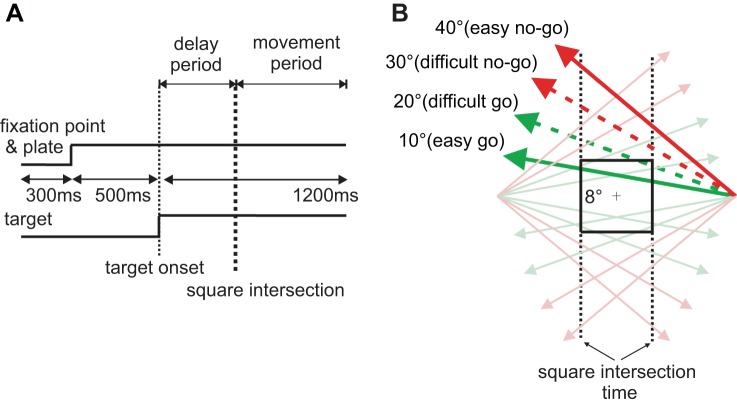
The two monkeys were first trained to perform successfully an easy version of the ocular go/nogo task as described in Kim et al. (2005). The same version was used to search for task-related neurons. Once a neuron was isolated, a modified version of the task was conducted where the difficulty of go/nogo decision was manipulated. Figure 1A shows the temporal schematic of the task. Each trial began with the appearance of a 0.5° white spot at the center of the screen surrounded by an 8-by-8° visible square. To trigger the appearance of a moving target, another 0.5° white spot, the monkey had to maintain his gaze within a 6.7-by-6.7° invisible electronic square window centered at the fixation point for 500 ms. At the end of the fixation period, the target appeared 13.3° to the left or right and moved toward the visible square at a constant velocity (20°/s) and angle relative to horizontal (easy: 10 and 40°; difficult: 20 and 30°) for 1,200 ms. The fixation point and the square remained visible throughout the trial. Figure 1B shows the possible trajectories in relation to the visible square and fixation point and the defined point of square intersection. Because of the difference in the trajectory angle, the timing of square intersection and the difficulty of making the go/nogo decision varied.
Fig. 1.
Experimental design. A: temporal schematic for the go/nogo ocular decision task. B: target trajectories in relation to the visible square. The locations where target trajectories intersect the vertical, dashed lines indicate square intersection time. Go trials (green lines) intersect the square, and nogo trials (red lines) miss the square.
In the delay period, defined as the time between target onset and square intersection, the monkey was required to maintain fixation regardless of whether the target eventually intersected the square. Targets moving at 10 and 20° angles intersected the square (go trials), and those moving at 30 and 40° angles did not (nogo trials). In go trials, the monkey had to initiate a pursuit movement to acquire the target within 300 ms of square intersection and maintain gaze within 6.7° of angular distance to the target until the end of the trial. In nogo trials, the monkey was required to maintain fixation within the visible square throughout the trial. Since the angle and direction of target movement was randomized from trial to trial, it was helpful for the monkey to evaluate whether it was a go or nogo condition in the delay period (before square intersection) so that he could make the decision within the narrow time window after square intersection. Liquid reward was given at the end of a trial only when the monkey successfully executed the task; the same amount of liquid was given for trials of different difficulties. The intertrial interval was 300 ms.
SEF neurons were located by lowering the electrode to a predetermined track in the SEF chamber while the monkey was performing the ocular go/nogo task (Kim et al. 2005). Once a neuron was isolated, online analysis of neural activity was conducted to determine whether the neuron responded differently in go and nogo trials. After a task-related neuron was identified, the modified version of the ocular go/nogo task was employed. FEF neurons were identified with the same procedure by lowering the electrode into the FEF chamber. To classify a neuron as located in the FEF, microstimulation <50 μA had to evoke saccades with >50% likelihood from the same track and with a similar site depth.
Data Analysis
Eye movement detection.
Vertical and horizontal eye position signals were digitized (1 kHz) and stored for offline analysis. Eye velocity was obtained by digital differentiation of eye position, and movement initiation time was detected using two criteria modified from a previous study (Badler and Heinen 2006): either the pursuit movement had a minimum velocity of 10°/s for at least 250 ms or it surpassed the saccade threshold of 40°/s for 80 ms and was followed by a pursuit movement. MATLAB and its Signal Processing and Statistics Toolboxes (MathWorks 2006) were used to conduct signal processing and data analysis.
Behavioral responses.
Only responses from successful go and nogo trials were included in the analyses. Go success trials had to satisfy two criteria: the animal had to maintain fixation within a 6.7° fixation window during the delay period, and the target had to be acquired and continuously pursued within the 6.7° window in the movement period. Nogo success trials were defined as continuous fixation within the 6.7° fixation window for the duration of the trial. The mean success rates for all recording sessions were 93 and 76% for easy and difficult go success trials and 96 and 91% for nogo success trials.
Task-related activity.
To characterize neural activity as a continuous function, the spike rate recorded in each trial was convolved with a 30-ms Gaussian. To determine whether and when a neuron signaled a rule state (go vs. nogo) in the task, the difference in spike rate for go and nogo trials was statistically tested (paired 2-tail t-test). A sliding 20-ms window moved at 5-ms steps, and the test was repeated for each step. Separation time was defined as the beginning of the 1st 20 consecutive, significantly different steps in the delay period, based on the Bonferroni familywise comparison (α ≤ 0.05). When a neuron displayed a higher spiking rate in go trials than in nogo trials, it was classified as a go neuron; when activity was higher in nogo trials, it was classified as a nogo neuron. Note that the Gaussian filter is noncausal, and there is debate about whether a causal filter is more appropriate for specifying the timing of neuronal activity. Previously, we performed an α-function analysis alongside the Gaussian analysis on separation times for SEF neurons recorded during ocular baseball with the same trajectories as in the current study (Yang et al. 2010). The difference between the α- and Gaussian-determined separation times was not significant (paired t-test, P = 0.55).
Directional- and rule-tuning indices.
To determine whether SEF and FEF activity reflected the direction of a target trajectory or pursuit movement, a directionality index (DI) was calculated for each neuron as below:
μpref was defined as the mean spike rate for the preferred direction and was derived from the pair of adjacent trajectories that specified the same rule and had the highest mean spike rate compared with the other seven pairs of trajectories; the mean spike rate for the two opposite trajectories was noted as μopp. The formula yields DI values that range between 0 and 1 with a value of 1 corresponding to maximum directional tuning. We consider a neuron to be directionally tuned if its DI value is significantly different from 0. Note that since the preferred and opposite trajectory pairs are within the same rule state, the DI computation controls for rule-related influence on the spike rate. DI values were calculated for the delay and movement periods, respectively, for each neuron.
To characterize the degree to which a neuron was involved in interpreting the rule, a rule index (RI) was also calculated as below:
Conceptually, RI compares the pair of adjacent trajectories with the highest activity in one rule state with the closest pair in the opposite rule state. RI should be maximal if a neuron is active for only one rule state, analogous to how DI is maximal if a neuron is active for one direction of motion. Specifically, μpref was unchanged from the DI calculation but was now compared with μrule.diff, the mean spike rate for the nearest pair of trajectories in the opposite rule state. The formula yields RI values that range between 0 and 1 with a value of 1 corresponding to maximum rule tuning. We consider a neuron to be rule-tuned if its RI value is significantly different from 0. Note that since the preferred and opposite-rule trajectory pairs are adjacent, the RI computation generally controls for directional tuning except for that which is extremely narrow. RI values were also calculated for the delay and movement periods, respectively, for each neuron.
CP.
To determine the extent to which the activity of a task-related SEF or FEF neuron predicted the ocular decision (go or nogo), we calculated the CP of its activity at different times. CP is adopted from the signal detection theory (Green and Swets 1966) and is used to specify the degree to which single neurons reflect decisions (Britten et al. 1996). For our experiment, CP is an estimate of the probability that an observer would correctly predict whether the monkey pursued or fixated on a given trial from the firing rate of the neuron. CP was derived here by first compiling a distribution of neuronal activity for each of the two choices that the animal made. A receiver operating characteristic (ROC) curve was then computed from the distributions, and the area under the curve was integrated to yield CP.
Note that CP is in theory best conducted on a trajectory with no signal, where two alternatives are equally likely. The resultant CP would be uncontaminated by the signal in this situation and can be linked purely to the decision. However, in our study, CP is calculated using the same trajectories in different structures and compared between the structures, which is reasonable since the same amount of visual signal contamination should be present in both CP numbers.
RESULTS
Task-Related SEF and FEF Neurons
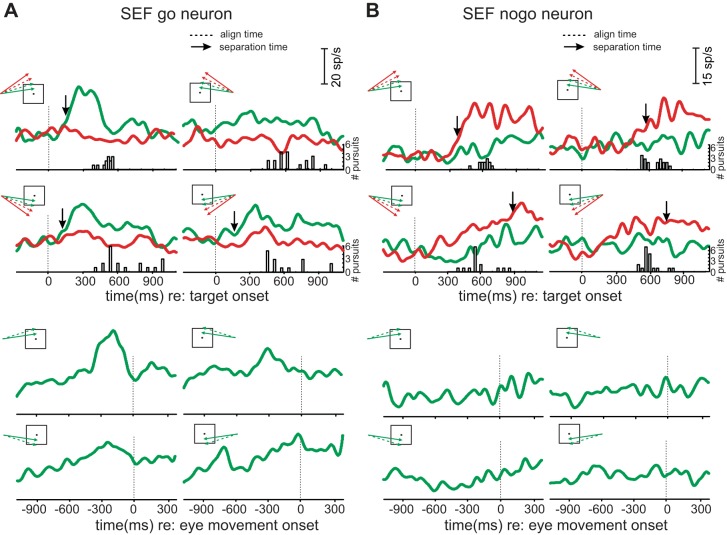
We recorded 31 go and 5 nogo SEF neurons as well as 29 go and 13 nogo FEF neurons from the 2 monkeys. Figure 2, A and B, shows activity of example SEF go and nogo neurons, respectively. As a first step in evaluating whether the activity of the neurons was more related to the moving target or the eye movement, neural activity in successful trials was aligned to either target motion onset (upper panels) or eye movement onset (lower panels). Subpanels show neural activity in go (green curves) and nogo (red curves) trials for each quadrant of trajectory motion.
Fig. 2.
Results from example supplementary eye field (SEF) go and nogo neurons. A: SEF go neuron. Traces are grouped by alignment time (top: aligned on target motion onset; bottom: aligned on movement onset). In each subpanel within an alignment, activity in go (green curves) and nogo (red curves) trials is plotted for the 4 trajectories shown in the inset, averaged over the 2 go and the 2 nogo trajectories, respectively. Vertical, dashed lines show alignment events. Vertical arrows show separation times for recorded activity. Traces without arrows did not separate before movement onset. The frequency distribution below the traces shows when eye movements were initiated during success trials. B: SEF nogo neuron. Note that activity in nogo trials is higher than on go trials for all directions. sp/s, Spikes per second; #, number of.
At top left, the activity of the SEF go neuron increased shortly after the target began to move in go trials but not in nogo trials. This occurred well before the time the target intersected the square (∼500 ms after target motion onset; data not shown). A frequency distribution of eye movement onset times is also shown below the cell activity. Most eye movements were initiated around the time of square intersection, indicating that the monkey attempted to predict when the target entered the zone. Note that activity for go trials in all four quadrants is higher than for nogo trials during the delay period regardless of the direction of target motion. In the lower panels, activity from the same neuron is shown aligned with eye movement onset. Here, it can be seen that the activity of the go neuron peaked before the movement began for all pursuit directions. Note that only results of go trials are shown, as these are the trials in which pursuit occurred.
Figure 2B shows results from an example SEF nogo neuron. At the top, activity for nogo trials was greater than for go trials early in the delay period for most quadrants. When aligned on eye movement onset (lower panels), no consistent change was observed in the pattern of neural activity. Note that 100-μA microstimulation of the sites where example SEF go and nogo neurons were recorded did not evoke pursuit or saccadic eye movements.
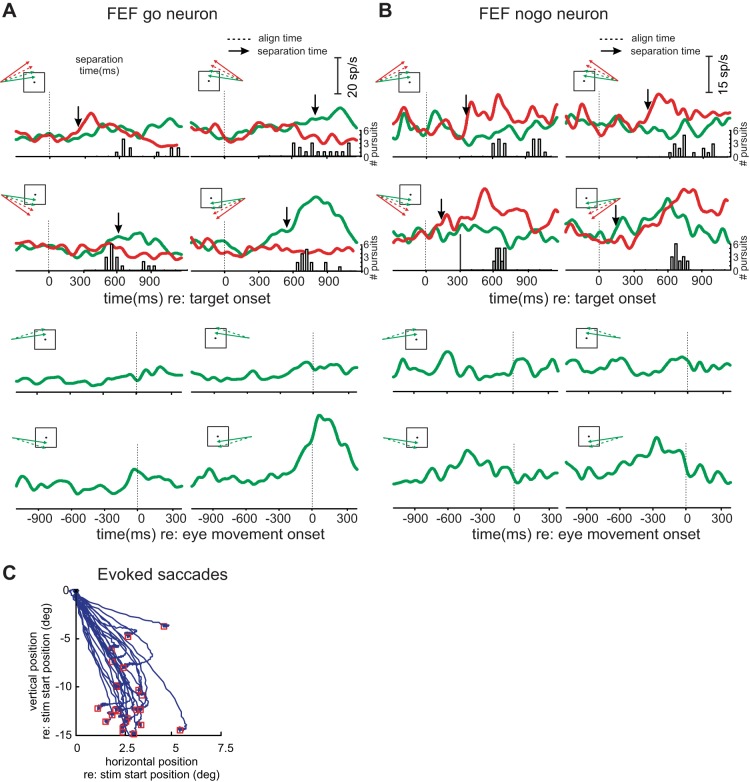
Figure 3A shows activity of an example FEF go neuron. The peak activity of this neuron in go trials occurs much later than that of the SEF neuron and is more prominent when aligned on movement onset (lower panels) than on target onset (upper panels). Furthermore, the cell is selective for the leftward/downward trajectories, displaying narrower tuning than that of the SEF neuron in Fig. 2. Microstimulation applied to the site evoked saccades with a direction consistent with the target trajectory that had the highest go activity (Fig. 3C). Figure 3B shows results from an example FEF nogo neuron. Activity was generally higher for nogo than go trajectories but without clear consistent tuning or timing of peak activity.
Fig. 3.
Results from example frontal eye field (FEF) go and nogo neurons. A: example FEF go neuron. Illustrated as in Fig. 2. In contrast with the SEF example neuron (Fig. 2), activity on go trials peaks slightly after movement onset and has relatively narrow tuning. B: example FEF nogo neuron. Higher activity during nogo than go trials is evident, but no consistent peak or directional selectivity is evident. C: evoked saccades from the site where the example go neuron was recorded. Saccades are plotted in Cartesian coordinates with 0,0 point corresponding to saccade origin and red squares depicting saccade endpoints. stim, Stimulation; deg, degrees.
To compare when the activity for SEF and FEF neurons provided information about the different trajectory angles, we determined the earliest time that the activity of each structure statistically differentiated between go and nogo trajectories in both easy (10 and 40° from horizontal; see Fig. 1) and difficult (20 and 30°) trials. We called this time the separation time (see methods for details on separation time derivation). Figure 4 shows cumulative percentiles of separation times in easy and difficult trials for all neurons in SEF and FEF. The median separation time (50th percentile) for SEF neurons occurred well before the square intersection time (easy: 262 ms after target onset; difficult: 405 ms). The median separation time for FEF neurons occurred later, close to square intersection time (easy: 406 ms; difficult: 591 ms). To compare neural activity with behavior, cumulative percentiles of pursuit latencies in easy and difficult go trials are also shown. Median pursuit latencies occur later than the separation times of both structures (easy: 627 ms; difficult: 825 ms).
Fig. 4.
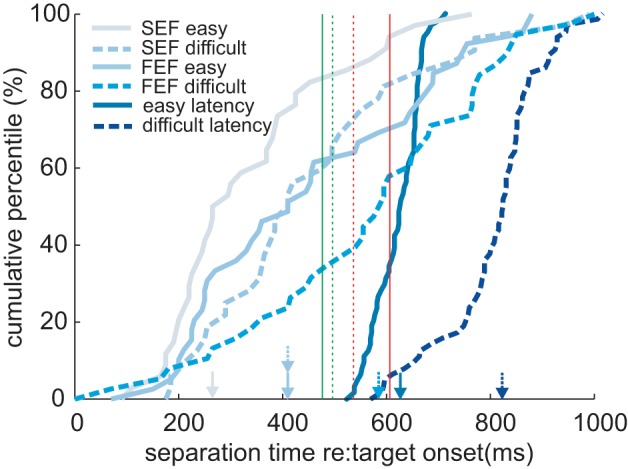
Cumulative distributions for the separation time between spike density curves in go and nogo trials as well as average pursuit latency for go trials. Results from easy (solid curves) and difficult (dashed curves) trials are plotted separately for all SEF and FEF go and nogo neurons. The arrows above the horizontal axis indicate the median separation time and pursuit latency (50% of neurons) for the corresponding curves. Vertical lines indicate square intersection times for easy (solid) and difficult (dashed) and go (green) and nogo (red) trials, respectively.
Therefore, SEF neurons appear to discriminate the rule state earlier than FEF neurons. We wished to gain more insight into whether neurons in these structures were involved in interpreting trajectories in the context of the rule or simply dealt with sensory or motor processing. To evaluate this, we determined how well their activity was tuned to a single direction (directional tuning) and to a specific rule state (go/nogo). A neuron was considered to have strong directional tuning if its activity for a preferred direction was significantly higher than activity for the opposite direction when both directions were in the same rule state. To quantify this, we computed a DI, defined as the normalized difference in neural activity between the pair of trajectories with the highest mean spike rate within a rule state, and the opposite pair (see methods). We considered a neuron to have strong rule tuning if the activity for the preferred direction within one rule state was higher than for the nearest direction in the opposite rule state. To quantify this, we computed an RI, the normalized difference in neural activity between the preferred pair of trajectories, and the nearest pair in the opposite rule state (see methods).
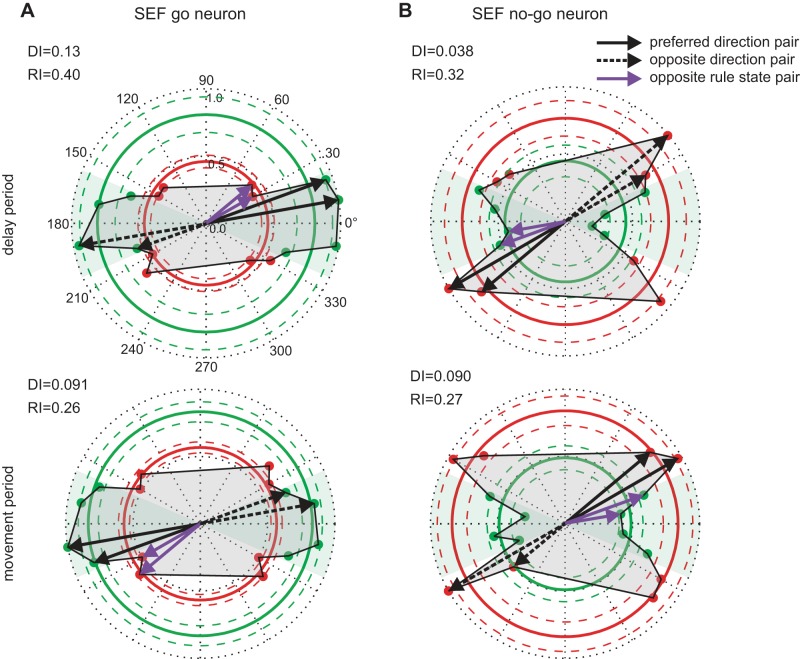
Figure 5A shows polar plots of the activity of an example SEF go neuron for each of the 16 target trajectories in the delay (top) and movement (bottom) periods. This was considered a go neuron because mean activity for the go trials (green circle) was higher than that for the nogo trials (red circle). The directional tuning of this neuron was weak in both periods, with similar mean activity for its preferred and opposite motion directions (computed from adjacent trajectory pairs; see methods). However, its rule tuning was strong, given the high activity for all trajectory direction within the go rule state and much lower activity for nogo trajectories. Therefore, this neuron had a much higher rule tuning index than directional tuning index in both the delay (RI = 0.40; DI = 0.13) and movement (RI = 0.26; DI = 0.09) periods.
Fig. 5.
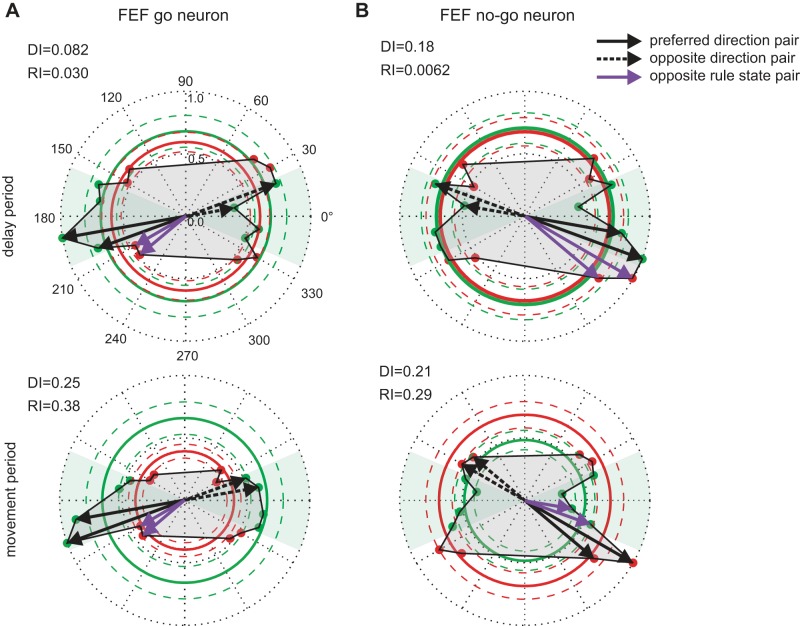
Directional and rule tuning of example SEF neurons in the delay and movement periods. A: results from an example SEF go neuron (top: delay period; bottom: movement period). The length of the radiating lines indicates the normalized mean spike rate for corresponding trajectories in relation to the 1 with the highest spike rate. The arrows indicate the direction of motion (rightward: 0°; leftward: 180°). The green shaded area encompasses the go rule state; gray shading demarcates the tuning function. Thick circles indicate the normalized mean spike rate (center: 0; border: 1) for all trajectories with the same decision criteria within a rule state (go rule state: green; nogo rule state: red), and the 2 corresponding thin circles represent the 95% confidence interval of spike rate. The preferred direction of the neuron was determined by the pair of trajectories with the highest mean spike rate with the additional criterion that both trajectories lie within the same rule state (solid black arrows). The activity for the pair of trajectories with the opposite direction (dotted black arrows) was compared with the preferred direction to calculate directionality index (DI). For rule index (RI), the preferred direction pair was compared with the adjacent pair of trajectories that lie in the other rule state (purple arrows). These were used to compute directional and rule indices (see methods) to reflect the degree of neural activity in encoding target direction and decision rule. B: results from an example SEF nogo neuron.
Figure 5B shows the mean activity of an SEF nogo neuron. Here, overall mean activity for nogo trajectories (red circle) was higher for nogo than for go trajectories (green circle). The directional tuning of this neuron was weak in both periods, as it had similar mean activity for its preferred and opposite motion directions in both the delay and movement periods, and activity for the go trajectories was much lower than for the nogo ones. Rule tuning was strong, given the elevated activity for most nogo directions and significantly lower activity for go trajectories. Rule tuning for this cell was much higher than directional tuning in both the delay (RI = 0.32; DI = 0.04) and movement (RI = 0.27; DI = 0.09) periods.
Figure 6A shows a polar plot of the mean activity for an example FEF go neuron. The activity was highest for targets moving leftward and downward and lowest for the opposite trajectories in both delay (top) and movement (bottom) periods. This neuron had moderately higher directional tuning than rule tuning in the delay period (RI = 0.03; DI = 0.08). Both indices increased in the movement period, and rule tuning surpassed directional tuning (RI = 0.38; DI = 0.25). Figure 6B shows the activity of an FEF nogo neuron, which displayed a hint of both directional and rule tuning during the delay period (RI = 0.01; DI = 0.18). The rule tuning significantly increased during the movement period, but the directional tuning did not (RI = 0.29; DI = 0.21).
Fig. 6.
Directional and rule tuning of example FEF neurons in the delay and movement periods. A: results from an example FEF go neuron. B: example FEF nogo neuron. Details as in Fig. 5.
We also evaluated how directional and rule tuning evolved in SEF and FEF neurons over the course of the trial. To this end, the DI and RI were computed for each neuron in 50-ms bins (see methods). Higher DI and RI reflect greater directional and rule tuning, respectively. Figure 7A shows that for SEF neurons, average DI (black) values were consistently low throughout the trial; however, average RI (red) values began to increase around 200 ms after target onset and asymptoted around the time of square intersection. In contrast, FEF neurons had consistently higher DI values than did SEF neurons, and RI values were initially low and continued to increase throughout the trial (Fig. 7B).
Fig. 7.
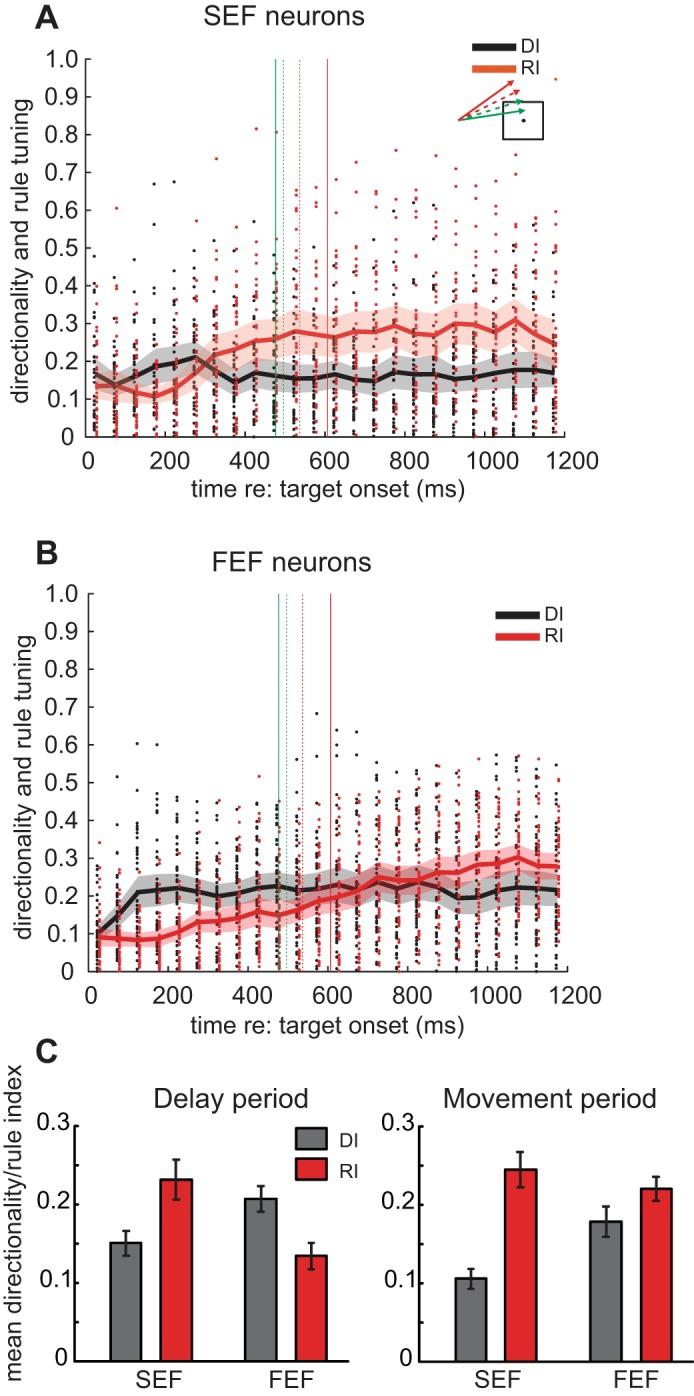
Mean values of DI and RI across the duration of the ocular go/nogo trial. A: results for all SEF neurons (go and nogo neurons pooled). Each dot indicates the index value based on 50-ms bins for a specific neuron (black: DI; red: RI). Curves indicate the mean DI and RI for all neurons. Shaded area represents the 95% confidence interval for the curves with corresponding color. Vertical lines indicate square intersection time for go/nogo trials. B: results for all FEF neurons. C: mean values of DI and RI for the delay and movement periods for SEF and FEF neurons. Error bars indicate 95% confidence intervals.
Figure 7C summarizes the population DI and RI of each structure for delay and movement periods. In the SEF, RI was higher than DI during the delay period [t(34) = −3.53, P < 0.05] and the movement period [t(34) = −6.46, P < 0.05]. In the FEF, DI was higher than RI during the delay period [t(41) = 4.36, P < 0.05], but although DI dropped and RI rose in the movement period, they were not significantly different at this time [t(41) = −1.81, P = 0.077]. Between structures, in the delay period, DI was lower [t(75) = −2.45, P < 0.05] and RI was higher [t(75) = 3.32, P < 0.05] in the SEF than in the FEF. In the movement period, DI was lower in the SEF than in the FEF [t(75) = −3.05, P < 0.05], but RI was not different between the structures [t(75) = 0.92, P = 0.36].
Figure 8 summarizes DI and RI values for all neurons. About half of the SEF neurons (17/36) were directionally tuned in the delay period, and fewer were in the movement period (9/36); most SEF neurons were tuned to the rule in both the delay (24/36) and movement (27/36) periods. In contrast, more FEF neurons were directionally tuned in both the delay (33/42) and movement (28/42) periods, and fewer FEF neurons displayed rule-tuning activity in the delay period (24/42) than in the movement period (38/42).
Fig. 8.
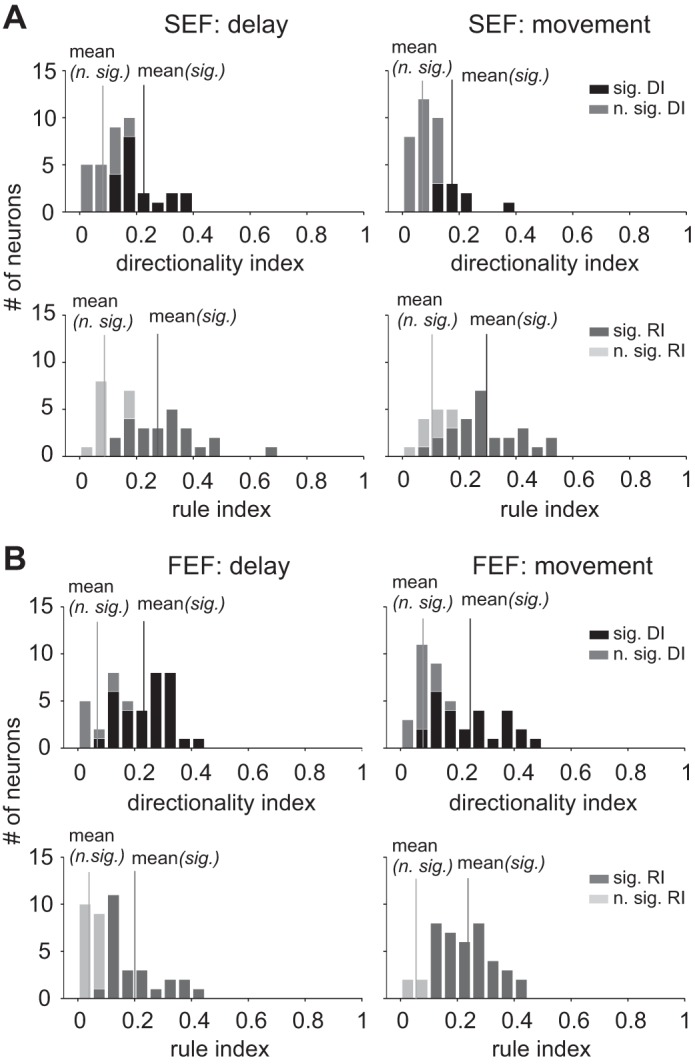
Histograms of DI and RI for all SEF and FEF neurons in the delay and movement periods of the ocular go/nogo trial. A: DI (upper panels) and RI (lower panels) values for SEF neurons in the delay (left panels) and movement (right panels) periods. Here, easy and difficulty trials were combined to calculate DI and RI. Dark bars indicate significant DI and RI (different from 0) and light bars insignificant (n. sig.). The vertical lines indicate the mean DI and RI values for all significant and nonsignificant neurons. B: results for FEF neurons.
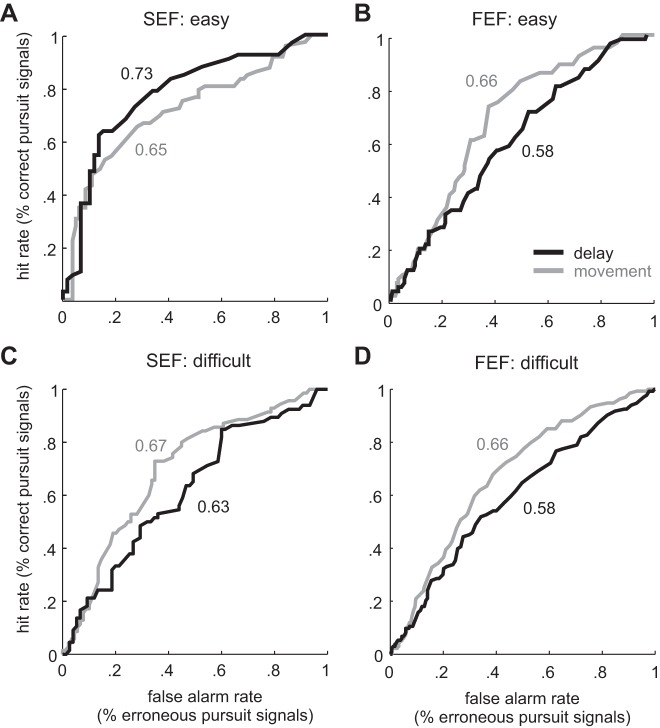
To assess the extent to which the activity of task-related SEF and FEF neurons predicted the ocular decision (fixation or pursuit), we computed the CP of individual neurons, as has been done previously for neurons implicated in perceptual decision making (Purushothaman and Bradley 2005; Heinen et al. 2012; see methods). A neuron with a CP value of 1.0 perfectly predicts the animal's behavior (go vs. nogo). Figure 9, A and B, shows the ROC curves used to compute CP for easy trials for representative SEF and FEF neurons, respectively. Briefly, each curve was derived by plotting the proportion of instances in which the neuron correctly signaled that the monkey would pursue against the proportion of instances in which the neuron incorrectly signaled that the monkey would fixate for each firing rate. The area under each curve yields the CP. For the SEF neuron in easy trials, CP was higher in the delay period than in the movement period (0.73 vs. 0.65, respectively). In difficult trials, the reverse occurred: CP was slightly higher in the movement period than in the delay period (0.67 vs. 0.63, respectively). For the FEF neuron, CP during both easy and difficult trials was higher in the movement period than in the delay period (0.66 vs. 0.58, respectively).
Fig. 9.
Receiver operating characteristic (ROC) curves for example SEF and FEF neurons based on their mean spike rate in relation to the ocular decision. A: ROC curves for an SEF neuron in easy trials. The x-axis represents the rate of false alarm (target pursuit in nogo trials) and the y-axis the rate of correct hit (target pursuit in go trials). The dark curve indicates the ROC for neural activity in the delay period and the light curve the movement period. Numbers shown in the figure indicate the area before the curve (e.g., choice probability) for this neuron for the delay and movement periods, respectively. B: ROC curves for an FEF neuron in easy trials. C: ROC curves for the same SEF neuron in difficult trials. D: ROC curves for the same FEF neuron in difficult trials.
Figure 10A plots the individual and mean CP values as a function of time in a trial for all SEF and FEF neurons, binned in 50-ms intervals. Here, easy and difficult trials were combined. Notice that CP values for SEF neurons rose during the delay period, reaching a peak just before square intersection. The CP of FEF neurons, on the other hand, continued to increase until late in the trial. Figure 10B summarizes this result. During the delay period, CP is higher in the SEF than the FEF [t(75) = 4.55, P < 0.05], but during the movement period CP is the same in both structures [t(75) = 0.1209, P < = 0.90]. These results suggest that the FEF becomes more involved in the ocular decision during the course of the trial, possibly because the SEF signals to it about the go/nogo state of the trajectory.
Fig. 10.
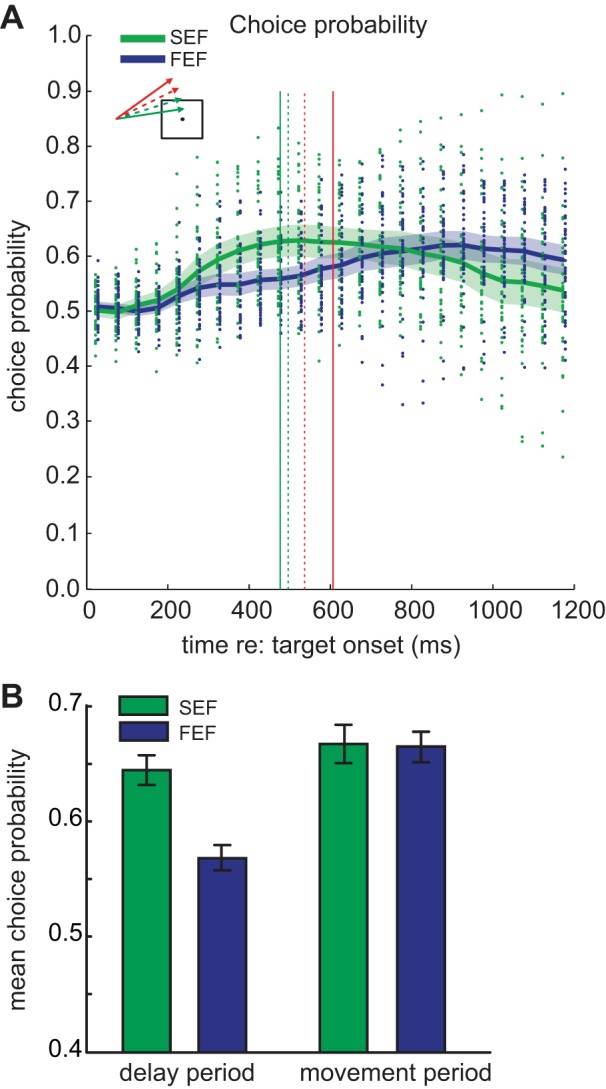
Choice probability for SEF (green) and FEF (blue) neurons across the duration of the ocular go/nogo trial. A: choice probability for all SEF and FEF neurons at different times in ocular go/nogo trials. Each dot represents the choice probability value of an individual neuron for combined easy and difficult trials. The curves represent the mean choice probability over time-based 50-ms intervals and the corresponding shaded area the 95% confidence interval. Vertical lines indicate square intersection time for go/nogo trials. B: mean choice probability in the delay and movement periods. Error bars indicate 95% confidence intervals.
DISCUSSION
The results of the current study demonstrate that SEF activity began to reflect the rule early in the delay period (Fig. 4), when the trajectory of a moving target was being interpreted in relation to a visible square, and continued to predict the rule better than target motion in both delay and movement periods (Fig. 8). Increasing task difficulty delayed the time at which SEF neurons discriminated between go and nogo rule states (Fig. 4) and reduced their accuracy in predicting the ocular decision according to calculated CP values (Fig. 9). In contrast, FEF neurons began to reflect the rule at a later time, closer to when the behavioral decision was made, and in the delay period their activity predicted the direction of target motion better than it predicted the rule state of the trajectory. FEF neurons reflected the rule later in difficult trials than in easy trials, but their ability to predict the decision was not affected by task difficulty, as demonstrated by no difference between CP values in easy and difficult trials. Together, these findings suggest that SEF and FEF neurons are differentially involved in our ocular decision task, with SEF neurons more involved in interpreting the rule and FEF neurons in executing the ocular decision. These results are consistent with findings of more direct FEF involvement in memory-based delayed pursuit and in saccade initiation in countermanding tasks (Brown et al. 2008; Fukushima et al. 2011; Hanes et al. 1998; Stuphorn et al. 2010).
The different roles of the SEF and FEF in ocular decision making are consistent with a hypothesis of how information is transformed between these structures, proposed previously by Schall et al. (1993). In this scheme, SEF neurons encode goal-centric coordinates, whereas FEF neurons encode body-centric ones. This idea is supported by previous findings that SEF stimulation at some sites evokes goal-centric saccades, whereas FEF stimulation mostly evokes fixed-vector saccades (Huerta et al. 1987; Park et al. 2006; Robinson 1972; Russo and Bruce 1993, 1996). The goal-centric nature of the SEF is consistent with the nondirectional rule tuning we find there. This type of rule tuning would render the SEF inadequate in signaling the direction in which a pursuit movement should be generated. For the FEF to be involved in enforcing the ocular decision, the nondirectionally tuned, rule-based signal in the SEF would likely need to be transformed into a directionally tuned signal in the FEF.
The nonspatial, flexible interpretation of decision rules by SEF neurons has been demonstrated in earlier research. Chen and Wise (1996), for example, showed that SEF neurons signaled one of several likely saccade target locations based on a nonspatial cue (e.g., a color cue that specified the location of a target among distractors), even when the cue appeared at a location inconsistent with the color-indicated target location. In addition, Tremblay et al. (2002) found that SEF activity was not tuned to the absolute location of a selected target; rather, it signaled the position of that target relative to a distractor. These findings, and our results, suggest a general role of the SEF in signaling the desired target specified by a decision rule, independent of the spatial location of that target (White and Wise 1999). To implement the required movement, the location and/or motion direction of the selected target must be transformed into fixed-vector coordinates in a region such as the FEF.
In our study, although rule encoding in the FEF is low during the delay period, it increases at square intersection and beyond. This may seem inconsistent with our proposed roles of the SEF and FEF in ocular decision making. However, encoding of decision rules by FEF neurons has been observed previously. Ferrera and colleagues reported that FEF activity predicted the perceptual categories of moving stimuli rather than the motor (saccadic) responses because the neurons had low directional tuning during their task (Ferrera and Barborica 2010; Ferrera et al. 2009). Note that their task did not have a delay period and early directional activity may have occurred but could have been obscured because it was confounded with rule-encoding activity. This explanation is consistent with early FEF activity being dominated by directional information and later FEF activity reflecting rule information relayed there from the SEF. In our study as well as in those of Ferrera and colleagues (Ferrera and Barborica 2010; Ferrera et al. 2009), FEF activity likely reflects the nonspatial, perceptual category encoding propagated downstream from the SEF. Because of the very different types of categorization in our study and theirs, for this transformation to occur, the association between nonspatial encoding in the SEF and the activation of FEF neurons for specific motor responses would have to be learned.
Because of the way go and nogo trajectories were specified, rule- and direction-tuned activity may have been confounded. If rule tuning were computed simply by comparing mean neural activity for go trajectories with mean nogo activity, a neuron could be considered to have high rule tuning merely by being strongly tuned to a single trajectory direction. To address this, we developed the RI as a complement to standard DI computation since a directionally tuned neuron would not be expected to show low activity for a trajectory adjacent to its preferred trajectory. However, the RI value might still reflect the motion trajectory rather than the rule state if a neuron has very fine directional tuning. In this case, even trajectories adjacent to the preferred trajectory might generate less activity and appear to signal a different rule. If high RI were merely due to fine directional tuning, a neuron that has a high RI would also have a high DI since by definition directionally tuned neurons have high activity for the preferred trajectory and low activity for the opposite trajectory. However, we found a negative correlation between RI and DI (r2 = −0.1618, F = 8.1094, P = 0.007), meaning that neurons with high RI values showed low DI values. A low DI means that activity is high for both the preferred and opposite trajectory, which is inconsistent with any kind of directional tuning. Therefore, a negative correlation between RI and DI indicates that neurons with high rule tuning are not directionally tuned.
Nevertheless, we acknowledge the possible influence of directional tuning on the selection of rule-related neurons and on calculating RI. Since we qualified rule-related neurons as displaying differential activity in go and nogo trials, directional tuning may have led to an initial overestimate of rule-related neurons. Furthermore, despite an overall negative correlation between RI and DI, some individual neurons might still show high RI because of fine directional tuning.
In summary, the current results suggest that the SEF and FEF encode both perceptual categories and ocular decisions, but their specific involvement in these functions is not fixed. Rather, it is dynamic, evolving over time. Specifically, SEF activity reflects the perceptual category shortly after visual information is available, but the activity is not spatially specific and does not predict the decision response (Heinen et al. 2012). FEF activity, on the other hand, is more spatially specific and does not reflect the perceptual category or motor choice until an ocular decision must be made. The delayed category encoding in the FEF is likely a reflection of a learned association between a perceptual category and an ocular response and the reciprocal connections between the SEF and FEF.
GRANTS
The study described here was supported by NIH Grant EY-117720 to S. Heinen and by R. C. Atkinson Fellowship at the Smith-Kettlewell Eye Research Institute to S.-n. Yang.
DISCLOSURES
No conflicts of interest, financial or otherwise, are declared by the author(s).
AUTHOR CONTRIBUTIONS
S.-n.Y. and S.H. conception and design of research; S.-n.Y. performed experiments; S.-n.Y. analyzed data; S.-n.Y. and S.H. interpreted results of experiments; S.-n.Y. and S.H. prepared figures; S.-n.Y. and S.H. drafted manuscript; S.-n.Y. and S.H. edited and revised manuscript; S.-n.Y. and S.H. approved final version of manuscript.
REFERENCES
- Amador N, Schlag-Rey M, Schlag J. Primate antisaccade. II. Supplementary eye field neuronal activity predicts correct performance. J Neurophysiol 91: 1672–1689, 2004 [DOI] [PubMed] [Google Scholar]
- Andersen RB, Brotchie P, Mazzoni P. Evidence for the lateral intrapa-rietal area as the parietal eye field. Curr Opin Neurobiol 2: 840–846, 1992 [DOI] [PubMed] [Google Scholar]
- Badler JB, Heinen SJ. Anticipatory movement timing using prediction and external cues. J Neurosci 26: 4519–4525, 2006 [DOI] [PMC free article] [PubMed] [Google Scholar]
- Barbas H, Pandya D. Patterns of connections of the prefrontal cortex in the rhesus monkey associated with cortical architecture. In: Frontal Lobe Function and Dysfunction, edited by Levin HS, Eisenberg HM, Benton AL. New York: Oxford Univ. Press, 1991, p. 35–58 [Google Scholar]
- Barbas H, Pandya DN. Architecture and intrinsic connections of the prefrontal cortex in the rhesus monkey. J Comp Neurol 286: 353–375, 1989 [DOI] [PubMed] [Google Scholar]
- Britten KH, Newsome WT, Shadlen MN, Celebrini S, Movshon JA. A relationship between behavioral choice and the visual responses of neurons in macaque MT. Vis Neurosci 13: 87–100, 1996 [DOI] [PubMed] [Google Scholar]
- Brown JW, Hanes DP, Schall JD, Stuphorn V. Relation of frontal eye field activity to saccade initiation during a countermanding task. Exp Brain Res 190: 135–151, 2008 [DOI] [PMC free article] [PubMed] [Google Scholar]
- Chen LL, Wise SP. Evolution of directional preferences in the supplementary eye field during acquisition of conditional oculomotor associations. J Neurosci 16: 3067–3081, 1996 [DOI] [PMC free article] [PubMed] [Google Scholar]
- Colby CL, Duhamel JR, Goldberg ME. Visual, presaccadic, and cognitive activation of single neurons in monkey lateral intraparietal area. J Neurophysiol 76: 2841–2852, 1996 [DOI] [PubMed] [Google Scholar]
- Ferrera VP, Barborica A. Internally generated error signals in monkey frontal eye field during an inferred motion task. J Neurosci 30: 11612–11623, 2010 [DOI] [PMC free article] [PubMed] [Google Scholar]
- Ferrera VP, Yanike M, Cassanello C. Frontal eye field neurons signal changes in decision criteria. Nat Neurosci 12: 1458–1462, 2009 [DOI] [PMC free article] [PubMed] [Google Scholar]
- Freedman DJ, Assad JA. Experience-dependent representation of visual categories in parietal cortex. Nature 443: 85–88, 2006 [DOI] [PubMed] [Google Scholar]
- Fukushima J, Akao T, Shichinohe N, Kurkin S, Kaneko CR, Fukushima K. Neuronal activity in the caudal frontal eye fields of monkeys during memory-based smooth pursuit eye movements: comparison with the supplementary eye fields. Cereb Cortex 21: 1910–1924, 2011 [DOI] [PMC free article] [PubMed] [Google Scholar]
- Green DM, Swets JA. Signal Detection Theory and Psychophysics. New York: John Wiley and Sons, 1966 [Google Scholar]
- Hanes DP, Patterson WF, Schall JD. Role of frontal eye fields in countermanding saccades: visual, movement, and fixation activity. J Neurophysiol 79: 817–834, 1998 [DOI] [PubMed] [Google Scholar]
- Heinen SJ, Hwang H, Yang SN. Flexible interpretation of a decision rule by supplementary eye field neurons. J Neurophysiol 106: 2992–3000, 2012 [DOI] [PMC free article] [PubMed] [Google Scholar]
- Heinen SJ, Rowland J, Lee BT, Wade AR. An oculomotor decision process revealed by functional magnetic resonance imaging. J Neurosci 26: 13515–13522, 2006 [DOI] [PMC free article] [PubMed] [Google Scholar]
- Huerta MF, Krubitzer LA, Kaas JH. Frontal eye field as defined by intracortical microstimulation in squirrel monkeys, owl monkeys, and macaque monkeys. II. Cortical connections. J Comp Neurol 265: 332–361, 1987 [DOI] [PubMed] [Google Scholar]
- Judge SJ, Richmond BJ, Chu FC. Implantation of magnetic search coils for measurement of eye position: an improved method. Vision Res 20: 535–538, 1980 [DOI] [PubMed] [Google Scholar]
- Kim YG, Badler JB, Heinen SF. Trajectory interpretation by supplementary eye field neurons during ocular baseball. J Neurophysiol 94: 1385–1391, 2005 [DOI] [PubMed] [Google Scholar]
- Law CT, Gold J. Neural correlates of perceptual learning in a sensory-motor, but not a sensory, cortical area. Nat Neurosci 11: 505–513, 2008 [DOI] [PMC free article] [PubMed] [Google Scholar]
- Luppino G, Rozzi S, Calzavara R, Matelli M. Prefrontal and agranular cingulate projections to the dorsal premotor areas F2 and F7 in the macaque monkey. Eur J Neurosci 17: 559–578, 2003 [DOI] [PubMed] [Google Scholar]
- Miller EK. The prefrontal cortex: complex neural properties for complex behavior. Neuron 22: 15–17, 1999 [DOI] [PubMed] [Google Scholar]
- Muhammad R, Wallis JD, Miller EK. A comparison of abstract rules in the prefrontal cortex, premotor cortex, inferior temporal cortex, and striatum. J Cogn Neurosci 18: 974–989, 2006 [DOI] [PubMed] [Google Scholar]
- Newsome WT, Britten KH, Movshon JA. Neuronal correlates of a perceptual decision. Nature 341: 52–54, 1989 [DOI] [PubMed] [Google Scholar]
- Pandya DN, Yeterian EH. Prefrontal cortex in relation to other cortical areas in rhesus monkey: architecture and connections. Prog Brain Res 85: 63–94, 1990 [DOI] [PubMed] [Google Scholar]
- Park J, Schalg-Rey M, Schlag J. Frames of reference for saccadic command tested by saccade collision in the supplementary eye field. J Neurophysiol 95: 159–170, 2006 [DOI] [PubMed] [Google Scholar]
- Passingham RE. Cortical mechanisms and cues for action. Philos Trans R Soc Lond B Biol Sci 308: 101–111, 1985 [DOI] [PubMed] [Google Scholar]
- Passingham RE. The Frontal Lobes and Voluntary Action. Oxford Psychology Series, no.21. Oxford, UK: Oxford Univ. Press, 1993 [Google Scholar]
- Purushothaman G, Bradley DC. Neural population code for fine perceptual decisions in area MT. Nat Neurosci 8: 99–106, 2005 [DOI] [PubMed] [Google Scholar]
- Robinson DA. Eye movements evoked by collicular stimulation in the alert monkey. Vision Res 12: 1795–1808, 1972 [DOI] [PubMed] [Google Scholar]
- Russo GS, Bruce CJ. Effect of eye position within the orbit on electrically elicited saccadic eye movements: a comparison of the macaque monkey's frontal and supplementary eye fields. J Neurophysiol 69: 800–818, 1993 [DOI] [PubMed] [Google Scholar]
- Russo GS, Bruce CJ. Neurons in the supplementary eye field of rhesus monkeys code visual targets and saccadic eye movements in an oculocentric coordinate system. J Neurophysiol 76: 825–848, 1996 [DOI] [PubMed] [Google Scholar]
- Schall JD, Morel A, Kaas JH. Topography of supplementary eye field afferents to frontal eye field in macaque: implications for mapping between saccade coordinate systems. Vis Neurosci 10: 385–393, 1993 [DOI] [PubMed] [Google Scholar]
- Schlag-Rey M, Amador N, Sanchez H, Schlag J. Antisaccade performance predicted by neuronal activity in the supplementary eye field. Nature 390: 398–401, 1997 [DOI] [PubMed] [Google Scholar]
- Shadlen MN, Newsome WT. Neural basis of a perceptual decision in the parietal cortex (area LIP) of the rhesus monkey. J Neurophysiol 86: 1916–1936, 2001 [DOI] [PubMed] [Google Scholar]
- Shichinohe N, Akao T, Kurkin S, Fukushima J, Kaneko CR, Fukushima K. Memory and decision making in the frontal cortex during visual motion processing for smooth pursuit eye movements. Neuron 62: 717–732, 2009 [DOI] [PMC free article] [PubMed] [Google Scholar]
- Snyder LH, Batista AP, Andersen RA. Saccade-related activity in the parietal reach region. J Neurophysiol 83: 1099–1102, 2000 [DOI] [PubMed] [Google Scholar]
- Stuphorn V, Brown JW, Schall JD. Role of supplementary eye field in saccade initiation: executive, not direct, control. J Neurophysiol 103: 801–816, 2010 [DOI] [PMC free article] [PubMed] [Google Scholar]
- Stuphorn V, Schall JD. Executive control of countermanding saccades by the supplementary eye field. Nat Neurosci 9: 925–931, 2006 [DOI] [PubMed] [Google Scholar]
- Stuphorn V, Taylor TL, Schall JD. Performance monitoring by the supplementary eye field. Nature 408: 857–860, 2000 [DOI] [PubMed] [Google Scholar]
- Tremblay L, Gettner SN, Olson CR. Neurons with object-centered spatial selectivity in macaque SEF: do they represent locations or rules? J Neurophysiol 87: 333–350, 2002 [DOI] [PubMed] [Google Scholar]
- Wallis JD, Miller EK. From rule to response: neuronal processes in the premotor and prefrontal cortex. J Neurophysiol 90: 1790–1806, 2003 [DOI] [PubMed] [Google Scholar]
- White IM, Wise SP. Rule-dependent neuronal activity in the prefrontal cortex. Exp Brain Res 126: 315–335, 1999 [DOI] [PubMed] [Google Scholar]
- Yang S, Hwang H, Ford JS, Heinen SJ. Supplementary eye field activity reflects a decision rule governing smooth pursuit but not the decision. J Neurophysiol 103: 2458–2469, 2010 [DOI] [PMC free article] [PubMed] [Google Scholar]


