

Abstract
For aquatic systems, especially freshwaters, there is little data on the long-term (i.e., >6-month period) and depth-related variability of viruses. In this study, we examined virus-induced mortality of heterotrophic bacteria over a 10-month period and throughout the water column in two lakes of the French Massif Central, the oligomesotrophic Lake Pavin and the eutrophic Lake Aydat. Concurrently, we estimated nonviral mortality through heterotrophic nanoflagellate and ciliate bacterivory. Overall, viral infection parameters were much less variable than bacterial production. We found that the frequency of visibly infected cells (FVIC), estimated using transmission electron microscopy, peaked in both lakes at the end of spring (May to June) and in early autumn (September to October). FVIC values were significantly higher in Lake Pavin (mean [M] = 1.6%) than in Lake Aydat (M = 1.1%), whereas the opposite trend was observed for burst sizes, which averaged 25.7 and 30.2 virus particles bacterium−1, respectively. We detected no significant depth-related differences in FVIC or burst size. We found that in both lakes the removal of bacterial production by flagellate grazing (MPavin = 37.7%, MAydat = 18.5%) was nearly always more than the production removed by viral lysis (MPavin = 16.2%, MAydat = 19%) or ciliate grazing (MPavin = 2.7%, MAydat = 8.8%). However, at specific times and locations, viral lysis prevailed over protistan grazing, for example, in the anoxic hypolimnion of Lake Aydat. In addition, viral mortality represented a relatively constant mortality source in a bacterial community showing large variations in growth rate and subject to large variations in loss rates from grazers. Finally, although viruses did not represent the main agent of bacterial mortality, our data seem to show that their relative importance was higher in the less productive system.
Over the last 15 years, our view of aquatic microbial food webs has changed with the discovery of the abundances and activities of viruses. Until the late 1980s, the fate of bacteria was thought to be largely that of prey for protists (cf. reference 47) and bacterial activities regulated solely by resource availability (7). However, this simple view of the microbial loop (1) began to be revised following initial reports that viruses were abundant, typically in numbers 10-fold greater than those of bacteria, in both marine and freshwaters (3, 38). This finding led to the hypothesis that a significant fraction of the bacterioplankton stock is lysed through viral attack. In reality, in most natural systems, viruses and their presumed hosts—bacteria—are abundant enough to suggest that bacterium-virus interactions could be a significant source of bacterial mortality (17, 56). Thus, many attempts have been made to estimate virus-mediated mortality in various aquatic systems by using many different methods: direct observation of infected cells by using transmission electron microscopy (TEM) (38), analysis of viral decay rates by using the cellular poison potassium cyanide (21), radiotracer incorporation into virioplankton biomass (45), utilization of fluorescently labeled viruses as tracers (34), and the dilution method (66).
Existing estimates of virus-induced rates of bacterial mortality are largely derived from studies conducted in marine waters over short time periods and range quite widely. However, most studies report values of virus-induced bacterial mortality (VIBM) of <20% (5, 6, 9, 12, 22, 26, 29, 42, 49); a few studies have provided estimates of about 50% (16, 17, 53) or of nearly 100% (34) of bacterial production in some fresh and marine waters.
Although data are limited, viral activity appears to vary with several factors: (i) water depth and oxygen concentration (58), (ii) trophic state of the system (57), (iii) temperature (29), (iv) light, especially UV light level (64, 67), (v) suspended particulate matter (23), and (vi) bactivorous activity of protists (42). Results from a few investigations, conducted over short periods, have shown substantial shifts in abundances and activities but few consistent temporal patterns or relationships with bacteria or other microbes (5, 6, 19, 20, 56). This therefore suggests that a complex interplay of several factors is most likely to control the abundance and activity of viruses over short timescales.
There are many gaps in our knowledge of viral activities in natural aquatic communities. For example, seasonal variability in VIBM has received even less attention than short-term variability. To our knowledge, a restricted number of studies have been conducted over long-term periods (16, 22, 54). Data are limited to a study conducted between April and July in Lake Constance (22) and another between December and July in an oxbow lake of the River Danube (16). No clear seasonal trends were detected in these studies. In addition, little is known about the depth-related variability of viral lytic activity. Contradictory trends have been reported, that is, trends showing activity that is constant throughout the water column (54) or increasing with depth (58, 61). Also, the apparent positive relation between viral lytic activity and trophic state in aquatic systems is a relationship based more upon extrapolation than direct measurements (16, 46, 55, 62). Thus, there is an insufficient amount of data, especially with regard to freshwater systems, on seasonal and depth-related variability of virus-mediated bacterial mortality as well as relationships related to the trophic state of a system.
The principal objective of the work reported here was to examine, in two lakes of different trophic status, temporal variability over a long-term scale and depth-related variability. To accomplish this, we measured bacterial production and estimated the impact of viral lysis on bacterial production in the oligomesotrophic Lake Pavin and the eutrophic Lake Aydat and compared it to the bactivorous activity of phagotrophic protists (i.e., heterotrophic flagellates and ciliates). The two lakes are geographically close (∼30 km) and were therefore similar in terms of water temperature and impact of solar radiation. Sampling in each lake was conducted monthly, using triplicates, between March and December of 2000.
MATERIALS AND METHODS
Study site and sample collection.
Samples were collected from two lakes differing in trophic status. Lake Pavin (altitude, 1,197 m) is a meromictic and dimictic oligomesotrophic lake that experiences partial overturn. It is a typical crater mountain lake characterized by a maximum depth of 92 m and low surface (44 ha) and catchment (50 ha) areas. The watershed essentially consists of beech forests. The low catchment area-to-lake area ratio and the absence of agricultural activities in the vicinity of the lake prevent eutrophication. Lake Aydat is a small (surface area, 60.3 ha; maximum depth, 15.5 m) eutrophic, dimictic lake located at 825 m altitude. It was formed by a volcanic coulee flowing into a valley and damming the flow of a river (the River Veyre). Compared to the surface area, the catchment area (3 × 10⁴ ha) is very large and contains intensive agricultural lands. The lake also receives domestic waste waters. The two lakes are located in the Volcanic Natural Park of Auvergne (Massif Central, France) and are separated by a distance of about 30 km.
The difference in trophic status between each lake ecosystem is displayed by an Aydat/Pavin chlorophyll a ratio of 7, with typical annual mean values of 3 and 21 mg of chlorophyll a m−3 in Pavin and Aydat, respectively (6, 40). The typical annual means for the nutrient contents are at 57 and 71 μM for total nitrogen and at 0.5 and 3 μM for total phosphorus in the oligomesotrophic Lake Pavin and the eutrophic Lake Aydat, respectively (40). The trophic status of each lake was determined based on the above pigment and nutrient concentrations, following recommendations from the Organization for Economic Cooperation and Development (35).
For each lake, samples were collected monthly (systematically between 0900 and 1000 h) from March to December of 2000 from a central location in the lake by using a 10-liter Van Dorn bottle. In each of the lakes, triplicate samples were collected during the period of thermal stratification at three depths corresponding to the epilimnion, metalimnion, and hypolimnion: 5, 10, and 35 m in Lake Pavin and 1, 5, and 12 m in Lake Aydat. Oxygen and temperature profiles were determined in situ by using an OXYCAL-SL (197) probe, and values were interpolated through the water column by using SURFER 5.00 (Golden Software, Inc.)
Bacterial production.
Heterotrophic bacterial production was estimated from the rate of [3H]thymidine incorporation (63). For each sample, three replicates and a formaldehyde (2% final concentration)-killed control were incubated in Pyrex glass bottles containing 20 nM [3H]thymidine (specific activity, 82.0 Ci · mmol−1; Amersham) and held at in situ temperature. Incubations were stopped after 45 min by the addition of formaldehyde to a 2% final concentration. Samples were then filtered onto cellulose nitrate filters (pore size, 0.22 μm; type GSWP; Millipore) and extracted with 10% ice-cold trichloroacetic acid for 10 min, followed by five 3-ml rinses with 5% trichloroacetic acid. Filters were placed in scintillation vials, allowed to dry, and solubilized with 1 ml of ethyl acetate. Five milliliters of a scintillation cocktail was added to each vial, and radioactivity was determined using an LKB liquid scintillation counter. The quantity of [3H]thymidine incorporated into DNA was converted into bacterial production by using a unique conversion factor of 2 × 10¹⁸ cells produced per mole of thymidine incorporated. This conversion factor represents a mean value determined from 97 studies conducted in various aquatic systems (2).
Phage-infected bacteria, burst size, and viral production.
Bacteria contained in triplicate 8-ml aliquots of formalin-fixed samples were harvested by ultracentrifugation onto 400-mesh electron microscope grids with carbon-coated Formvar film, by using a Centrikon TST 41.14 Swing-Out-Rotor run at 70,000 × g for 20 min at 4°C (44). Each grid was then stained for 30 s with uranyl acetate (2%, wt/wt) and examined at ×40,000 by using a JEOL 1200EX TEM to distinguish between virus-infected and uninfected bacteria. A bacterium was considered infected when at least five phages, identified by shape and size, were clearly visible inside the host cell. At least 600 bacterial cells were inspected per grid, with the number of infected bacteria encountered ranging from 20 to 25 per sample. To estimate VIBM, the frequency of infected cells (FIC) was calculated from the frequency of visibly infected cells (FVIC) (as a percent) using the formula FIC = 9.524 FVIC − 3.256 (60). FIC was then converted to VIBM according to the method of Binder (8): VIBM = (FIC + 0.6 FIC2)/(1 − 1.2 FIC).
Protozoan bacterivory.
Grazing activity of phagotrophic protists (i.e., heterotrophic flagellates and ciliates) was measured using tracer particles and epifluorescence microscopy (EM) (10, 36). A stock solution of tracer particles was prepared from a concentrated suspension of 0.5-μm-diameter fluoresbrite plain microspheres (Polysciences) and treated with bovine serum albumin (0.5 mg/ml) to prevent clumping of the particles. Bead concentration was determined by filtering a few microliters of stock solution onto 0.2-μm-pore-size filters and then counting the beads present with EM. For in situ grazing experiments, tracer solution was diluted with 0.2-μm-pore-size-filtered lake water and added to 120-ml acid-washed glass bottles containing lake water. Final bead concentration was 15 to 20% of natural bacterial abundance. Triplicate bottles from each sampling depth were incubated in situ for 15 min and then fixed using ice-cold glutaraldehyde (2% final concentration) to prevent egestion of the beads from the protozoan food vacuoles (41). To determine uptake of beads by phagotrophic nanoflagellates, 5 to 10 ml of each glutaraldehyde-fixed sample was filtered onto a separate 0.8-μm-pore-size Nuclepore filter, stained with primulin, and examined via EM. UV excitation was used to visualize 200 to 300 flagellates per sample (×1.250), while blue-light excitation was used to enumerate beads present in food vacuoles inside the flagellates. For ciliates, ingested beads were counted by inverted EM. Experimental samples (100 ml for Lake Pavin and 50 ml for Lake Aydat) were settled in plankton chambers as described elsewhere (10), and the whole chamber was scanned at ×400. For each sample, at least 100 ciliates were located by using transmitted light and inspected by using blue-light epifluorescence to enumerate particles contained in food vacuoles. The ingestion rate of individual protozoa (bacteria protozoan−1 h−1) was calculated by multiplying the mean number of beads ingested per protozoan per hour by the natural bacteria-to-bead ratio. Grazing impact was calculated as follows: grazing impact (bacteria liter−1 h−1) = ingestion rate (bacteria protozoan−1 h−1) × protistan species abundance (liter−1).
Other variables.
The temporal and vertical variations in the concentrations of chlorophyll a, as well as of viral and microbial communities (i.e., bacteria, heterotrophic flagellates, pigmented flagellates, and ciliates), have been described in detail by Bettarel et al. (6).
Statistical analyses.
Data were log transformed to satisfy the requirements of normality and homogeneity of variance necessary for parametric statistics. Differences in biological variables were tested using one-way analysis of variance (ANOVA). Relationships between original data sets were tested by Pearson correlation analysis. All statistical analyses were performed using MINITAB 12 analysis.
RESULTS
Temperature, dissolved oxygen.
The changes in water temperature and oxygen contents that were typical in the two lakes were typical of temperate lakes, with stratification starting in spring, somewhat earlier in Lake Pavin than in Lake Aydat (Fig. 1A and C). In the oligomesotrophic Lake Pavin, all the water depths sampled were well oxygenated, the highest concentrations being recorded at the end of August to early September in the metalimnion (Fig. 1B). In Lake Aydat, anoxia started to occur in the deeper water from May onward and progressively ascended the water column until it reached a depth of 6 m in August and September, before disappearing abruptly in October, with the overturn (Fig. 1D).
FIG. 1.

Spatiotemporal variations of temperature and oxygen concentration in the water column of Lake Pavin (A and B) and Lake Aydat (C and D).
Heterotrophic bacterial production.
Bacterial production was on average almost five times higher in the eutrophic Lake Aydat (mean = 109.6 × 10⁶ bacteria liter−1 h−1) than in the oligomesotrophic Lake Pavin (mean = 23.2 × 10⁶ bacteria liter−1 h−1) (Table 1; Fig. 2A and D). In Lake Pavin, we found a significant decrease of bacterial production with depth, whereas no significant vertical differences were detected in Lake Aydat. In the epi- and metalimnion of Lake Pavin and in the epilimnion of Lake Aydat, the bacterial production increased more or less progressively in spring to reach a peak in early summer, followed by a decrease up to the end of the study. The same pattern was observed in the metalimnion of Lake Aydat, with the exception of the first two samples (i.e., March and April) when high values of bacterial production were recorded. In the hypolimnion, the temporal variations in bacterial production were low in Lake Pavin, in contrast to Lake Aydat where very high values were observed in June, July, and September. Thus, in both lakes bacterial production peaked in summer. In Lake Pavin a clear maximum was found, while in Lake Aydat similar peaks were estimated in both the epi- and hypolimnion.
TABLE 1.
Mean values for samples taken from Lake Pavin and Lake Aydat during a seasonal study conducted from March to December of 2000a
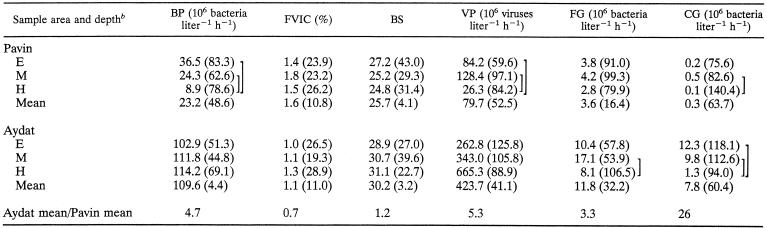 |
BP, bacterial production; BS, burst size (virus particles bacterium−1); VP, viral production; FG, flagellate grazing; CG, ciliate grazing. Coefficients of variation are shown in parentheses. ANOVA data for between-lake comparisons: for BP, F = 61.5, df = 59, P < 0.0001; for FVIC, F = 7.8, df = 59, P = 0.007; for BS, F = 4.3, df = 59, P < 0.042; for VP, F = 18.7, df = 59, P < 0.0001; for FG, F = 29.4, df = 59, P < 0.0001; and for CG, F = 39.7, df = 59, P < 0.0001.
E, epilimnion; M, metalimnion; H, hypolimnion. Significant differences between sampling depths in both lakes (ANOVA, P < 0.05, n = 30) are indicated by brackets.
FIG. 2.

Temporal and vertical variations of bacterial production, FVIC, and burst size (virus particles per bacterium) in the two lakes under study. Errors bars represent standard deviations (n = 3), and letters represent the months.
FVIC.
The FVIC was, on average, significantly higher in the oligomesotrophic Lake Pavin (mean = 1.6%) than in the eutrophic Lake Aydat (mean = 1.1%) (Table 1; Fig. 2B and E). In both lakes, we detected no significant depth-related differences in infection rates. However, the highest FVIC values were recorded within the hypolimnion, for both Lake Pavin (max = 4.1%, September) and Lake Aydat (max = 2.8%, May). The temporal variability of FVIC was roughly characterized, in both lakes, by the maximum observed in late spring (May to June) and early autumn (September to October). In the epilimnion of both lakes, FVIC was correlated with bacterial production (Table 2).
TABLE 2.
Correlation relationships of basic parameters in the epi-, meta-, and hypolimnion of Lake Pavin and Lake Aydata
| Correlation parameter or between-layer correlation | Parameter forb:
|
|||||||||
|---|---|---|---|---|---|---|---|---|---|---|
| Lake Pavin
|
Lake Aydat
|
|||||||||
| BP | FVIC | FG | BS | CG | BP | FVIC | FG | BS | CG | |
| [Chl a] | E−0.611, M−0.649 | |||||||||
| [VLP] | E+0.736 | M+0.601 | H−0.628 | M+0.653, H+0.767 | M+0.640, H+0.696 | |||||
| [Bacteria] | E+0.647 | E+0.702, H+0.655 | ||||||||
| [HNF] | H+0.727 | E+0.606 | ||||||||
| [Ciliates] | M+0.722 | E+0.750, H+0.606 | E+0.822 | E+0.831 | E+0.606 | E+0.859 | ||||
| FVIC | E−0.762 | E+0.781 | ||||||||
| BS | H+0.692 | H+0.641 | ||||||||
| CG | H+0.816 | H+0.620 | E+626, H−0.663 | E+0.640 | H+0.747 | |||||
| E-M | 0.514 | −0.234 | 0.130 | −0.148 | 0.951 | 0.383 | 0.113 | 0.646 | 0.804 | 0.738 |
| E-H | −0.115 | 0.548 | 0.739 | 0.804 | 0.212 | −0.520 | 0.636 | −0.229 | 0.375 | 0.551 |
| M-H | 0.266 | −0.232 | 0.116 | 0.166 | 0.386 | 0.333 | 0.001 | −0.001 | 0.455 | −0.575 |
BP, bacterial production; FG, flagellate grazing; BS, burst size; CG, ciliate grazing; E, epilimnion; M, metalimnion; H, hypolimnion; Chl a, chlorophyll a; VLP, virus-like particle.
Significant relationships (P < 0.05) for between-layer correlations are shown in bold.
Burst size.
The mean number of intracellular viruses observed per infected bacterial cell (i.e., burst size) was significantly lower in the oligomesotrophic Lake Pavin (mean = 25.7) than in the eutrophic Lake Aydat (mean = 30.2) (Table 1; Fig. 2C and F). Again, there were no significant depth-related differences in both lakes. The values remained relatively stable throughout the study, with the exception of some peaks recorded at different depths, in spring in Lake Pavin and in summer in Lake Aydat. In the hypolimnion of Lake Pavin, burst size was correlated with bacterial production and FVIC (Table 2).
Protistan grazing.
Heterotrophic nanoflagellate (HNF) bacterivory was significantly higher in the eutrophic Lake Aydat than in the oligomesotrophic Lake Pavin (Table 1; Fig. 3A and C). In both lakes, the highest grazing rates were recorded in the metalimnion and the lowest in the hypolimnion. As a general rule, bacterivory peaked in autumn at all depths. Two high grazing values were also observed in Lake Aydat in June, in the epi- and the metalimnion. In this lake, HNF grazing was correlated with the bacterial abundance in the epi- and hypolimnion and with viral abundance in the meta- and hypolimnion (Table 2). With one exception (i.e., in the epilimnion of Lake Aydat), bacterial losses related to ciliate grazing activity in both lakes were, on average, significantly lower than those estimated for flagellate grazing (Table 1). Ciliate bacterivory was significantly much higher (∼26 times) in Lake Aydat than in Lake Pavin (Table 1; Fig. 3B and D). The highest values were recorded in the metalimnion of Lake Pavin and in the epilimnion of Lake Aydat. Temporally, the highest values of ciliate grazing were generally recorded in spring and autumn in both lakes, irrespective of depth.
FIG. 3.

Temporal and vertical variations of bacterivory from HNFs and ciliates in the two lakes under study. Errors bars represent standard deviations (n = 3), and letters represent the months.
Fate of bacterial production.
The bacterial losses related to viral lysis and HNF grazing were, on average, significantly higher in the oligomesotrophic Lake Pavin than in the eutrophic Lake Aydat, in contrast to those related to ciliate grazing (Table 3). On average, 56.6% of the bacterial production was removed by viruses and phagotrophic protists in Lake Pavin compared to 36.3% in Lake Aydat. In both lakes, the bacterial losses due to viral lysis and ciliate grazing were, on average, significantly lower than those related to grazing by flagellate protists (Table 3; Fig. 4). However, on some occasions, bacterial mortality due to viral lysis exceeded that due to protistan bacterivory, especially during the period of thermal stratification. This occurred within the metalimnion of Lake Pavin and the anoxic hypolimnion of Lake Aydat. In both lakes, protist-mediated bacterial mortality was higher in autumn (except in the hypolimnion of Lake Pavin), whereas no clear temporal trend characterized viral lysis.
TABLE 3.
Mean seasonal contributions of viral lysis, flagellate grazing, and ciliate grazing to total bacterial mortality at each sampled deptha
| Sample area and depthb | % (CV) of bacterial production removed by:
|
||
|---|---|---|---|
| Viral lysis | Flagellate grazing | Ciliate grazing | |
| Lake Pavin | |||
| E | 13.6 (63.1) | 25.5 (117.4) | 1.6 (137.1) |
| M | 18.8 (53.2) | 23.4 (112.2) | 4.6 (122.0) |
| H | 16.1 (124.0) | 64.2 (88.8) | 1.8 (93.6) |
| Mean | 16.2 (13.1) | 37.7 (49.8) | 2.7 (50.3) |
| Lake Aydat | |||
| E | 7.0 (81.1) | 14.5 (106.3) | 10.7 (100.1) |
| M | 8.8 (84.2) | 21.3 (80.4) | 11.7 (144.9) |
| H | 11.3 (87.1) | 19.6 (169.4) | 4 (182.7) |
| Mean | 9 (19.9) | 18.5 (15.6) | 8.8 (39.2) |
| Aydat mean/Pavin mean | 0.6 | 0.5 | 3.3 |
CV, coefficient of variation. ANOVA data for between-lake comparisons: for viral lysis, F = 7.6, df = 59, P = 0.01; for flagellate grazing, F = 4.3, df = 59, P = 0.04; and for ciliate grazing, F = 8.0, df = 59, P = 0.01. For Lake Pavin, the means for viral lysis and flagellate grazing, for viral lysis and ciliate grazing, and for flagellate grazing and ciliate grazing were all significantly different, and for Lake Aydat, the means for viral lysis and flagellate grazing and for flagellate grazing and ciliate grazing were significantly different (ANOVA, P < 0.05, n = 30). The E and H and the M and H values for Lake Aydat were also significantly different.
E, epilimnion; M, metalimnion; H, hypolimnion.
FIG. 4.

Temporal and vertical impacts of viral lysis and of flagellate and ciliate grazing on bacterial production (expressed in percentage of BP) in the two lakes under study. E, epilimnion; M, metalimnion; H, hypolimnion. Letters represent the months.
DISCUSSION
Frequency of visibly infected bacteria.
The FVIC was, on average, higher in the less productive environment, with mean values of 1.6% in Lake Pavin and 1.1% in Lake Aydat. In the oligotrophic Lake Pavin, not only were viral infection rates higher but also bacterial and viral abundances were more closely linked than in Lake Aydat (r2 = 0.13 for Lake Aydat, compared to r2 = 0.59 for Lake Pavin) (6). It is possible that in oligotrophic lakes where substrates are in short supply for bacterial production, bacterial lysates might represent an important source of dissolved organic matter or inorganic nutrients, the quantity of which would paradoxically depend on the frequency of viral infection.
Our results differ from those of studies conducted in marine systems which have reported higher FVIC values with increasing productivity (46, 61) or no evidence for a relationship between FVIC and productivity (34). In Fig. 5, we plotted the few reported mean FVIC values for freshwaters in relation to the trophic state of the lakes. Although the gaps between each trophic level on the x axis cannot be considered equivalent, there is no apparent trend similar to that which has been found in the marine environment, suggesting that for lakes, productivity alone is a poor predictor of the level of viral infection. Considering that the virus-to-bacterium ratio (VBR) was higher in the more productive lake with lower infection rates (6), our findings support recent observations made by Choi et al. (12) for the eutrophic Masan Bay (Korea), in which they concluded that high encounter rates between bacteria and viruses need not apparently result in high bacterial mortality due to viruses.
FIG. 5.

Frequencies of visibly infected bacteria in freshwaters, along a trophic gradient. Open triangles correspond to short-term studies (<5 days), and filled triangles correspond to long-term studies (>3 months).
With regard to depth-related differences, although FVIC values in both lakes were slightly lower at the surface than in deeper waters, the differences were insignificant. The same was found in two oligotrophic lakes in Sweden (54). Choi and coauthors also reported similar FVICs in the water column of the Masan Bay. Lower FVICs have been recorded on several occasions in the upper layers of lakes (24, 58). To explain this, Hofer and Sommaruga (24) suggested that solar radiation might affect FVIC in surface water, through the inactivation of phages. Such a hypothesis has been experimentally demonstrated by several authors (33, 48, 64, 67). Weinbauer and Höfle (58) related the low FVIC values in the epilimnion of the eutrophic Lake Pluβsee to a higher protistan predation pressure and potentially greater bacterioplankton diversity in this layer. Some evidence for this hypothesis was provided by Dominik and Höfle (15) for the same lake; they found that bacterial diversity was lower in the anoxic hypolimnion, contrasting with the high diversity index within the epilimnion. A similar situation was identified in the Baltic Sea (25). Since protistan bacterivory was significantly higher in the oxygenated upper waters than in the anoxic bottom waters of Lake Aydat while the mean FVIC was relatively higher in the anoxic hypolimnion, it is indeed tempting to think that host genetic diversity might be important in controlling viral infection rates. The argument has been made theoretically that high-diversity bacterial communities can be controlled by viral lysis less easily than low-diversity communities can be (51).
Peaks of FVIC occurred in both lakes roughly at the same period: at the end of spring (May to June) and in early autumn (September to October). However, other than these corresponding peaks, no clear pattern was detected. While we did find a few significant correlations between FVIC and other parameters (Table 2), viral infection was not consistently related to the total abundance and production of their hosts, the total viral abundance, or the VBR. Given the general high specificity of the virus-host relationship, viral attack in our two lakes could be rather dependent on the density of the susceptible host population, rather than to the density of the whole host population. The study of changes in the bacterial community composition (BCC) could be useful in explaining the variability of viral infection rates.
Recently, Šimek et al. (42) investigated such BCC variability in relation to protistan predation and viral lysis in a mesoeutrophic reservoir. They concluded that protistan grazing is a better predictor of viral lysis than is BCC. One possible explanation put forth was that grazing stimulated the bacterial growth rate, and as growth rate increases so does receptor formation on the bacterial cell surface (42). From a study conducted in the same lake, Weinbauer et al. (61) also reported an association between grazing pressure and viral infection rates; an alternative explanation was proposed: grazing pressure on the bacterioplankton may cause changes in community composition corresponding to the development of grazing-resistant but virus-sensitive species. However, neither of these two scenarios fit the data in our two lakes, as we found that the temporal dynamics of FVIC were not correlated with flagellate bacterivory, and grazing peaks were not associated with viral-induced mortality peaks.
Burst size.
The abundances of viruses and the VBR were higher in the eutrophic Lake Aydat than in the oligomesotrophic Lake Pavin (6). Wommack and Colwell (68), who have reported increases in VBR with the trophic state in the marine environment, suggested that the burst size of infected bacteria would be higher in more productive environments. This is not unreasonable, as both cell size and growth rate are generally greater in eutrophic than in oligotrophic environments, and burst size is related to cell biovolume (59) and growth rate (31). Thus, our higher values of burst size in Lake Aydat (mean = 30.2 viruses bacterium−1) compared with those in Lake Pavin (mean = 25.7 viruses bacterium−1) are not surprising. The mean bacterial cell volumes typically average 0.1 μm3 in Lake Pavin (11) and 0.2 μm3 in Lake Aydat (43), which corroborates the observations of Weinbauer and Höfle concerning cell and burst sizes (59). Interestingly, this assumption is realistic only if the viral population has the same capsid size, which is apparently untrue as there is a high morphometric diversity of aquatic viruses (39).
Weinbauer and Höfle (58) and Weinbauer et al. (61) reported higher burst sizes in the deep anoxic waters than in the surface waters of Lake Pluβsee and of the Baltic Sea, respectively. This was not the case in our two lakes, where similar burst sizes were recorded at all sampling depths. Similarly, Choi et al. (12) did not report higher burst sizes in the hypoxic hypolimnion of the Masan Bay. Thus, no consistent pattern seems to emerge concerning the vertical variability of burst size, and the little data available prevent generalization.
Methodological aspects for lysis and predation estimates.
The estimates of VIBM could be biased by (i) the values of FVIC obtained from the direct count of infected cells by TEM and (ii) the conversion of FVIC into VIBM. Indeed, it has been suggested that the use of ultracentrifugation at high speeds (>60,000 × g) to concentrate bacterioplankton could lead to rupturing of the cell membranes of infected cells (19, 46, 58). In addition, the fact that some bacteria often appear opaque under TEM could also lead to an underestimate of FVIC (16). It has also been reported that estimates of FVIC made from observations of entire cells only account for about 80% of those identified from observations of thin sections (58). Estimating FVIC as we did may thus potentially underestimate the level of virus-mediated mortality. Furthermore, the use of the empirical model of Weinbauer et al. (60) for converting FVIC into FIC may also be a source of bias. A virus dilution approach was developed by these authors to obtain an independent estimate of FIC in marine samples. From the relationship between FVIC, as determined by the TEM approach, and FIC, as determined by the virus dilution approach, an improved model was proposed which we applied in our study. However, it is likely that the parameters of the model vary depending on environmental conditions, though this has yet to be determined. In addition, in the model for converting FIC into VIBM as formulated by Binder (8), it is assumed that infected and uninfected bacteria are grazed at the same rate. This also may not be the case, as Weinbauer and Peduzzi (56) suggested, from a study conducted in the Adriatic Sea, that protistan grazers could exert selective feeding on infected cells that are presumed to be larger in size than noninfected bacteria.
A variety of methods have been employed for quantifying in situ protozoan grazing rates (30). The use of fluorescent microspheres allowed us to directly measure the ingestion and grazing rates of the different groups of protozoa (36). Assuming that protozoa can theoretically discriminate between bacterial prey based on their size, surface properties, nutrient status, and physiological state, the use of latex beads as bacterial analogues could be a potential source of underestimation of our protozoan bacterivory. Some studies have found that some ciliates and flagellates prefer fluorescently labeled bacteria (FLB) to microspheres (cf. reference 10). In addition, Sanders et al. (41) noticed that size differences between FLB and microspheres might be a factor affecting the relative grazing rates. However, no general pattern of selection between FLB and microspheres was found in Lake Oglethorpe (41). By using similar-size latex beads and living particles, Jonsson (28) found no significant difference in clearance rates of marine oligotrichous ciliates. Jones and Rees (27) also reported that Dinobryon divergens did not discriminate between different types of particles. Factors that determine variability in protozoan ingestion rates are still poorly understood, and considerable variation in ingestion rates has been found between surrogate food particles and also among natural food particles (cf. references 10, 13, 14, and 27).
Given the assumptions involved in estimating bacterial mortality from FVIC data and the uncertainties involved in extrapolating microsphere ingestion to ingestion of natural living bacteria, we could only hope to establish temporal trends as well as interlayer and interlake differences and approximate magnitudes and variabilities of bacterial mortality.
Bacterial mortality.
We found that, on average, (i) either virus- or flagellate-induced bacterial mortality was higher in the oligotrophic Lake Pavin than in the eutrophic Lake Aydat and (ii) bacterial losses from viral lysis were almost always lower than those from protistan bacterivory (Table 3; Fig. 4).
Our finding that HNF bacterivory is the main source of bacterial mortality in both lakes is apparently true for a large variety of aquatic systems (4, 5, 18, 22, 42, 46, 58). Nevertheless, there are isolated reports of VIBM being equivalent to (17) or even exceeding flagellate predation (16, 34), as was very occasionally the case during our study. The predominance of one or the other of these bacterial loss factors in the aquatic environment is still poorly understood. Indeed, it has been reported that high viral control of bacterial production occurs either at reduced (16, 58) or high grazing activities (42, 61). The fraction of the bacterial production consumed by flagellates in Lake Pavin that was higher than that in Lake Aydat is typical of pelagic marine environments where protistan bacterivory classically increases with decreasing productivity (e.g., reference 47). We found similar results for viral lysis in the two lakes sampled. This suggests that in low-productivity, microbial-loop-dominated systems, viral activity could result in a greater recycling of organic material between bacterial biomass and the dissolved organic matter pool, thereby impacting the transfer of organic matter up to the higher trophic levels. Our observations clearly agree with the model of Murray and Eldridge (32), where the greatest impact of viral activity on food webs occurs under oligotrophic conditions.
During this study, the longest period during which bacterial mortality related to viral lysis was much higher than protistan grazing corresponded to the period of thermal stratification (May to October) in the anoxic hypolimnion of Lake Aydat. Similar observations have already been reported by Weinbauer and Höfle (58) in the eutrophic Lake Pluβsee and predicted by Pedros-Alio et al. (37). The latter authors postulated that grazing controls the abundance of heterotrophic prokaryotic plankton in well-oxygenated waters, whereas most bacterial mortality would necessarily be attributed to other factors such as viral lysis in anoxic environments in which grazers are rare. The predominance of viral lysis in anoxic waters could thus be related to the low abundance of bacterivores, as well as to the low bacterial diversity reported in anoxic waters.
Finally, the combined mortality related to viral lysis and to protistan bacterivory accounted for 56.5% of the bacterial production in Lake Pavin and 36.3% in Lake Aydat. Occasionally, especially during autumn in Lake Pavin, all of the bacterial production was balanced by these two causes of mortality. Even when taking into account the probable underestimation of the two mortality factors that were measured, it remains likely that a fraction of the bacterial production in both lakes was likely controlled by factors other than viral lysis and protistan predation, such as metazoan bacterivory. This was particularly credible during the period of thermal stratification (Fig. 4), which usually coincides with the maximum development of Cladocera and Rotifera spp., which then derive most of their resources from intense bacterivory (cf. reference 52). We found that viral infection rates, as estimated by FVIC, as well as burst size, showed much less variability than bacterial production or protistan community grazing rates judging from either the coefficients of variation (Table 1) or total ranges of the parameters (Fig. 2 and 3). This is in contrast with marine systems in which viral parameters (FVIC, burst size, and viral concentrations) vary to about the same extent as other microbial population stocks or activity measures (cf. reference 4). One may conclude then that in both lakes viral mortality represented a relatively constant mortality source in a bacterial community showing large variations in growth rate and subject to large variations in loss rates from grazers.
Acknowledgments
We are very grateful to C. Portelli and D. Sargos for their field assistance. We also appreciate the helpful comments by E. Verling and W. D. Coats.
Y.B. was supported by a graduate fellowship from the French Ministry of Research and Technology.
REFERENCES
- 1.Azam, F., T. Fenchel, J. G. Field, J. S. Gray, L. A. Meyer-Reil, and T. F. Thingstad. 1983. The ecological role of water-column microbes in the sea. Mar. Ecol. Prog. Ser. 10:257-263. [Google Scholar]
- 2.Bell, R. T. 1993. Estimating production of heterotrophic bacterioplankton via incorporation of tritiated thymidine, p. 495-503. In P. F. Kemp, B. F. Sherr, E. B. Sherr, and J. J. Cole (ed.), Handbook of methods in aquatic microbial ecology. Lewis Publishers, Boca Raton, Fla.
- 3.Bergh, O., K. Y. Børsheim, G. Bratbak, and M. Heldal. 1989. High abundance of viruses found in aquatic environments. Nature 340:467-468. [DOI] [PubMed] [Google Scholar]
- 4.Bettarel, Y., J. R. Dolan, K. Hornak, R. Lemee, M. Masin, M.-L. Pedrotti, E. Rochell-Newell, K. Simek, and T. Sime-Ngando. 2002. Strong, weak, and missing links in a microbial community of the N. W. Mediterranean Sea. FEMS Microb. Ecol. 42:451-462. [DOI] [PubMed] [Google Scholar]
- 5.Bettarel, Y., C. Amblard, T. Sime-Ngando, J.-F. Carrias, D. Sargos, F. Garabetian, and P. Lavandier. 2003. Viral lysis, flagellate grazing potential, and bacterial production in Lake Pavin. Microb. Ecol. 45:119-127. [DOI] [PubMed] [Google Scholar]
- 6.Bettarel, Y., T. Sime-Ngando, C. Amblard, J.-F. Carrias, and C. Portelli. 2003. Virioplankton and microbial communities in aquatic systems: a seasonal study in two lakes of different trophy. Freshw. Biol. 48:810-820. [Google Scholar]
- 7.Billen, G., P. Servais, and S. Becquevort. 1990. Dynamics of bacterioplankton in oligotrophic and eutrophic aquatic environments: bottom-up or top-down control? Hydrobiologia 207:37-42. [Google Scholar]
- 8.Binder, B. 1999. Reconsidering the relationship between virally induced bacterial mortality and frequency of infected cells. Aquat. Microb. Ecol. 18:207-215. [Google Scholar]
- 9.Bratbak, G., M. Heldal, T. F. Thingstad, B. Riemann, and O. H. Haslund. 1992. Incorporation of viruses into the budget of microbial C-transfer. A first approach. Mar. Ecol. Prog. Ser. 83:273-280. [Google Scholar]
- 10.Carrias, J. F., C. Amblard, and G. Bourdier. 1996. Protistan bacterivory in an oligomesotrophic lake: importance of attached ciliates and flagellates. Microb. Ecol. 31:249-268. [DOI] [PubMed] [Google Scholar]
- 11.Carrias, J. F., C. Amblard, C. Quiblier-Lloberas, and G. Bourdier. 1998. Seasonal dynamics of free and attached heterotrophic nanoflagellates in an oligomesotrophic lake. Freshw. Biol. 39:91-101. [Google Scholar]
- 12.Choi, D. H., C. Y. Hwang, and B. C. Cho. 2003. Comparison of virus- and bacterivory-induced bacterial mortality in the eutrophic Masan Bay, Korea. Aquat. Microb. Ecol. 30:117-125. [Google Scholar]
- 13.Christaki, U., J. R. Dolan, S. Pelegri, and F. Rassoulzadegan. 1998. Consumption of picoplankton-size particles by marine ciliates: effects of physiological state of the ciliate and particle quality. Limnol. Oceanogr. 43:458-464. [Google Scholar]
- 14.Christaki, U., S. Jacquet, J. R. Dolan, S. D. Vaulot, and F. Rassoulzadegan. 1999. Growth and grazing on Prochlorococcus and Synechococcus by two marine ciliates. Limnol. Oceanogr. 44:52-61. [Google Scholar]
- 15.Dominik, K., and M. G. Höfle. 2002. Changes in bacterioplankton community structure and activity with depth in a eutrophic lake as revealed by 5S rRNA analysis. Appl. Environ. Microbiol. 68:3606-3613. [DOI] [PMC free article] [PubMed] [Google Scholar]
- 16.Fischer, U. R., and B. Velimirov. 2002. High control of bacterial production by viruses in a eutrophic oxbow lake. Aquat. Microb. Ecol. 27:1-12. [Google Scholar]
- 17.Fuhrman, J. A., and R. T. Noble. 1995. Viruses and protists cause similar bacterial mortality in coastal seawater. Limnol. Oceanogr. 40:1236-1242. [Google Scholar]
- 18.Guixa-Boixareu, N., J. I. Calderon-Paz, M. Heldal, G. Bratbak, and C. Pedros-Alio. 1996. Viral lysis and bacterivory as prokaryotic loss factors along a salinity gradient. Aquat. Microb. Ecol. 11:215-227. [Google Scholar]
- 19.Guixa-Boixareu, N., D. Vaque, J. M. Gasol, and C. Pedros-Alio. 1999. Distribution of viruses and their potential effect on bacterioplankton in an oligotrophic marine system. Aquat. Microb. Ecol. 19:205-213. [Google Scholar]
- 20.Guixa-Boixareu, N., K. Lysnes, and C. Pedros-Alio. 1999. Viral lysis and bacterivory during a phytoplankton bloom in a coastal water microcosm. Appl. Environ. Microbiol. 65:1949-1958. [DOI] [PMC free article] [PubMed] [Google Scholar]
- 21.Heldal, M., and G. Bratbak. 1991. Production and decay of viruses in aquatic environments. Mar. Ecol. Prog. Ser. 72:205-212. [Google Scholar]
- 22.Hennes, K. P., and M. Simon. 1995. Significance of bacteriophages for controlling bacterioplankton growth in a mesotrophic lake. Appl. Environ. Microbiol. 61:333-340. [DOI] [PMC free article] [PubMed] [Google Scholar]
- 23.Hewson, I., J. M. O'Neil, J. A. Fuhrman, and W. C. Dennison. 2001. Virus-like particle distribution and abundance in sediments and overlaying waters along eutrophication gradients in two subtropical estuaries. Limnol. Oceanogr. 46:1734-1746. [Google Scholar]
- 24.Hofer, J. S., and R. Sommaruga. 2001. Seasonal dynamics of viruses in an alpine lake: importance of filamentous forms. Aquat. Microb. Ecol. 26:1-11. [Google Scholar]
- 25.Höfle, M. G., and I. Brettar. 1995. Taxonomic diversity and metabolic activity of microbial communities in the water column of the central Baltic Sea. Limnol. Oceanogr. 40:868-874. [Google Scholar]
- 26.Hwang, C. Y., and B. C. Cho. 2002. Virus-infected bacteria in oligotrophic open waters of the East Sea, Korea. Aquat. Microb. Ecol. 30:1-9. [Google Scholar]
- 27.Jones, R. I., and S. Rees. 1994. Characteristics of particle uptake by the phagotrophic phytoflagellate, Dinobryon divergens. Mar. Microb. Food Webs 8:97-110. [Google Scholar]
- 28.Jonsson, P. R. 1986. Particle size selection, feeding rates, and growth dynamics of marine planktonic oligotrichous ciliates (Ciliophora, Oligotrichida). Mar. Ecol. Prog. Ser. 33:265-277. [Google Scholar]
- 29.Mathias, C. B., K. T. Kirschner, and B. Velimirov. 1995. Seasonal variations of virus abundance and viral control of the bacterial population in backwater system of the Danube River. Appl. Environ. Microbiol. 61:3734-3740. [DOI] [PMC free article] [PubMed] [Google Scholar]
- 30.McManus, G. B., and J. A. Fuhrman. 1988. Control of marine bacterioplankton populations: measurement and significance of grazing. Hydrobiologia 159:51-62. [Google Scholar]
- 31.Middelboe, M. 2000. Bacterial growth rate and marine virus-host dynamics. Microb. Ecol. 40:114-124. [DOI] [PubMed] [Google Scholar]
- 32.Murray, A. G., and P. M. Eldridge. 1994. Marine viral ecology: incorporation of bacteriophages into the microbial planktonic food web paradigm. J. Plankton Res. 16:627-641. [Google Scholar]
- 33.Noble, R. T., and J. A. Fuhrman. 1997. Virus decay and its causes in coastal waters. Appl. Environ. Microbiol. 63:77-83. [DOI] [PMC free article] [PubMed] [Google Scholar]
- 34.Noble, R. T., and J. A. Fuhrman. 2000. Rapid virus production and removal as measured with fluorescently labeled viruses as tracers. Appl. Environ. Microb. 66:3790-3797. [DOI] [PMC free article] [PubMed] [Google Scholar]
- 35.Organization for Economic Cooperation and Development. 1982. Eutrophication of waters: monitoring, assessment and control. Environment Directorate, OECD, Paris, France.
- 36.Pace, M. L., and M. D. Bailif. 1987. Evaluation of fluorescent microsphere technique for measuring grazing rates of phagotrophic microorganisms. Mar. Ecol. Prog. Ser. 40:185-193. [Google Scholar]
- 37.Pedros-Alio, C., J. I. Calderon-Paz, and J. M. Gasol. 2000. Comparative analysis shows that bacterivory, not viral lysis, controls the abundance of heterotrophic prokaryotic plankton. FEMS Microbiol. Ecol. 32:157-165. [DOI] [PubMed]
- 38.Proctor, L. M., and J. A. Fuhrman. 1990. Viral mortality of marine bacteria and cyanobacteria. Nature 343:60-62. [Google Scholar]
- 39.Proctor, L. M. 1997. Advances in the study of marine viruses. Microsc. Res. Tech. 37:136-161. [DOI] [PubMed] [Google Scholar]
- 40.Rioual, P. 2002. Limnological characteristics of 25 lakes of the French Massif Central. Ann. Limnol. 38:311-327. [Google Scholar]
- 41.Sanders, R. W., K. G. Porter, S. J. Bennett, and A. E. Debiase. 1989. Seasonal patterns of bacterivory by flagellates, ciliates, rotifers, and cladocerans in a freshwater planktonic community. Limnol. Oceanogr. 34:673-687. [Google Scholar]
- 42.Šimek, K., J. Pernthaler, M. G. Weinbauer, K. Hornak, J. R. Dolan, J. Nedoma, M. Masin, and R. Amann. 2001. Changes in bacterial community composition and dynamics and viral mortality rates associated with enhanced flagellate grazing in a mesoeutrophic reservoir. Appl. Environ. Microbiol. 67:2723-2733. [DOI] [PMC free article] [PubMed] [Google Scholar]
- 43.Sime-Ngando, T., G. Bourdier, C. Amblard, and B. Pinel-Alloul. 1991. Short-term variations in specific biovolumes of different forms in aquatic ecosystems. Microb. Ecol. 21:211-226. [DOI] [PubMed] [Google Scholar]
- 44.Sime-Ngando, T., J.-P. Mignot, C. Amblard, G. Bourdier, C. Desvilettes, and C. Quiblier-Lloberas. 1996. Characterization of planktonic virus-like particles in a French mountain lake: methodological aspects and preliminary results. Ann. Limnol. 32:1-5. [Google Scholar]
- 45.Steward, G. F., J. Wikner, D. C. Smith, W. P. Chochlan, and F. Azam. 1992. Estimation of virus production in the sea. I. Method development. Mar. Microb. Food Webs 6:57-78. [Google Scholar]
- 46.Steward, G. F., D. C. Smith, and F. Azam. 1996. Abundance and production of bacteria and viruses in the Bering and Chukchi Seas. Mar. Ecol. Prog. Ser. 131:287-300. [Google Scholar]
- 47.Strom, S. L. 2000. Bacterivory: interactions between bacteria and their grazers, p. 351-386. In D. L. Kirchman (ed.), Microbial ecology of the oceans. Wiley-Liss, Inc., New York, N.Y.
- 48.Suttle, C. A., and F. Chen. 1992. Mechanisms and rates of decay of marine viruses in seawater. Appl. Environ. Microbiol. 58:3721-3729. [DOI] [PMC free article] [PubMed] [Google Scholar]
- 49.Suttle, C. A. 1994. The significance of virus to mortality in aquatic microbial communities. Microb. Ecol. 28:237-243. [DOI] [PubMed] [Google Scholar]
- 50.Tapper, M. A., and R. E. Hicks. 1998. Temperate viruses and lysogeny in Lake Superior bacterioplankton. Limnol. Oceanogr. 43:95-103. [Google Scholar]
- 51.Thingstad, T. F. 2000. Elements of theory for the mechanisms controlling abundance, diversity, and biogeochemical role of lytic bacterial viruses in aquatic systems. Limnol. Oceanogr. 45:1320-1328. [Google Scholar]
- 52.Thouvenot, A., M. Richardot, D. Debroas, and J. Devaux. 1999. Bacterivory of metazooplankton, ciliates and flagellates in a newly flooded reservoir. J. Plankton Res. 21:1659-1679. [Google Scholar]
- 53.Tuomi, P., C. Lundsgaard, J. Ekebom, K. Olli, and K. Kunnis. 1999. The production and potential loss mechanisms of bacterial biomass in the southern Gulf of Riga. J. Mar. Syst. 23:185-196. [Google Scholar]
- 54.Vrede, K., U. S. Tensdotter, and E. S. Lindstrom. 2003. Viral and bacterioplankton dynamics in two lakes with different humic contents. Microb. Ecol. 46:406-415. [DOI] [PubMed] [Google Scholar]
- 55.Weinbauer, M. G., D. Fuks, and P. Peduzzi. 1993. Distribution of viruses and dissolved DNA along a coastal trophic gradient in the northern Adriatic Sea. Appl. Environ. Microbiol. 59:4074-4082. [DOI] [PMC free article] [PubMed] [Google Scholar]
- 56.Weinbauer, M. G., and P. Peduzzi. 1995. Significance of viruses versus heterotrophic nanoflagellates for controlling bacterial abundance in the northern Adriatic Sea. J. Plankton Res. 17:1851-1856. [Google Scholar]
- 57.Weinbauer, M. G., D. Fuks, S. Puskaric, and P. Peduzzi. 1995. Diel, seasonal and depth-related variability of viruses and dissolved DNA in the northern Adriatic Sea. Microb. Ecol. 30:25-41. [DOI] [PubMed] [Google Scholar]
- 58.Weinbauer, M. G., and M. G. Höfle. 1998. Significance of viral lysis and flagellate grazing as factors controlling bacterioplankton production in a eutrophic lake. Appl. Environ. Microbiol. 64:431-438. [DOI] [PMC free article] [PubMed] [Google Scholar]
- 59.Weinbauer, M. G., and M. G. Höfle. 1998. Size-specific mortality of lake bacterioplankton by natural virus communities. Aquat. Microb. Ecol. 15:103-113. [Google Scholar]
- 60.Weinbauer, M. G., C. Winter, and M. G. Höfle. 2002. Reconsidering transmission electron microscopy based estimates of viral infection of bacterioplankton using conversion factors derived from natural communities. Aquat. Microb. Ecol. 27:103-110. [Google Scholar]
- 61.Weinbauer, M. G., U. Christaki, J. Nedoma, and K. Simek. 2003. Comparing the effects of resource enrichment and grazing on viral production in a meso-eutrophic reservoir. Aquat. Microb. Ecol. 31:137-144. [Google Scholar]
- 62.Weinbauer, M. G., I. Brettar, and M. G. Höfle. 2003. Lysogeny and virus-induced mortality of bacterioplankton in surface, deep and anoxic marine waters. Limnol. Oceanogr. 48:1457-1465. [Google Scholar]
- 63.Wicks, R. J., and R. D. Robarts. 1987. The extraction and purification of DNA labelled with [methyl-3H]thymidine in aquatic bacterial production studies. J. Plankton Res. 9:1159-1166. [Google Scholar]
- 64.Wilhelm, S. W., M. G. Weinbauer, C. A. Suttle, and W. H. Jeffrey. 1998. The role of sunlight in the removal and repair of viruses in the sea. Limnol. Oceanogr. 43:586-592. [Google Scholar]
- 65.Wilhelm, S. W., and R. E. H. Smith. 2000. Bacterial carbon production in Lake Erie is influenced by viruses and solar radiation. Can. J. Fish. Aquat. Sci. 57:317-326. [Google Scholar]
- 66.Wilhelm, S. W., S. Briden, and C. A. Suttle. 2002. A dilution technique for the direct measurement of viral production: a comparison in stratified and tidally mixed coastal waters. Microb. Ecol. 43:168-173. [DOI] [PubMed] [Google Scholar]
- 67.Wommack, K. E., R. T. Hill, T. A. Muller, and R. R. Colwell. 1996. Effects of sunlight on bacteriophage viability and structure. Appl. Environ. Microbiol. 62:1336-1341. [DOI] [PMC free article] [PubMed] [Google Scholar]
- 68.Wommack, K. E., and R. R. Colwell. 2000. Virioplankton: viruses in aquatic ecosystems. Microbiol. Mol. Biol. Rev. 64:69-114. [DOI] [PMC free article] [PubMed] [Google Scholar]