

Abstract
Vestibular signals are pervasive throughout the central nervous system, including the cortex, where they likely play different roles than they do in the better studied brainstem. Little is known about the parieto-insular vestibular cortex (PIVC), an area of the cortex with prominent vestibular inputs. Neural activity was recorded in the PIVC of rhesus macaques during combinations of head, body, and visual target rotations. Activity of many PIVC neurons was correlated with the motion of the head in space (vestibular), the twist of the neck (proprioceptive), and the motion of a visual target, but was not associated with eye movement. PIVC neurons responded most commonly to more than one stimulus, and responses to combined movements could often be approximated by a combination of the individual sensitivities to head, neck, and target motion. The pattern of visual, vestibular, and somatic sensitivities on PIVC neurons displayed a continuous range, with some cells strongly responding to one or two of the stimulus modalities while other cells responded to any type of motion equivalently. The PIVC contains multisensory convergence of self-motion cues with external visual object motion information, such that neurons do not represent a specific transformation of any one sensory input. Instead, the PIVC neuron population may define the movement of head, body, and external visual objects in space and relative to one another. This comparison of self and external movement is consistent with insular cortex functions related to monitoring and explains many disparate findings of previous studies.
Keywords: insula, multisensory, self-motion, sensory integration, spatial orientation
the insular cortex has for a long time been difficult to study and has therefore been poorly understood. The absence of clarity can also be attributed to the insular cortex itself. Unlike other brain regions, insular damage does not always produce defined or lasting deficits in behavior (Cereda et al. 2002; Duffau et al. 2006; Baier et al. 2013). The advent of brain imaging has provided many new insights into insular function. The posterior insula has recently been shown to be activated with a number of perceptual conditions including out-of-body experience, subjective awareness of bodily states (Simmons et al. 2012), subjective imagery of body orientation (Arzy et al. 2006), body ownership (Karnath and Baier 2010), and the interpretation of others' actions (Abreu et al. 2012). The culmination of brain imaging has led to the view that the posterior insula contributes to interoceptive awareness or more specifically monitoring body states (zu Eulenburg et al. 2013).
This same cortical area is also viewed as the primary vestibular sensory cortex (Eickhoff et al. 2006; Lopez et al. 2012a). This perception of the posterior insula has a notable history, as stimulation in the vicinity of the posterior insula produces the sensation of movement (Penfield and Boldrey 1937; Kahane et al. 2003). Sensory information may be essential to interoceptive monitoring, but it is unclear whether the posterior insula also acts in sensory perception.
Physiological and anatomical studies in primates have shown that the posterior insula is anatomically connected to the vestibular nuclei and is defined by physiological responses to vestibular stimulation (the posterior insula is better known in the primate as the parieto-insular vestibular cortex, PIVC) (Akbarian et al. 1988; Grusser et al. 1990b). However, the posterior insula is not always activated by moving stimuli that produce perceptions of self-motion (physiology: Chen et al. 2010; imaging: Becker-Bense et al. 2012). Thus functions of vestibular signals in this region and how these signals are processed remain open questions.
The posterior insula is multimodal, where vestibular signals converge with at least visual and proprioceptive information (physiology: Akbarian et al. 1988; Grusser et al. 1990b; imaging: zu Eulenburg et al. 2013). Proprioceptive sensitivity to stimulation of the neck, trunk, limbs, hands, and feet is found in the posterior insula (physiology: Friedman et al. 1986; Robinson and Burton 1980; imaging: Lotsch et al. 2012; Macey et al. 2012). Furthermore, in imaging studies, some visual stimuli are shown to evoke responses in the posterior insula (Kleinschmidt et al. 2002; Dupont et al. 1994; Sunaert et al. 1999; Antal et al. 2008). The posterior insula is also active while human subjects track moving objects (Indovina et al. 2005; Nagel et al. 2006; Lindner et al. 2006) but not while fixating a stationary object (Asahi et al. 2006). This combination of responses is consistent with monitoring objects in the environment. However, although visual responses have been seen in neural responses to rotations of the visual field (Grusser et al. 1990b), posterior insular neurons did not represent optic flow (Chen et al. 2010). Furthermore, the response of posterior insula neurons to visual targets has not been previously tested. To be consistent with monitoring one's motion relative to objects of interest, the posterior insula should contain neural signals that carry visual object information along with the information about self-motion. Vestibular signals carry information about the movement of head in space. Proprioceptive signals represent movement of the body elements relative to one another.
To date, much of the speculation about posterior insula function is based on fMRI and lesion data. Only a handful of papers describing neuronal recording in the posterior insula have been published. We explored responses of single neurons during combinations of head, body, and visual target movements in the horizontal plane. We sought to understand the interaction of visual object and self-motion signals at the single cell level in the posterior insula and to explore whether the posterior insular neurons might differentially encode active (self-generated) vs. passive (imposed) movements. Our results found that PIVC neurons respond to combinations of head, body, and visual object motion. Although these neurons demonstrated heterogeneity in responses to multimodal stimuli, the responses were consistent with perceptual monitoring of moving objects in the environment and relative to our own movements whether passively applied or self-generated.
METHODS
Subjects and surgery.
One female and one male rhesus macaque (Macaca mulatta), each weighing ∼4 kg, were used in these experiments. The details of the surgical implantation of the head restraint, recording chamber, and eye coils have been previously published (Newlands et al. 2009). Initially, a head-restraint post was implanted in dental acrylic that was attached to the monkey's skull via surgically implanted, transcranial stainless steel T-bolts. A recording well (custom built, stainless steel, 1.5-cm diameter) was also attached to the skull embedded in the same acrylic. The recording grid that held the electrode in the chamber allowed sampling a 10-mm circular anatomical region at 1-mm intervals. The chamber was implanted over the PIVC using stereotaxic coordinates, in which the chamber was angled laterally by 25°. The electrode chamber was centered such that the electrode at the center of the grid entered the brain at 18 mm lateral of midline and 5 mm anterior to the interaural axis. At a second surgery, 1.5-cm diameter three-turn stainless steel eye coils were implanted under the conjunctiva of one eye, and the eye coil lead wire was tunneled subcutaneously to the head implant where the leads were soldered to connectors. A second coil was attached to the head-restraint post, but not surgically implanted, and allowed the monitoring of head movement in space. All surgical procedures were performed in accordance with institutional and National Institutes of Health guidelines and under a protocol approved by the Institutional Animal Care and Use Committee at the University of Texas Medical Branch. At the termination of the experiments, both animals were euthanized by deep phenobarbital anesthesia followed by transcardiac perfusion with heparinized saline and 4% paraformaldehyde.
Equipment.
For the experiments described, the monkeys sat in a custom-made Plexiglas primate chair. The chair restrained their shoulder movements using a Plexiglas bar across the upper chest, limiting their ability to turn their shoulders. For experiments, the chair was mounted to a computer-controlled 80 ft/lb Neurokinetics motor that provided passive yaw rotation. The head-restraint post was a round stainless steel tube with a square interior into which a bar could be inserted. The post was implanted at the top of the skull on the midline, along the axis of neck rotation. The head-restraint post was connected via a coupling bar to a computer-controlled motorized clutch (1.47 ft/lb motor, MicroMo/Faulhaber) that itself was attached to the primate chair. Activating the clutch mechanically coupled the head to the motor, allowing passive head on neck yaw rotation, whereas deactivating the clutch allowed for active, head-free, rotation of the head in the horizontal plane. The animals could only move their head or have their head rotated in the horizontal plane ± 60° right or left of the straight ahead orientation (0°) although, for the tasks described here, that full range was not utilized, and the targets used were limited to ± 40°. Head movements were primarily restricted to rotation in the horizontal plane; however, as a matter of comfort and safety, and to allow a more natural yaw during head movement, which included small movements out of the yaw plane, there was a large spring situated between the bar coming from the head-restraint post and the shaft of the motorized clutch that allowed small amounts of translation, pitch, and roll. The primate chair and motion control were set inside of a 3-ft three-coil magnetic field system (C-N-C Engineering). Visual targets were presented on a video screen (HD-P61R1U, JVC) in the horizontal plane at the level of the straight-ahead eye position of the animals. Targets were moved across a range of viewing angles up to ± 24°. During experimentation, the room lights were turned off, and the animals sat in an apparatus that had been draped in light blocking material on all sides around the outside of the 36-inch coil form. For nontargeted trials, the video screen was turned completely off to produce complete darkness. A cartoon diagram of the apparatus is shown in Fig. 1.
Fig. 1.

Schematic representation of the experimental apparatus with independently controllable head rotation, trunk rotation, and visual target.
Alignment of the eye coil and target position was maintained by coordinated calibrations. The eye coil was calibrated using a modification of the total field-calibration technique (http://sine.ni.com/cs/app/doc/p/id/cs-604). In short, the eye and head coils were calibrated postimplantation. The animal was pitched and rotated to face a range of different directions in three dimensions. The different orientations of the eye and head coils provided the coil signal across different orientations, covering an even distribution along the three orthogonal planes of three-dimensional space. The three-dimensional sphere created by the recorded eye coil data at each orientation was then fit along each of the coordinate axes, and the parameters defining the circle or oval in each plane were used to calibrate input of the eye coils to accurately predict the orientation of the coil for any three-dimensional orientation. This method makes no assumptions about the size, shape, or number of turns in the implanted coil. The head and chair motor servo-system was then aligned with the coil calibration by matching the head coil signal to the motor position feedback information. Target calibration was performed by aligning the target motion with a laser attached to the head-restraint coupling. The offsets in the alignment of the target with the eye coil were then removed by having the animal fixate on a stationary target while head-restrained and stationary.
The computer control system coordinated the visual display and motors that produced head and body movement, and the system monitored and recorded physiological data from head and eye coils and triggered rewards to the animal based on programmed criteria. The custom software was written in LabView (National Instruments) and was composed of individually executable protocol modules. Each module contained the capacity to free up or passively rotate the head, to passively move the chair holding the monkey, or to create and manipulate visual targets. Each module also monitored the head and eye coils to determine eye, head, and gaze information. The module then made a decision based on the available data as to which module to call next. By changing global variables specific to each animal (e.g., target window size, time on target, number of rewards, reward duration, etc.), the sequence of the execution of protocols could be directed by the accurate performance of the animal. This also allowed for individualized training on the performance of protocols.
Training.
Initial training for each animal was head-controlled training of gaze to a 4-mm red target. Training was reinforced by a nutritionally appropriate liquid food reward containing 1.08 calories/ml developed in conjunction with the supervising veterinarian that contained fruit, Pediasure (Abbott Laboratories), fish oil, and uncaffeinated Power Gel (Nestle). The size of the reward window around the target and time on target required to evoke a reward were adjusted to make the task more difficult as it was learned. Once that task was learned, the head was freed to move in the horizontal plane, and animals easily learned to perform the same gaze task with the head free. The animal was then trained to follow a 7-mm green head-related target by using feedback to reinforce the desired head movement. With the use of a second smaller green target, visual feedback was provided about the current orientation of the head. When the head coil feedback target and head position target were aligned within the range of the target window, the animal was rewarded. The red gaze-related and green head-related target tasks were learned quickly. The animals were able to accurately pursue using either type of visually driven target in over 90% of the trials after 2 wk of postsurgical training.
Data collection.
Once the animals were well trained on the tasks, we began recording neural activity from the posterior insular cortex using ∼1 MOhm tungsten microelectrodes (Fredrick-Haer). The electrodes were introduced into the brain by means of a guide tube positioned in a grid system that spanned the cortical region of interest. Guide tubes were lowered only 1–2 mm into the brain to enable characterization of neurons encountered both within and around the PIVC region so that a more complete survey could be performed. The PIVC region was initially surveyed using stereotaxic coordinates, using vestibular sensitivity as a confirmatory characteristic as in previous studies (Akbarian et al. 1988; Grusser et al. 1990a, 1990b). This functional region is not well defined by anatomical boundaries but is defined by the presence of physiological responses to vestibular stimulation (Akbarian et al. 1988; Grusser et al. 1990b) and connectionally by projections to the vestibular nuclei (Guldin et al. 1993; Akbarian et al. 1994). The location of the electrode chamber allowed a brief survey of the surrounding cortical regions to better define the location of the PIVC during experimentation. The responses of the neighboring intraparietal cortex could be used to identify the insular cortex ventral to the intraparietal sulcus when surveying the anterior portions of the PIVC. In the caudal portions of the PIVC, some electrode tracts were continued through the white matter deep to the PIVC, and responses of the dorsal medial superior temporal cortex (MST) ventral to the PIVC could be noted using vestibular and visual stimulation (Shinder and Newlands 2005). The search stimulus during exploration of the PIVC included a set of stimulus protocols that included head-free, gaze-target-driven head-on-neck, trunk-under-head, and whole-body rotations (protocols 12, 13, and 14 in the active section of Table 1). Data were collected from cells that produced a neural response to some form of head or neck motion. This included responding to whole-body rotation, head-on-neck rotation, or trunk-under-head rotation either individually or in combination. The stimuli subsequently presented during the characterization of each cell focused on the stimulus modalities (head, neck, or target) that elicited responses. Given the mechanical disturbance of the various different motion stimuli, and the necessity of switching back and forth from active to passive movement, many neural recordings ended before completion of the full complement of available stimulus conditions. On the other hand, neurons were frequently held long enough that multiple trials were performed for many of the protocols.
Table 1.
Protocols used for testing PIVC neurons combined trunk, head-on-neck, and target angular rotations in the horizontal plane
| Condition | Chair Motor | Head Motor | Target in Space | Phase: Chair re Head | Phase: Chair re Target | Phase: Head re Target | Rotation Protocol |
|---|---|---|---|---|---|---|---|
| Head controlled (unimodal) | |||||||
| 1a | ±15°/s | 0°/s | NA | 0° | NA | NA | Passive whole body ±15°/s in dark |
| 1b | ±30°/s | 0°/s | NA | 0° | NA | NA | Passive whole body ±30°/s in dark |
| 2a | ±15°/s | ±15°/s | NA | 180° | NA | NA | Passive trunk under head ±15°/s in dark |
| 2b | ±30°/s | ±30°/s | NA | 180° | NA | NA | Passive trunk under head ±30°/s in dark |
| 3 | 0°/s | 0°/s | ±15°/s | NA | NA | NA | Gaze target only ±15°/s |
| Head controlled (multimodal) | |||||||
| 4a | ±15°/s | 0°/s | ±15°/s | NA | 0° | 0° | Passive whole body ±15°/s with target |
| 4b | ±30°/s | 0°/s | ±30°/s | NA | 0° | 0° | Passive whole body ±30°/s with target |
| 5a | ±15°/s | ±15°/s | 0°/s | 180° | NA | NA | Passive trunk under head ±15°/s with target |
| 5b | ±30°/s | ±30°/s | 0°/s | 180° | NA | NA | Passive trunk under head ±30°/s with target |
| 6a | 0°/s | ±15°/s | NA | NA | NA | NA | Passive head on neck ±15°/s in dark |
| 6b | 0°/s | ±30°/s | NA | NA | NA | NA | Passive head on neck ±30°/s in dark |
| 7a | 0°/s | ±15°/s | ±15°/s | NA | NA | 0° | Passive head on neck ±15°/s with target |
| 7b | 0°/s | ±30°/s | ±30°/s | NA | NA | 0° | Passive head on neck ±30°/s with target |
| 8 | ±15°/s | ±15°/s | ±30°/s | NA | 0° | 0° | Passive head with target ±30°/s, synergistic trunk ±15°/s |
| 9 | ±15°/s | ±30°/s | ±15°/s | NA | 180° | 0° | Passive head with target ±15°/s, opposed trunk ±15°/s |
| 10 | 0°/s | ±7.5°/s | ±15°/s | NA | NA | 0° | Passive head on neck ±15°/s with synergistic target ±30°/s |
| 11 | 0°/s | ±15°/s | ±7.5°/s | NA | NA | 180° | Passive head on neck ±15°/s with opposed target ±7.5°/s |
| Head free | |||||||
| 12a | ±15°/s | Gaze | ±15°/s | 0° | Trunk and gaze target aligned ±15°/s | ||
| 12b | ±30°/s | Gaze | ±30°/s | 0° | Trunk and gaze target aligned ±30°/s | ||
| 12c | ±15°/s | Head | ±15°/s | 0° | Trunk and head target aligned ±15°/s | ||
| 12d | ±30°/s | Head | ±30°/s | 0° | Trunk and head target aligned ±30°/s | ||
| 13a | ±15°/s | Gaze | 0°/s | NA | Trunk ±15°/s with gaze target stationary in space | ||
| 13b | ±30°/s | Gaze | 0°/s | NA | Trunk ±30°/s with gaze target stationary in space | ||
| 13c | ±15°/s | Head | 0°/s | NA | Trunk ±15°/s with head target stationary in space | ||
| 13d | ±30°/s | Head | 0°/s | NA | Trunk ±30°/s with head target stationary in space | ||
| 14a | 0°/s | Gaze | ±15°/s | NA | Trunk stationary with gaze target moving in space ±15°/s | ||
| 14b | 0°/s | Gaze | ±30°/s | NA | Trunk stationary with gaze target moving in space ±30°/s | ||
| 14c | 0°/s | Head | ±15°/s | NA | Trunk stationary with head target moving in space ±15°/s | ||
| 14d | 0°/s | Head | ±30°/s | NA | Trunk stationary with head target moving in space ±30°/s | ||
| 15a | ±15°/s | Gaze | ±30°/s | 0° | Synergistic trunk ±15°/s with gaze target ±30°/s | ||
| 15b | ±15°/s | Head | ±30°/s | 0° | Synergistic trunk ±15°/s with head target ±30°/s | ||
| 16a | ±15°/s | Gaze | ±15°/s | 180° | Opposed trunk ±15°/s with gaze target ±15°/s | ||
| 16b | ±15°/s | Head | ±15°/s | 180° | Opposed trunk ±15°/s with gaze target ±15°/s | ||
Rotations were performed with self-generated or motor-imposed head-on-neck rotations, but all trunk rotations were passive (driven by the chair motor). Two stimulus amplitudes were used, and stimuli could be presented in the dark, with a gaze (eye)-related target, or with head (head on neck)-related targets. PIVC, parieto-insular vestibular cortex.
During recording of each neuron, several channels of data were collected. The bandpass (100 Hz to 10,000 kHz)-filtered signal from the electrode was collected at 40 kHz. The horizontal and vertical eye and head position signals were collected from the three-dimensional field-coil system at 1 kHz. The eye and head position signals from the field-coil system were differentiated to produce eye and head velocity and subtracted to produce a signal of the eye movement relative to the head (from eye in space to eye in head). Similarly, all of the motor control signals, the head potentiometer signals, the position and velocity feedback signals from both the head and rotator motors, and the target position, size, and color signals were all collected at 1 kHz. The signal originating from the rotator motor represented the chair, trunk, or whole-body rotation. Target velocity was derived from the target position, and target type could be denoted by the target color.
Protocols.
The target, chair (trunk), and head rotation were coordinated to produce the motion stimuli used in this study. All of the protocols in these experiments were yaw sinusoids with the head positioned with the stereotaxic plane horizontal, at one frequency (0.2 Hz), and at one of two peak velocities (15 or 30°/s). All trunk rotations were passive, but head-on-neck rotations could be passive or active depending on the state of the clutch and the presence of the target. Several different types of motion stimuli combinations were used to characterize PIVC neurons. Head-controlled stimuli were performed by activating the clutch fixing the head to the head motor. Movements of the lower body were limited but not completely restricted by the chair. During head-controlled testing, three basic protocol stimuli were used, each stimulating only one of the sensory modalities studied in these experiments: passive whole-body rotation of the head and trunk in the dark at 15 or 30°/s (whole-body dark), trunk rotation under a stationary head in the dark 15 or 30°/s (trunk-only dark), and movement of a visual target at 15°/s (target only). The use of target motion for smooth pursuit was tested at 30°/s during training, but the monkeys did not consistently maintain accurate tracking of the target throughout the stimulus presentation on all trials. Therefore, to evaluate consistently accurate behavior, the 30°/s stimulus was not used during recordings. These protocols are categorized by movement of the chair motor, head motor, and target in Table 1 (protocols 1, 2, and 3, respectively).
A second set of protocols combined at least two stimuli (vestibular stimulation, neck stimulation, or a visual target) while the head was still restrained. These included four relatively simple protocols (numbers corresponding to Table 1): 4) passive whole-body rotation of the head and trunk at 15 or 30°/s with a gaze target that moved with the animal (whole-body with target), 5) trunk rotation at 15 or 30°/s under a stationary head with a head- and space-fixed gaze target straight ahead (trunk-only with target), 6) head-on-neck rotation above a stationary trunk in the dark at 15 or 30°/s (head-on-neck dark), and 7) head-on-neck rotation at 15 or 30°/s with a target that moved with the head (head-on-neck with target). There were two other conditions in which the gaze target was combined with chair rotations. The target and chair motion were either synergistic or opposing and at different speeds. Synergistic combinations of chair and target motion were performed by rotating the head 0.2 Hz at 15°/s over a trunk moving at 15°/s in synchrony while the target was moved across the screen in the same direction as the head at 0.2 Hz but at 30°/s (Table 1, protocol 8). During opposing combinations of target movement with chair-rotation tasks, the target and chair rotated in opposite directions at 0.2 Hz at 15°/s while the head moved on the trunk at 30°/s such that the head tracked the target (Table 1, protocol 9). Similar protocols were administered where the head was moved on the neck at 7.5°/s and a head target was moved synergistically (in phase) at 15°/s or in opposition at 7.5°/s (out of phase) with the head movement (protocols 10 and 11).
In addition to the unimodality and multimodality head-controlled protocols listed above, head-free (in the yaw plane) protocols were administered that matched five of the multimodality head-controlled protocols [the head-on-neck passively driven without a target, or with an in- or out-of-phase gaze target at 7.5°/s (protocols 6, 10, and 11) having no head-free analog]. During the active head movement testing protocols, two different targets were used. In one condition, the target required the animal to maintain gaze on the target to receive a reward (a red target). In another condition, the target required the animal to maintain their head position on the target to receive a reward (a green target was used; and a separate, smaller green target was used to represent real-time head position to help guide behavior). These protocols included (number corresponding to protocols listed in Table 1): 12) whole-body rotation of the trunk with a gaze or head target that moved with the animal (head-free whole-body rotation with a target referenced to the chair signal), 13) trunk (chair) rotation under an unrestrained head with a space-fixed gaze or head target straight ahead (head-free trunk rotation with spatially fixed target), 14) active head-on-neck rotation pursuing a gaze or head target (active head-on-neck with target), 15) synergistic gaze or head target and chair motion (target at 30°/s and chair at 15°/s), and 16) opposing gaze or head target and chair motion (both at ± 15°). For all five of these head-free protocols, the gaze target and eye target trials (each 6 cycles at 0.2 Hz) were always paired with a 3-s break between the gaze target (first) and the head target (second). The first three of the head-free protocols (whole-body rotation with a visual target aligned to the chair signal or fixed in space and pursuit of a gaze or head target with the trunk stationary) were performed at either 15 or 30°/s peak velocity. All of these protocols are summarized in Table 1. In most cases, particularly for the head-free protocols, the protocols were run on each neuron several times, often up to 30 min apart, to investigate the stability of these responses over time.
Data analysis.
Many elements of the data analysis have been described elsewhere (Newlands et al. 2009). In brief, the recorded neural signal was triggered offline using a combination of time-amplitude windows and spike-waveform-principle components to create a spike time stamp. Because many PIVC cells are slow firing, we used a Kaiser window filter (cutoff frequency 0.4 Hz, bandpass 5.0 Hz) to convert the time stamp from the spikes into a continuous function (Cherif et al. 2008), which was then compared with the digitized stimuli (eye position, head position, and chair-rotator position) to calculate the response sensitivity or gain (the peak-to-peak output of the neuron/peak-to-peak stimulus in spikes per second per degree per second) and phase (the relative timing of the peak of the response to the peak of the stimulus). Accurate fitting of the neural responses that rectified during rotation in one direction required that sensitivity and phase were computed using a nonlinear least-squares algorithm (Levenberg-Marquardt method, see Newlands et al. 2009). Gains were computed relative to horizontal head velocity during whole-body and head-on-neck rotations and to chair rotational velocity during trunk-only rotations. As mentioned above, individual trials were comprised of six cycles of continuous movement (30 s), which were repeated throughout the overall period during which the cell was recorded. The sensitivities and phases from each of the trials were averaged together to compute response sensitivity and phase of the cell for protocols that were administered more than once on a given cell. For all neurons, we determined whether the firing response was correlated with the stimulus by calculating the Rayleigh coefficient, a circular statistical measure of correlation between the stimulus and response that incorporates information about direction to eliminate the influence of repetitively moving through the same orientations during rotation. We used only data where the calculated Rayleigh coefficient was statistically significant at the P < 0.05 level (Mardia 1972). When activity was not found to be statistically significantly correlated with the stimulus, the neuron was considered unrelated to that stimulus.
Often, it was useful to compare the sum of the responses to individual stimuli with the response to a combined stimulus using those stimuli. To do this, the firing-rate responses to the individual stimuli had to be added together to form a prediction of the response to the combined stimulus. The gain and phase of the predicted stimulus either computed as the simple vector sum of the individual responses or the averaged response over the six recorded cycles for individual stimuli were combined to predict the resultant response. The actual response to combined stimulation was compared with the predicted response using a mean-error measure. All the calculations and statistics defined above were done using SPSS, Excel, or LabView.
Histology.
Current data were confirmed by histological evaluations of electrolytic lesions produced at the end of selected electrode tracts. The perfused brains were first dehydrated by soaking in 20% sucrose/4% paraformaldehyde solution for several weeks. The area of the insular cortex was cut in 50-μm sections. The electrolytic lesions and scarring from electrode tracks were located in the area of the insular cortex expected to contain PIVC.
RESULTS
We encountered 978 neurons in the PIVC region of the left hemisphere in two rhesus monkeys trained to maintain their gaze or head alignment on a visual target while their head and trunk were independently manipulated in the horizontal plane (474 from monkey 1 and 504 from monkey 2). The region of the posterior insula was fully explored (Fig. 2), but head-movement-sensitive neurons were only found in subscribed subregions similar to that found previously (Akbarian et al. 1988; Grusser et al. 1990a, 1990b). Of these, 222 (23%) responded to either passive (head restrained) or active (head free to move independently of the chair) horizontal head or neck rotation (117 from monkey 1 and 105 from monkey 2). Using head and trunk rotation, either passively or with the head unrestrained, for search and characterization methods, 74 PIVC neurons were recorded long enough for the presentation of a sufficient number of stimulus conditions to be adequately characterized (51 from monkey 1, and 23 from monkey 2). Thus 74 of the 222 cells responsive to some form of head movement were fully characterized (33.3%).
Fig. 2.

Location of recorded neurons on surface diagram of unfolded cortex. The recording locations in each of the 2 monkeys are presented in separate maps. The posterior insular cortex is displayed as if the lateral fissure had been opened up and flattened out. The gray regions represent gyri normally on the outer surface of the brain. The sulci (LF, lateral fissure; IPS, intraparietal; STS, superior temporal) and cortical regions (GI, granular insular; RI, retroinsular; AC, auditory; LIP, lateral intraparietal; MST, medial superior temporal; S2, secondary somatosensory; TP, temporoparietal; TPO, temporoparietal occipital; VIP, ventral intraparietal) are labeled separately. The 74 neurons recorded in the insular cortex and presented in subsequent analyses are denoted by circles. The neurons in the VIP and MST were presented previously (Shinder and Newlands 2005). Open circles, 1 cell found at that site; shaded circles, 2 to 5 cells found; solid circles, 6 or more cells. Squares have a similar fill and color scheme and represent motion-responsive neurons found in neighboring brain regions. These neurons are not analyzed here.
Recording sites.
The PIVC straddles the posterior border of the granular-insular cortex (physiology: Akbarian et al. 1988; Grusser et al. 1990a, Guldin et al. 1992; imaging: Bottini et al. 2001; Petit and Beauchamp 2003; stimulation: Kahane et al. 2003) but is best defined by physiological responses to vestibular stimulation (Akbarian et al. 1988; Grusser et al. 1990b). However, the dorso-caudal border of posterior insula can generally be used as an anatomical landmark to define the location of the PIVC (Eickhoff et al. 2006). That part of the posterior insula is a multimodal area representing both vestibular and proprioceptive stimuli (Akbarian et al. 1988; Grusser et al. 1990b; Downar et al. 2000; Bottini et al. 2001; Petit and Beauchamp 2003; Fasold et al. 2008; Mazzola et al. 2012; Ferre et al. 2012; zu Eulenburg et al. 2013). In this study, electrolytic lesions were confirmed in the caudal retroinsular cortex about 2 mm posterior to the interaural axis, about 18 mm lateral, and about 7 mm ventral from the surface of the brain. Guide tube scarring could be seen from just above the retroinsular cortex at 3 mm posterior of the interaural axis to 11 mm anterior to interaural above the granular insular cortex. Recorded cell locations overlapped the gray matter defined by the histology from the granular insular cortex to the retroinsular cortex. Exploration of the region produced neural recordings from neurons encountered in the electrode tract on the way to the insular cortex or in electrode tracts surrounding the insular cortex. In this way, neurons from the ventral intraparietal and medial superior temporal cortices were found. Before histological confirmation, these areas were defined by their stereotaxic location and confirmation of sulci locations by gray/white matter patterns elucidated by electrophysiological survey. The stereotaxic location of tracts that yielded the neurons presented in this study is shown in Fig. 2, which is an unfolded view of the insula (after Grusser et al. 1990a, Fig. 3). The following results describe the responses of those 74 neurons recorded from the left posterior insula in two monkeys. The left insula was selected for comparison to previous studies (Akbarian et al. 1988; Grusser et al. 1990a, 1990b). Because motion signals are similar in the insula across the hemispheres (Chen et al. 2010, 2011, 2013a), comparable results would be expected for neurons in the right posterior insula.
Fig. 3.

Traces from 1 neuron tested with the 11 conditions used with the head-controlled protocols. The condition numbers correspond to the conditions listed in Table 1. Egaze, eye in space velocity (with saccades removed); Hspace, head velocity in space. FR, spike raster and Kaiser Window filtered representation of the firing rate are both shown. Htrunk, head-on-neck rotator velocity. Trspace, trunk (chair rotator) velocity. Taspace, gaze target velocity in space.
Test-retest reliability.
In many neurons, we recorded stimuli that were repeated, from two to five times, often 10–30 min apart using the same stimulus parameters and combinations on the same neuron. Using shorter presentations and repeating them during the recording seemed to maintain the level of interest of the animals in the task, and both of the animals maintained high levels of on-task performance. Therefore, a stimulus was often presented, followed by different, intervening stimuli before the first stimulus was repeated again. This method of presenting multiple instances of the same stimulus allowed us to evaluate the stationarity of the response to stimuli of the PIVC neuron. As we discuss in presenting these results, the neurons we recorded were quite heterogeneous in their responses to our array of tasks. An important consideration is whether the array of responses described here are due to influences on neural responses that were not controlled and not appreciated such that the same neuron might respond differently at different times. Reliable test-retest responses indicate that the neural response differences represent heterogeneity in the neuron population.
To test the consistency of the responses of the neuron, we examined the test-retest consistency of all cells when the stimuli were presented more than once. From trial to trial, the gain and phase of any given stimulus did not vary [univariate ANOVA testing of the neural responses during all stimuli presentations that were repeated found no main effect for the order of the stimulus presentation; gain: F(1,945) = 0.20, P = 0.66; phase: F(1,945) = 0.03, P = 0.87; and no interaction effect of order by the type of stimulus presented]. Furthermore, the gain and phase from trial to trial was reliable [correlation of the first and second presentation of a stimulus (n = 473 stimulus pairs, 68 cells), gain: 0.72, phase: 0.95; Pearson correlation of first to third presentation (n = 117 stimulus pairs, 33 cells), gain = 0.75, phase = 0.97]. Therefore, the variability in the way in which stimuli combine was due to intrinsic sensory mechanisms and not poor reliability in the way in which stimuli were encoded.
Stimulus amplitude.
This study focused on the PIVC response to different modes of sensory stimulation and not on variations of identical stimuli. In the assessment of responses to changes in the strength of the stimulus, lower-velocity stimuli tended to produce higher gains. Higher gains were seen at lower velocities regardless of the visual, volitional, or stimulus context in which the rotation occurred (Table 2). The increased sensitivity could also be seen in the percentages of responsive cells, with larger percentages found at lower velocities. We have the largest volume of comparison data between the 15°/s and 30°/s velocities for the head-free protocols. Vestibular sensitivity decreased on average 0.17 ± 0.04 (standard error, S.E.) spikes per second per degree per second as the velocity increased from 15° (condition 12a) to 30°/s (condition 12b) (47 cells for which both velocities were available). Neck rotational sensitivity decreased 0.14 ± 0.03 spikes per second per degree per second (32 cells, conditions 13a vs. 13b), and head-on-neck sensitivity decreased by 0.17 ± 0.07 (30 cells, conditions 14a vs. 14b). As can be seen in Table 2, in all cases, sensitivity is higher at the lower velocity. Across all of the cells where stimuli were tested at both velocity amplitudes, the only significant effect on the sensitivity of the neuron was the stimulus amplitude [ANOVA of stimulus, rotation type, and target presence; the only significant effect was the main effect for stimulus amplitude: F(1,457) = 20.67, P = 7E-6]. There were no significant effects for the type of rotation, whole-body, head-on-neck, or trunk-under-head rotation, or whether the rotation was driven by the chair or a head or gaze-related target. Although there appeared to be increasing gains for decreasing vestibular and somatic stimulus amplitudes, responses to changes in the velocity of visual stimuli remain unknown, as target-only rotations were conducted at a single stimulus velocity.
Table 2.
The cell counts and sensitivities for the neurons tested under the experimental conditions outlined in Table 1
| Condition | N | Gain ± SE | Reference Stimulus | Rotation Protocol |
|---|---|---|---|---|
| 1a | 7 | 0.44 ± 0.10 | Chair velocity | Passive whole body ±15°/s in dark |
| 1b | 45 | 0.25 ± 0.04 | Chair velocity | Passive whole body ±30°/s in dark |
| 2a | 4 | 0.78 ± 0.25 | Chair velocity | Passive trunk under head ±15°/s in dark |
| 2b | 41 | 0.24 ± 0.04 | Chair velocity | Passive trunk under head ±30°/s in dark |
| 3 | 51 | 0.40 ± 0.05 | Target velocity | Gaze target only ±15°/s |
| 4a | 22 | 0.52 ± 0.14 | Chair and target velocity | Passive whole body ±15°/s with target |
| 4b | 51 | 0.26 ± 0.04 | Chair and target velocity | Passive whole body ±30°/s with target |
| 5a | 5 | 0.38 ± 0.17 | Chair velocity | Passive trunk under head ±15°/s with target |
| 5b | 48 | 0.24 ± 0.04 | Chair velocity | Passive trunk under head ±30°/s with target |
| 6a | 4 | 0.52 ± 0.19 | Head velocity | Passive head on neck ±15°/s in dark |
| 6b | 41 | 0.21 ± 0.03 | Head velocity | Passive head on neck ±30°/s in dark |
| 7a | 9 | 0.36 ± 0.06 | Head and target velocity | Passive head on neck ±15°/s with target |
| 7b | 50 | 0.25 ± 0.03 | Head and target velocity | Passive head on neck ±30°/s with target |
| 8 | 21 | 0.50 ± 0.09 | Chair velocity | Passive head with target ±30°/s, synergistic trunk ±15°/s |
| 9 | 21 | 0.48 ± 0.10 | Chair velocity | Passive head with target ±15°/s, opposed trunk ±15°/s |
| 10 | 11 | 0.66 ± 0.12 | Head velocity | Passive head on neck ±15°/s with synergistic target ±30°/s |
| 11 | 13 | 0.86 ± 0.16 | Head velocity | Passive head on neck ±15°/s with opposed target ±7.5°/s |
| 12a | 47 | 0.45 ± 0.06 | Chair and target velocity | Trunk and gaze target aligned ±15°/s |
| 12b | 65 | 0.28 ± 0.03 | Chair and target velocity | Trunk and gaze target aligned ±30°/s |
| 12c | 44 | 0.44 ± 0.07 | Chair and target velocity | Trunk and head target aligned ±15°/s |
| 12d | 59 | 0.27 ± 0.04 | Chair and target velocity | Trunk and head target aligned ±30°/s |
| 13a | 41 | 0.44 ± 0.07 | Chair velocity | Trunk ±15°/s with gaze target stationary in space |
| 13b | 53 | 0.25 ± 0.04 | Chair velocity | Trunk ±30°/s with gaze target stationary in space |
| 13c | 42 | 0.40 ± 0.06 | Chair velocity | Trunk ±15°/s with head target stationary in space |
| 13d | 56 | 0.22 ± 0.03 | Chair velocity | Trunk ±30°/s with head target stationary in space |
| 14a | 39 | 0.50 ± 0.07 | Head and target velocity | Trunk stationary with gaze target moving in space ±15°/s |
| 14b | 42 | 0.34 ± 0.03 | Head and target velocity | Trunk stationary with gaze target moving in space ±30°/s |
| 14c | 51 | 0.42 ± 0.05 | Head and target velocity | Trunk stationary with head target moving in space ±15°/s |
| 14d | 58 | 0.27 ± 0.02 | Head and target velocity | Trunk stationary with head target moving in space ±30°/s |
| 15a | 68 | 0.51 ± 0.04 | Chair velocity | Synergistic trunk ±15°/s with gaze target ±30°/s |
| 15b | 65 | 0.51 ± 0.05 | Chair velocity | Synergistic trunk ±15°/s with head target ±30°/s |
| 16a | 67 | 0.46 ± 0.05 | Chair velocity | Opposed trunk ±15°/s with gaze target ±15°/s |
| 16b | 63 | 0.48 ± 0.05 | Chair velocity | Opposed trunk ±15°/s with head target ±15°/s |
Monosensory sensitivity (vestibular, neck, or visual).
The simplest stimuli used were those that tested just one element independently: whole-body rotation in the dark (vestibular), trunk-only rotation with the head fixed in space (neck), and head-fixed stable visual target oscillation (visual). No cell was ever noted to respond to the static position of the head in the horizontal plane. Static positioning of the head relative to the trunk was not performed. Passive vestibular sensitivity was found in 49/61 (80%) of the cells tested. The neck-rotation test was performed by rotating the head on the neck at the same velocity in the opposite direction of simultaneous chair rotation. Because the head motor is mounted on the trunk motor platform, the head remains motionless in space as long as the head and trunk motor rotations are precisely matched in frequency and amplitude and 180° out of phase. The phase of the response is defined relative to chair velocity. Neck-rotational sensitivity was found in 44/58 (76%) cells tested. We found that 51/63 PIVC neurons tested displayed sensitivity to the visual target sinusoidally oscillated at 15°/s in the horizontal plane at eye level while the animal remained passively restrained and stationary. Although this represents 81% of the characterized cells, search criteria when screening neurons did not include sensitivity for pursuit of the gaze target. Therefore, cells that have visual sensitivity but no vestibular or neck sensitivity, if present in the PIVC, are unlikely to have been found. Thus all cells with visual target sensitivity that we recorded had a vestibular or neck response, whereas 82% of cells with vestibular (40/49) and 77% with neck sensitivity (34/44) also had visual pursuit sensitivity. The average gain for visual pursuit is higher than vestibular or neck sensitivity, but, because the velocity at which pursuit was conducted was 15°/s and most of the vestibular and neck sensitivity was tested at 30°/s, the difference in sensitivity might be related to the peak velocity. Neck sensitivity was not tested in the dark at this lower velocity, but vestibular stimuli at 15°/s were tested in some cases.
Figures 3 and 4 demonstrate the responses of two neurons for which complete head-controlled data (conditions 1–11) were collected. The neuron in Fig. 3 leads head velocity to the right and is in phase with trunk-under-head rotation to the right and visual target motion to the right. The neuron in Fig. 4 responds to head velocity to the left, trunk-under-head rotation to the right, and visual target motion to the right.
Fig. 4.

Traces from another neuron tested with the 11 conditions used with the head-controlled protocols. The condition numbers correspond to the conditions listed in Table 1. Labels as in Fig. 3.
As in previous studies, in the current experiments, no PIVC neuron was found that responded to spontaneous eye movements (Akbarian et al. 1988; Grusser et al. 1990a, 1990b; Chen et al. 2010; Liu et al. 2011). Ocular rotations were notable during whole-body rotation in the dark (conditions 1a, 1b), as this stimulus elicits a compensatory vestibulo-ocular reflex (VOR). The VOR eye movements were suppressed during whole-body rotations with a target that moved along with the body (conditions 4a, 4b). Six cells were tested at 15°/s in both conditions, and 37 were tested in both at 30°/s. Despite the majority of these cells having visual target sensitivity, there was no difference in the neural responses with or without a target during whole-body rotation, suggesting that the ocular movement does not significantly affect the firing rate of this population of neurons [a gain difference of 0.08 ± 0.09 spikes/s per °/s at 15°/s, and −0.03 ± 0.02 at 30°/s between conditions 1 and 4; ANOVA effect of rotation with and without a target F(2,85) = 0.57, P = 0.45].
What has not been shown previously is the response of the neurons to target movement when that visual stimulus is not large enough to elicit self-motion. Figure 5 is an example of a PIVC cell response during pursuit of a target where the monkey did not perform the task all of the time. As can be seen, the response of the neuron is related to the target movement, not the eye velocity. Thus we consider this a visual rather than an oculomotor stimulus.
Fig. 5.
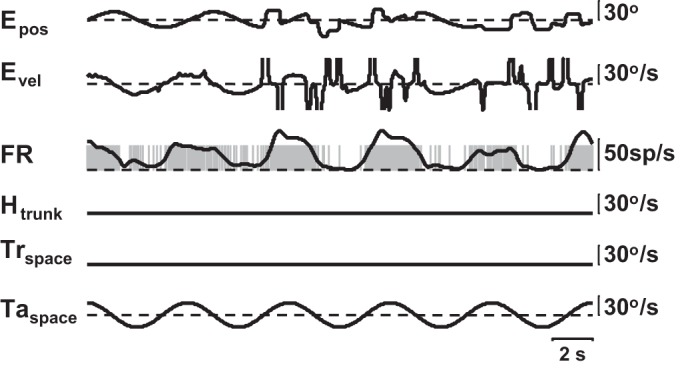
Response of parieto-insular vestibular cortex (PIVC) neuron to a target in an episode where behavior is poor. Epos, eye position. Evel, eye velocity (saccades not removed, but cutoff in the figure). Other labels are as in Fig. 3.
Figure 6A demonstrates the velocity sensitivity and phase of responses to monosensory stimuli for cells that were sensitive. These polar plots demonstrate the wide range of gains and phases noted for each of the stimuli in isolation. In many of these neurons, data were collected for two or three of the unimodal stimuli. Of the 56 cells tested for both head and neck sensitivity, 40 cells responded to both stimuli, 5 were vestibular, 4 were neck proprioceptive, 6 were sensitive only to visual target velocity, and 1 had weak vestibular and neck responses that were statistically significant only during active movement. There was no significant difference between vestibular and neck sensitivity [ANOVA of cells with both vestibular and neck responses; gain: F(1,79) = 0.17, P = 0.68]. Figure 6B demonstrates the gain and phase relationships comparing vestibular and neck (Fig. 6B, top), vestibular and visual (Fig. 6B, middle), and neck and visual (Fig. 6B, bottom) response for neurons that shared responses to the two stimuli. What this figure reveals is that there is no consistent relationship between vestibular, neck, and visual sensitivities at the single neuron level in the PIVC neurons studied. Although the standard index of the gain between vestibular, neck, and visual conditions indicated that the differences in the gains clustered around a relatively stable value (squares and triangles), the phase differences between conditions did not follow the pattern of the gain differences (bars). In some cases, the responses are in the same direction; in other cases, they are in opposite directions or they have an in-between phase relationship. Although not easily shown in a two-dimensional figure, most of these neurons were recorded under all three conditions, and no pattern of alignment of phases between the three sensory modalities was observed.
Fig. 6.

A: polar plots representing the gain (radius) and phase [relative to right head, trunk (neck twist), or target velocity] of the responses for responsive PIVC neurons to unisensory stimuli. B: histograms represent the relationship between head, neck, and visual head-controlled stimuli for neurons having sensitivity to at least 2 of the stimuli. The cells are aligned by standard index of gain. Symbols distinguish between conditions with 15°/s velocity and 30°/s velocity. Shaded bars represent phase differences at 30°/s and hashed bars 15°/s. Triangles represent the standard index of gain at 15°/s, and squares represent 30°/s. For condition 3, only 15°/s velocity was tested, symbol used is a circle. Standard index of gain for the three graphs are (gain of condition 1 - gain of condition 2)/(gain of condition 1 + gain of condition 2), (gain of condition 1 - gain of condition 3)/(gain of condition 1 + gain of condition 3), and (gain of condition 2 - gain of condition 3)/(gain of condition 2 + gain of condition 3). Phase differences are condition 1 phase re:trunk - condition 2 phase re:trunk, condition 1 phase re:trunk - condition 3 phase re:target, and condition 2 phase re:trunk - condition 3 phase re:target, respectively. The data from the example neuron in Fig. 3 are highlighted in red, and the data from the example neuron in Fig. 4 are highlighted in green.
Head-on-neck sensitivity in the dark.
Head-on-neck rotations produce both vestibular and neck stimulation. To test somatic-vestibular convergence, the response to the stimulus combination (condition 6) was compared with that expected from the combination of individually determined neck and vestibular sensitivities (determined in conditions 1 and 2). Thirty-three cells had response sensitivity to passive neck, vestibular, and head-on-neck stimuli in the dark. The observed mean vestibular and neck gains were 0.28 ± 0.06 and 0.29 ± 0.06, respectively; the observed head-on-neck gain was 0.22 ± 0.03. Figure 7A demonstrates one neuron where vestibular sensitivity is rotation to the left. This is the same neuron as in Fig. 4, but the figure is showing the averaged Kaiser window-filtered response. This cell also responds, under condition 2, to rotation of the trunk to the left with the head held still. The neuron displayed little sensitivity to head-on-neck rotation and appears to respond selectively to trunk rotation in space independent of the movement of the head. In contrast, the neuron in Fig. 3 responds to right whole-body motion (vestibular stimuli, condition 1) and rightward rotation of the trunk under head (condition 2). For the combined head-on-neck rotation in condition 6 as shown in Fig. 7B, this neuron responds as if dominantly coding the vestibular input. The other pattern seen with combination of vestibular and neck proprioception signals is shown in Fig. 7C, an example neuron that demonstrated a response dominated by neck input.
Fig. 7.

Examples of 3 neurons (A, B, and C) where the responses to vestibular, neck, and combined stimulation are compared. IFR, instantaneous firing rate. Top: averaged IFR over 5 cycles filtered with Kaiser Window. Bottom: spike raster, each dot represents 1 spike. The lowest panel in C applies to A and B as well; trunk velocity is black, and head velocity is gray. Left: trunk velocity and head velocity are the same. Middle: trunk is moving with the head held stationary. Right: for condition 6, there is no trunk movement; the head is moving, but the trunk is not.
When we looked cell by cell and used the criteria of the lowest error between the observed response and the predicted response, 9/33 cells were best described as canceling of the head and neck inputs, effectively best aligning with body in space; 13/33 cells were the most closely related to neck sensitivity, effectively coding the relative velocity of the body relative to the head; and 9/33 neurons were best described as coding vestibular sensitivity, effectively encoding head velocity in space. Two neurons were not better described by any of these individual parameters.
Effect of visual target on vestibular, neck, and head-on-neck sensitivity.
Also demonstrated in Fig. 3B and Table 1, there were three conditions with the target available that were equivalent to the three in the dark conditions, except for the presence of a target aligned with the head. We could compare responses of neurons to vestibular stimulation with and without a head-fixed target (condition 1 vs. condition 4), to neck stimulation with and without a head-fixed target (condition 2 vs. condition 5), and head and neck stimulation with and without a head-fixed target (condition 6 to condition 7). Similar to when we combined head movement and neck twist to find that these responses do not reliably combine across PIVC neurons to predict head-on-neck, when we add a visual target to passive whole-body rotation, the responses are not simple or consistent. In Fig. 3, the addition of the target to whole-body rotation (condition 4 compared with condition 1) has no effect on the response. In Fig. 4, the head and visual sensitivity are in opposite directions; when combined, the response is bimodal, one aspect of the response aligning with target velocity in space, and the other aligning with head velocity. It is notable that, for this neuron, the visual target movement sensitivity appears to be relative to space, not relative to the animal, as the animal and target are not moving relative to one another. Figure 8 demonstrates three additional neurons that combine visual and vestibular information differently. In all three of these cases; the vestibular and visual sensitivities are not in phase. In the first row, the visual target dominates the response (Fig. 8A). Again, the target is moving with the animal, so this is target in space that is evoking response. In the middle row, it is the vestibular signal that is dominant (Fig. 8B). In the last row, both signals are represented in the response to rotation with a target moving with the head (Fig. 8C). In total, 33 neurons were tested for whole-body rotation sensitivity (condition 1), visual target-alone condition (condition 3), and whole-body rotation with a target (condition 4). In 11 of these neurons, the difference in the phase of the response between conditions 1 and 3 was more than 90°. Of these 11, the response in condition 4 was closer (based on the lowest error between the observed response and the predicted response) to the condition 3 response (visual dominance) for six neurons, three showed vestibular dominance, and two showed a summation response.
Fig. 8.

Three examples of cells with the visual, vestibular, and combined sensitivity. Panels as in Fig. 7. Black line is visual stimulus, and dashed line is rotational stimulus.
Responses under condition 5 (trunk under head with target) did not vary much from those under condition 2 (in dark). Lastly, head-on-neck (condition 6) rotation was compared with head-on-neck rotation with target (condition 7). For cells where the responses to head-on-neck rotation in the dark and target in space were in the same direction, the combined response was consistently in the same direction. Such a response is seen in Fig. 3 (conditions 6 vs. 7). In Fig. 4, the dominant visual response overrides the weak head or neck response (conditions 6 vs. 7). For 28 neurons that responded to visual targets and head-on-neck movement and were tested in condition 7, eight of those neurons had a disparity between the phase relationships between the responses to head-on-neck rotation compared with target velocity of ≥90°. When looking at these examples carefully, in three cells, the response was closest to the visual response in space, in three, the response was closest to the head-on-neck velocity response, and, in two, there was a response that was not clearly aligned with or dominated by either the head or visual component.
Active or passive.
The effects of motor signals were tested in the PIVC by comparing the responses of neurons during passively applied and volitionally produced rotations of the neck. In all volitional head-movement protocols, the targets needed to be on to elicit the behavior. Thus there is no volitional protocol equivalent to a protocol in the dark or with trunk and head both fixed while following the target with gaze (conditions 1, 2, 3, and 6). For the equivalent of whole-body rotation with a head-fixed target (condition 4), condition 12 only requires the animal to hold his eyes and/or head aligned with his trunk. Conditions 13–16 all involve voluntary movement of the head relative to the trunk (keeping the head stationary in space during trunk rotation in condition 13, head-on-neck rotation in condition 14, and rotating the head with or against the direction of trunk rotation in conditions 15 and 16). For comparison, the responses of neurons during such volitional head-movement protocols would be readily compared with responses during similar passively produced conditions 5, 7, 8, and 9, in which a similar visual target was present. Examples of equivalent passive and volitional conditions for a single neuron are shown in Fig. 9. There was no significant difference between active and passive responses (paired t-test; comparisons of gain and phase, both peak velocities, P > 0.30 for all comparisons between conditions 4b to 12d, 5b to 13d, and 7b to 14d).
Fig. 9.

Example neuron recorded during active and passive rotations of the head. Labels as in Fig. 3. Conditions as in Table 1.
Velocity reference frames.
The response of PIVC neurons to visual-target tracking requires further examination to better understand what these responses represent. During the task in condition 3, the animal maintains its gaze on a moving target while its head and trunk are held still. As noted above, the response is not an ocular rotation signal. Instead, the responses of the PIVC neurons during visual-target tracking likely represent the target motion. However, the target is moving in space and relative to both the head and trunk. Our data allow us to investigate whether the target-velocity signal carried by the PIVC neurons represents target motion in space, target motion relative to the head or trunk, or a combination of these. If the response to the target is relative to the head or neck, the response should diminish when the target and head or body move together and reverse phase when the target movement relative to either the head or trunk flip, regardless of the target motion relative to the external environment.
Tasks were developed to more directly test whether visual sensitivity was referenced to the body of the animal as opposed to an external reference frame (target in space). The head was passively rotated and aligned with the target, but the trunk was either moving in the same direction as the head and target, at half the velocity (± 15°/s vs. ± 30°/s, condition 8), or the trunk was rotated in the opposite direction to the head and target (± 15°/s), such that the target movement of the trunk was ± 30°/s (condition 9). These protocols were compared with conditions where the target, head, and trunk all moved together (condition 4) and where the head and target moved over a stationary trunk (condition 7). Similar to these four head-controlled conditions, the reference frame was also examined under head-free conditions 12d, 14d, 15d, and 16d. The difference between these conditions (4, 7, 8, and 9, or 12d, 14d, 15d, and 16d) is only the relationship of the trunk to the head and target. If the responses of these conditions were similar, then the response to the target is not affected by the relationship of the body to the target and head. We used the variability of phase relationships between these conditions to inform us as to the likely reference frame that was coded by neuronal responses to target motions, be it relative to the trunk, head, or environment (target movement in space). For example, the neuron in Fig. 3 demonstrates the same response relative to the target and head velocities regardless of whether the trunk is moving with the head and target (condition 4), in the same direction as the head and target but at half the amplitude (condition 8), is not moving (condition 7), or is moving in the opposite direction (condition 9). Therefore, the example neuron in Fig. 3 does not represent target motion relative to the trunk but has target-rotation sensitivity (condition 3), indicating that the neural response represents target motion in space. Similarly, in Fig. 4, the majority of the response in all four conditions is in phase with head and target velocity (with target being matched by gaze velocity).
Figure 10 demonstrates how changing the velocity of the trunk and head relative to the target affects the phase of the neural response relative to the target velocity and thus the reference frame in which target velocity is coded. In Fig. 10A, passive conditions are considered. In Fig. 10A, the neurons are arranged in order of the variability of the phase relationship to the target across conditions. We averaged the phase of the responses in the four conditions and then calculated the variation of each condition from the average of all conditions (phase variation = phase under 1 condition, the average phase across conditions). Twenty-three neurons, for which at least three of the four conditions listed above were run, were arranged based on the phase variation of the neuron response relative to the target movement. For the first 10 of the 23 neurons, under all of the conditions tested, the phase with reference to the target was within 50° of the average for all the conditions. For these neurons, the responses were clearly not related to a trunk-centered reference.
Fig. 10.

A: comparison of phase of neuronal response re:target (and head) for 4 of the head-controlled stimuli. For the y-axis, 0° is the mean phase of the responses for that particular neuron across the 3 or 4 conditions tested. The neurons are arranged in order of ascending variance in the phase of the response. Those neurons to the left have very consistent response phases across the stimuli; those to the right have very inconsistent responses across the stimuli. B: as in A, except responses under head-free conditions are compared. C: for neurons that had consistent (within 50°) phase relationships across the conditions tested, the sensitivity of the neurons to conditions 4 and 7 (head controlled) and conditions 12 and 14 (head free) are compared. D: histograms comparing the proportion of pursuit of the target that is done with the head for the head-free task of target pursuit ± 30°/s while the trunk is stationary. Condition 14b (gaze target) is compared with condition 14d (head target). E: sensitivity of neurons during pursuit of a gaze target compared with during pursuit of an eye target. Neurons that are classified as target related based on their position in B are identified separately from the other cells.
The expected pattern for a neuron that was responsive to trunk movement in space under these conditions would be one where the phase of response with reference to target for conditions 4 and 8 were similar, the response to condition 7 was weaker, and the response to condition 9 was out of phase with conditions 4 and 8. There were five neurons that follow this pattern demonstrated in Fig. 10A: cells 14, 19, 20, 21, and 23.
Figure 10B was constructed as is Fig. 10A but considered instead the 70 neurons where at least three of the four analogous head-free conditions were tested (conditions 12, 15, 14, and 16). With the use of the same criteria as was used to categorize neurons for the head-controlled data to define which responses were best described as related to the target, the 51 neurons to the left-hand side of Fig. 10B all had phase relationships within 50° of one another and are considered target related. Only five neurons were noted that have the pattern expected for neurons responding to the velocity of the trunk in space (57, 62, 63, 67, and 69). Only one neuron that was described as a target-related head-controlled neuron was not also target related with the head free. Six of the eight neurons that were related to neither target nor trunk in space with head controlled fell into the target-related category with the monkey head free.
The distinction between whether the response to the target motion for the 10 neurons under head-controlled and the 51 under head-free conditions were trunk referenced or space referenced can be further examined by looking at the amplitude of the responses. In the evaluation of the possible trunk reference of neural responses, if the sensitivity to the target velocity was referenced to the trunk, one might expect a much weaker response to conditions 4 or 12 (where the trunk and target move together) than to conditions 7 or 14 (where the target is moving ±30° relative to the trunk and the trunk is stationary). Figure 10C plots the relationship for these 10 target-controlled neurons with the head fixed between conditions 4 and 7, and 51 target-based neurons were tested with the head free between conditions 12 and 14. For these neurons, which compose the majority of the cells we tested, the amplitude of the responses are indistinguishable between the conditions of the trunk being stationary or moving with the target, which is most consistent with coding of the velocity of the target in space, not relative to the trunk.
Manipulation of the target relationship to the head was not done as completely. Because our animals were not trained to move their head and eyes independently, the most direct data we have to investigate whether the target velocity-related signal is best coded relative to the head or in space are the head-controlled data. There are two lines of data that strongly support that target velocity is being coded as target in space, rather than relative to the head. The first is that for all of the neurons in Fig. 10, A and B, that appear to code target velocity; all of these responses occur with the target and head aligned. If head is referenced, there should be no target-related response. For the 10 neurons from Fig. 10A that appear to respond to target velocity in space, eight were tested with the head fixed while visually tracking a moving gaze target (condition 3). In all eight, the phase relationship was in this condition (3) within 31° of the average of the other four conditions (4, 7, 8, and 9). Another line of evidence is from eight neurons, all of which are in the group responding to target velocity either with the head controlled or head free, where we collected data with the head rotated on the neck either in phase with the target that moved faster than the head (condition 10), at the same speed as the head (condition 7), or in the opposite direction to the head (condition 11). As can be seen in Figs. 3 and 4, and is true for the other six neurons tested, the responses in all three of these conditions follow the target in space, regardless of the relationship of the target to the head.
Lastly, we compared the gain of responses of neurons in conditions 14b and 14d. In condition 14, the animal pursued the target that is sinusoidally oscillating in front of the animal. When following the gaze (eye) target, the head often moved slower than the target. When following the head target, the head moved with the target at the same speed when the animal was behaving properly. The head velocity as a percentage of the target velocity was compared between the two conditions in the histogram in Fig. 10D. There was a significant difference in head velocity between these conditions with gaze vs. head targets (paired t-test, P < 0.000001). If the neuron response was primarily target related, then the responses relative to the target velocity should have been similar regardless of how much of the pursuit was accomplished with the head or with the eyes moving relative to the head. If the response was primarily related to the relationship between head and target velocity, then the responses would differ between these conditions. Figure 10E compared the gains under these two conditions for 62 neurons with responses recorded under both conditions 14b and 14d. Of these, 43 were a subset of the 51 neurons that appeared related to target in space based on the analysis represented in Fig. 10B. The other 19 neurons were either in the body-in-space-related group based on the analysis in Fig. 10B (3 neurons), did not fit into either the body- or target-related groups (10 neurons), or did not have enough protocols run to be included in Fig. 10B (6 neurons). For the target-related and nontarget-related neurons, the response relative to the target velocity was not significantly impacted by whether a head target or gaze target was used. This finding supports the conclusion that the response of the PIVC neurons in this study did not respond differently based on the task, whether following the target with the head or with the eyes. These data are consistent with the suggestion that the majority of responses, especially those related to the visual target, are spatially referenced, rather than referenced to head or trunk velocity.
DISCUSSION
The data presented here show that single neurons in the posterior insula display sensitivity to both self-motion and object motion. These neurons are activated by combinations of head and trunk movements in the presence of a moving object. The patterns of signal combination ranged from equivalent summation to suppression of one signal type by another (Figs. 7 and 8). Heterogeneity in the responses suggests that the actual best stimuli for activation of these neurons were not included in our protocols. However, the combined activation found on PIVC neurons, along with the absence of motor or ocular information, is consistent with a perceptual function in which the posterior insula represents coordinated self-motion relative to the motion of objects in space.
Coding of volitional vs. imposed movement.
One important novel finding presented above is the equivalence of volitionally active and passively imposed motion in the posterior insula. The posterior insula was known to respond to the movements of the body, head, neck, trunk, limbs, hands, and feet (Robinson and Burton 1980; Friedman et al. 1986) before it was known to contain vestibular sensitivity (Akbarian et al. 1988). A role in active movement has also been suggested by the ataxia resulting from lesions of the posterior insula (Duffau et al. 2006; Liou et al. 2010). In the vestibular nuclei, many neurons have been reported that lack vestibular responses during active head movement (Cullen and Roy 2004). The proposed active/passive gating of the vestibular signal is efficacious in suppressing unintended vestibular reflexes such as cervical or oculomotor reflexes that would work against the goal of realignment of the head and eyes to fixate on an object of interest while actively tracking that object with head movements. Therefore, because the posterior insula projects directly to the medial, superior, and y-group vestibular nuclei (Akbarian et al. 1994), it was not unreasonable to speculate that the posterior insula could be the source of motor signals that contextually modulate vestibular responses during active vs. passive head rotations (Guldin and Grusser 1998).
Recent findings from brain imaging argue against such speculation and show that the posterior insula does not require active or even actual movement to be responsive but can be activated by the perception of movement (Kahane et al. 2003; Nowak et al. 2005; Karnath et al. 2005) and by imagined movements of the body (Jahn et al. 2004; Fasold et al. 2008; Deutschländer et al. 2009). Furthermore, self-motion perception can be induced without involving the posterior insula (physiology: Chen et al. 2010; imaging: Becker-Bense et al. 2012). Moreover, corticospinal projections from the posterior insula are to sensory, not motor, portions of the spinal cord (Galea and Darian-Smith 1994), and the posterior insula is not involved in motor planning or timing (Hoffstaedter et al. 2013).
As fundamental a principle as efference copy mechanisms are to monitoring reafference in the vestibular nuclei, there is also a perceptual role for efference in the vestibular system to keep accurate track of the relative velocities of the head, body, and objects in the environment, regardless of whether the self-motion is externally applied or internally generated. The equivalence of active and passive responding in the posterior insula supports a role in sensory perception, consistent with monitoring subjective states including movement. The descending corticofugal projections may therefore be related to sensory feedback for the sense of self-motion similar to that seen in other sensory modalities (Alitto and Usrey 2003). The loss of feedback and coordinated monitoring of self-motion and object motion also explains ataxia following lesions and its transience as the brain adjusts to rely more on direct sensory feedback rather than ongoing monitoring of the alignment between oneself and objects (Medendorp et al. 2008).
Visual signals in the posterior insula.
The other important and novel finding of this study was that discrete, moving, visual targets elicited a response in a majority of posterior insular neurons that also displayed some form of self-motion sensitivity. Given the collection of visual stimuli that have elicited activation of the posterior insula in previous studies, combining the current findings of visual sensitivity in the posterior insula is complicated. Information about moving visual targets may come from the interaction of the posterior insula with the smooth pursuit region of the frontal eye fields (Stanton et al. 2005) or visually related regions of the posterior mesial cortex (Cavada and Goldman-Rakic 1989; Morecraft and Van Hoesen 1998; Leichnetz 2001; Morecraft et al. 2004). However, visual information about self-motion does not come to the insula directly from visual motion sensitive temporal cortex, which may explain differences in posterior insular neuron responses to visual and somatic motion information, as the visual cortices providing object motion information are also the likely source of visual self-motion information, and the interaction of visual information sources may occur upstream of the posterior insula. In this study, we found the absence of neural responses to eye movements in the dark, which corroborates previous studies that found no ocular sensitivity in the PIVC. Our study is also consistent with previous studies indicating that fixating on a stationary target does not activate posterior insular neurons, as evidenced by the lack of effect of a stationary target on the response to trunk-under-head rotation (Akbarian et al. 1988; Grusser et al. 1990a; Chen et al. 2010). Therefore, posterior insular signals are unlikely to represent gaze-control signals. Visually, the movement of large, full-field displays that induce a perception of self-motion produce posterior insular activation (physiology: Akbarian et al. 1988; Grusser et al. 1990b; imaging: Kleinschmidt et al. 2002) unless a stationary fixation target is presented along with the large-field visual-motion stimulus (Chen et al. 2010). Interestingly, smaller visual stimuli that are generally larger than 10° but are not large enough to produce the subjective experience of self-motion have not been shown to activate the posterior insula in imaging studies (Brandt et al. 2002; Deutschländer et al. 2002; Bense et al. 2005; Dieterich et al. 2007; Cardin and Smith 2011). However, imaging studies have shown that single visual objects (Indovina et al. 2005; Nagel et al. 2006; Lindner et al. 2006) and coherent visual-field stimuli smaller than 10° (Dupont et al. 1994; Sunaert et al. 1999; Antal et al. 2008) produce activation in the posterior insula. If a visual stimulus can be defined as an object, or it induces the perception of self-motion, then that stimulus has the potential to activate the posterior insula. The current findings of neural responses to visual-target motion help connect the responses seen during the imaging studies above to the physiological responses of the posterior insula. Significantly, the mechanism behind how the posterior insula deals with the combination of visual stimuli can be seen in the unexpected finding of Chen et al. (2010). They presented a stimulus that combined a visual object along with a moving visual field that induced the perception of self-motion. However, the expected robust response to self-motion in the posterior insula was not found. Presuming, as above, that the posterior insula combines various forms of movement information about coordinated head and trunk motion relative to objects in the environment, then the presence of an attended, stationary object negates the utility of the visual self-motion signal to monitor movements of the object and oneself. This corroborates the human studies that show that the perception of self-motion could be induced without activating the posterior insula (Becker-Bense et al. 2012). Thus the visual signals important to the function of the posterior insula may be predicted to be the ones that are most significant to the monitoring of ongoing behavior and not necessarily the detection of self-related motion.
Vestibular signals in the posterior insula.
Vestibular information in the posterior insula originates from the vestibular-related thalamus (see Shinder and Taube 2010 for review). The subcortical origins of vestibular input can be used to explain the primacy of vestibular input in the posterior insula and also provide insight into its vestibular properties. The vestibular sensitivity, in particular the increasing gain with decreasing stimulus amplitude, is reflected in the ascending input to the insula (Marlinski and McCrea 2008a; Newlands et al. 2009).
We set out to understand more about the vestibular signal in the posterior insula by studying those cells at the neuronal level most responsive to yaw rotation. In doing so, we only investigated a subset of the cells that we isolated (about 1/4 had sensitivity to yaw head and/or neck movement). Previous studies found that 61% of PIVC neurons were vestibular (62/107 cells, Akbarian et al. 1988), and, of the vestibular-sensitive neurons, 59% were sensitive to yaw rotations in the horizontal plane as were used here (96/162, Grusser et al. 1990a, 1990b). Thus 36% of PIVC neurons would be predicted to be responsive in the current experiments based on those studies. However, the criteria required to designate a neuron as responsive was made more stringent in this study compared with the studies of Grusser et al. (1990a, 1990b). As opposed to using a 0.04 spikes/sec per °/sec lower limit to define neuronal sensitivity to a stimulus, the current study uses 0.1 spikes/s per °/s and statistically significant Rayleigh statistics. By comparison, Chen et al. (2010) found that, among vestibular-sensitive cells, which were the majority in the PIVC, yaw rotation sensitivity was relatively uncommon, seen in only 20% of PIVC cells. We believe that the current sampling of responsive neurons (23%) is in line with previous measures, adjusted for current methodologies.
In this study, vestibular signals differed in many ways compared with the vestibular nuclei and other subcortical areas. Yaw rotation signals in the vestibular nuclei lead velocity (Dickman and Angelaki 2004; Newlands et al. 2009). Our data show a distribution of response phases without clear preference for velocity or acceleration (Fig. 6A, top). Vestibular signals in the vestibular nuclei combine with oculomotor signals rather than visual signals (Baker and Berthoz 1974; King et al. 1976). Many vestibular responses in the vestibular nuclei, cerebellum, and ventro-posterior thalamus combined with neck proprioceptive signals in precise ways to code either head velocity in space or body velocity in space (Gdowski and McCrea 2000; Marlinski and McCrea 2008b, 2009; Brooks and Cullen 2009; Luan et al. 2013). Although some of the neurons reported here have signals consistent with coding body velocity in space, they are a small portion of the responses we found. Based on these differences, we speculate that the vestibular signals in the PIVC serve a different purpose than in other areas. Rather than being involved in response to movement, these signals may primarily be used as an index of movement in space to transform the perception for body and object movement from being self-referenced to being referenced to the environment. Evidence consistent with this hypothesis comes from human imaging studies that noted a role for the retroinsular cortex in monitoring the direction of gravity relative to object motion to anticipate gravitational acceleration of moving objects (Indovina et al. 2005). To monitor objects in space, signals that inform object position relative to the organism (visual signals) must combine with signals informing the organisms of the relationship of the environment (vestibular signals). Additionally, if the role of the region is to monitor the objects in the environment and/or relative to the head and body, then whether the head and body movements are self-directed or imposed is not relevant. Thus the characteristics of PIVC neurons are consistent with a role of the PIVC in monitoring objects in space and relative to the animal.
Multisensory integration.
We found that most of the “vestibular” neurons in the posterior insula also responded to neck and visual stimuli. Across a population of cells, the visual, vestibular, and neck proprioceptive signals did not combine with one another in consistent ways. Instead, we found examples where the responses to the various sensory inputs added together and cancelled one another out and other examples where one of the signals dominated the others. Our data reveal a complexity of signal processing in the posterior insula. The heterogeneity of the neuron responses contain the elements of a brain area that is involved in keeping track of self-movement and the relative movement of objects of interest.
The types of signals represented in the posterior insula related to self-motion and object motion are also found in other cortical regions (Shinder and Taube 2010). However, significant differences exist. The visual responses seen in the posterior insula are not characteristic of self-motion detection (Chen et al. 2010), as is found in the medial superior temporal cortex (Chen et al. 2013a), nor does the posterior insular response encode motor- and ocular-related information as is found in the ventral intraparietal cortex (Morris et al. 2012; Chen et al. 2013a, 2013b). Interestingly, the vestibular self-motion in the posterior insula is represented as a combination of motion in space (world referenced) and motion relative to the body (body referenced; Chen et al. 2013a). This corroborates current findings and suggests that the posterior insula bridges world- and body-related movement information. In contrast, the MST neurons show reference frames that are head or eye centered but not world referenced (Chen et al. 2013a).
The proposed role of the posterior insula in monitoring coordinated self-motion and object motion has implications that reach beyond that of an interaction of vestibular sensation with body movement (Lopez et al. 2012b; Ferre et al. 2012). Imaging studies have suggested that the posterior insula is related to function of monitoring subjective states, including pain perception (Mazzola et al. 2012; Longo et al. 2012; Aziz-Zadeh et al. 2012). The monitoring of movement as a subjective state indicates that movement is not referenced to a singular metric of motion (Chen et al. 2010; Becker-Bense et al. 2012) but enables self-motion and object motion to be afforded multiple qualities. The posterior insula appears able to bridge information it receives from vestibular, visual, and proprioceptive systems and create joint representations of body and body-effector motion with object motion. The data presented here demonstrate properties of PIVC neurons hereto unknown. Understanding mechanisms of how this sensory convergence in the posterior insula informs perception of self-motion and object motion awaits additional studies.
GRANTS
This work was supported by the National Institute on Deafness and Other Communication Disorders (R01DC0006429 and F31DC 007583).
DISCLOSURES
No conflicts of interest, financial or otherwise, are declared by the authors.
AUTHOR CONTRIBUTIONS
Author contributions: M.E.S. conception and design of research; M.E.S. performed experiments; M.E.S. and S.D.N. analyzed data; M.E.S. and S.D.N. interpreted results of experiments; M.E.S. and S.D.N. prepared figures; M.E.S. and S.D.N. drafted manuscript; M.E.S. and S.D.N. edited and revised manuscript; M.E.S. and S.D.N. approved final version of manuscript.
ACKNOWLEDGMENTS
The authors acknowledge Dr. Min Wei's creation of the figures in this manuscript, for which permission has been received.
Current affiliations for the authors are as follows: M. Shinder: Dept. of Neuroscience, Baylor College of Medicine, One Baylor Plaza, BCM 295, Houston, TX 77030. S. Newlands, Dept. of Otolaryngology, University of Rochester Medical Center, 601 Elmwood Ave., Rochester, NY 14642.
REFERENCES
- Abreu AM, Macaluso E, Azevedo RT, Cesari P, Urgesi C, Aglioti SM. Action anticipation beyond the action observation network: a functional magnetic resonance imaging study in expert basketball players. Eur J Neurosci 35: 1646–1654, 2012 [DOI] [PubMed] [Google Scholar]
- Akbarian S, Berndl K, Grusser OJ, Guldin W, Pause M, Schreiter U. Responses of single neurons in the parietoinsular vestibular cortex of primates. Ann NY Acad Sci 545: 187–202, 1988 [DOI] [PubMed] [Google Scholar]
- Akbarian S, Grusser OJ, Guldin WO. Corticofugal connections between the cerebral cortex and brainstem vestibular nuclei in the Macaque monkey. J Comp Neurol 339: 421–437, 1994 [DOI] [PubMed] [Google Scholar]
- Alitto HJ, Usrey WM. Corticothalamic feedback and sensory processing. Curr Opin Neurobiol 13: 440–445, 2003 [DOI] [PubMed] [Google Scholar]
- Antal A, Baudewig J, Paulus W, Dechent P. The posterior cingulate cortex and planum temporale/parietal operculum are activated by coherent visual motion. Vis Neurosci 25: 17–26, 2008 [DOI] [PubMed] [Google Scholar]
- Arzy S, Thut G, Mohr C, Michel CM, Blanke O. Neural basis of embodiment: distinct contributions of temporoparietal junction and extrastriate body area. J Neurosci 26: 8074–8081, 2006 [DOI] [PMC free article] [PubMed] [Google Scholar]
- Asahi T, Uwano T, Eifuku S, Tamura R, Endo S, Ono T, Nishijo H. Neuronal responses to a delayed-response delayed-reward go/nogo task in the monkey posterior insular cortex. Neuroscience 143: 627–639, 2006 [DOI] [PubMed] [Google Scholar]
- Aziz-Zadeh L, Sheng T, Liew SL, Damasio H. Understanding otherness: the neural bases of action comprehension and pain empathy in a congenital amputee. Cereb Cortex 22: 811–819, 2012 [DOI] [PMC free article] [PubMed] [Google Scholar]
- Baier B, Conrad J, Zu Eulenburg P, Best C, Müller-Forell W, Birklein F, Dieterich M. Insular strokes cause no vestibular deficits. Stroke 44: 2604–2606, 2013 [DOI] [PubMed] [Google Scholar]
- Baker R, Berthoz A. Organization of vestibular nystagmus in oblique oculomotor system. J Neurophysiol 37: 195–217, 1974 [DOI] [PubMed] [Google Scholar]
- Becker-Bense S, Buchholz HG, zu Eulenburg P, Best C, Bartenstein P, Schreckenberger M, Dieterich M. Ventral and dorsal streams processing visual motion perception (FDG-PET study). BMC Neurosci 13: 81, 2012 [DOI] [PMC free article] [PubMed] [Google Scholar]
- Bense S, Stephan T, Bartenstein P, Schwaiger M, Brandt T, Dieterich M. Fixation suppression of optokinetic nystagmus modulates cortical visual-vestibular interaction. Neuroreport 16: 887–890, 2005 [DOI] [PubMed] [Google Scholar]
- Bottini G, Karnath HO, Vallar G, Sterzi R, Frith CD, Frackowiak RS, Paulesu E. Cerebral representations for egocentric space: Functional-anatomical evidence from caloric vestibular stimulation and neck vibration. Brain 124: 1182–1196, 2001 [DOI] [PubMed] [Google Scholar]
- Brandt T, Glasauer S, Stephan T, Bense S, Yousry TA, Deutschlander A, Dieterich M. Visual-vestibular and visuovisual cortical interaction. Ann NY Acad Sci 956: 230–241, 2002 [DOI] [PubMed] [Google Scholar]
- Brooks JX, Cullen KE. Multimodal integration in rostral fastigial nucleus provides an estimate of body movement. J Neurosci 29: 10499–10511, 2009 [DOI] [PMC free article] [PubMed] [Google Scholar]
- Cardin V, Smith AT. Sensitivity of human visual cortical area V6 to stereoscopic depth gradients associated with self-motion. J Neurophysiol 106: 1240–1249, 2011 [DOI] [PMC free article] [PubMed] [Google Scholar]
- Cavada C, Goldman-Rakic PS. Posterior parietal cortex in rhesus monkey. I. Parcellation of areas based on distinctive limbic and sensory corticocortical connections. J Comp Neurol 287: 393–421, 1989 [DOI] [PubMed] [Google Scholar]
- Cereda C, Ghika J, Maeder P, Bogousslavsky J. Strokes restricted to the insular cortex. Neurology 59: 1950–1955, 2002 [DOI] [PubMed] [Google Scholar]
- Chen A, DeAngelis GC, Angelaki DE. Macaque parieto-insular vestibular cortex: responses to self-motion and optic flow. J Neurosci 30: 3022–3042, 2010 [DOI] [PMC free article] [PubMed] [Google Scholar]
- Chen A, DeAngelis GC, Angelaki DE. A comparison of vestibular spatiotemporal tuning in macaque parietoinsular vestibular cortex, ventral intraparietal area, and medial superior temporal area. J Neurosci 31: 3082–3094, 2011 [DOI] [PMC free article] [PubMed] [Google Scholar]
- Chen X, Deangelis GC, Angelaki DE. Diverse spatial reference frames of vestibular signals in parietal cortex. Neuron 80: 1310–1321, 2013a [DOI] [PMC free article] [PubMed] [Google Scholar]
- Chen X, Deangelis GC, Angelaki DE. Eye-centered representation of optic flow tuning in the ventral intraparietal area. J Neurosci 33: 18574–18582, 2013b [DOI] [PMC free article] [PubMed] [Google Scholar]
- Cherif S, Cullen KE, Galiana HL. An improved method for the estimation of firing rate dynamics using an optimal digital filter. J Neurosci Methods 173: 165–181, 2008 [DOI] [PubMed] [Google Scholar]
- Cullen KE, Roy JE. Signal processing in the vestibular system during active versus passive head movements. J Neurophysiol 91: 1919–1933, 2004 [DOI] [PubMed] [Google Scholar]
- Deutschländer A, Bense S, Stephan T, Schwaiger M, Brandt T, Dieterich M. Sensory system interactions during simultaneous vestibular and visual stimulation in PET. Hum Brain Mapp 16: 92–103, 2002 [DOI] [PMC free article] [PubMed] [Google Scholar]
- Deutschländer A, Stephan T, Hüfner K, Wagner J, Wiesmann M, Strupp M, Brandt T, Jahn K. Imagined locomotion in the blind: an fMRI study. Neuroimage 45: 122–128, 2009 [DOI] [PubMed] [Google Scholar]
- Dickman JD, Angelaki DE. Dynamics of vestibular neurons during rotational motion in alert rhesus monkeys. Exp Brain Res 155: 91–101, 2004 [DOI] [PubMed] [Google Scholar]
- Dieterich M, Bauermann T, Best C, Stoeter P, Schlindwein P. Evidence for cortical visual substitution of chronic bilateral vestibular failure (an fMRI study). Brain 130: 2108–2116, 2007 [DOI] [PubMed] [Google Scholar]
- Downar J, Crawley AP, Mikulis DJ, Davis KD. A multimodal cortical network for the detection of changes in the sensory environment. Nat Neurosci 3: 277–283, 2000 [DOI] [PubMed] [Google Scholar]
- Duffau H, Taillandier L, Gatignol P, Capelle L. The insular lobe and brain plasticity: lessons from tumor surgery. Clin Neurol Neurosurg 108: 543–548, 2006 [DOI] [PubMed] [Google Scholar]
- Dupont P, Orban GA, De Bruyn B, Verbruggen A, Mortelmans L. Many areas in the human brain respond to visual motion. J Neurophysiol 72: 1420–1424, 1994 [DOI] [PubMed] [Google Scholar]
- Eickhoff SB, Weiss PH, Amunts K, Fink GR, Zilles K. Identifying human parieto-insular vestibular cortex using fMRI and cytoarchitectonic mapping. Hum Brain Mapp 27: 611–621, 2006 [DOI] [PMC free article] [PubMed] [Google Scholar]
- Fasold O, Heinau J, Trenner MU, Villringer A, Wenzel R. Proprioceptive head posture-related processing in human polysensory cortical areas. Neuroimage 40: 1232–1242, 2008 [DOI] [PubMed] [Google Scholar]
- Ferre ER, Bottini G, Haggard P. Vestibular inputs modulate somatosensory cortical processing. Brain Struct Funct 217: 859–864, 2012 [DOI] [PubMed] [Google Scholar]
- Friedman DP, Jones EG, Burton H. Representation pattern in the second somatic sensory area of the monkey cerebral cortex. J Comp Neurol 192: 21–41, 1980 [DOI] [PubMed] [Google Scholar]
- Friedman DP, Murray EA, O'Neill JB, Mishkin M. Cortical connections of the somatosensory fields of the lateral sulcus of Macaques: evidence for a corticolimbic pathway for touch. J Comp Neurol 252: 323–347, 1986 [DOI] [PubMed] [Google Scholar]
- Galea MP, Darian-Smith I. Multiple corticospinal neuron populations in the Macaque monkey are specified by their unique cortical origins, spinal terminations, and connections. Cereb Cortex 4: 166–194, 1994 [DOI] [PubMed] [Google Scholar]
- Gdowski GT, McCrea RA. Neck proprioceptive inputs to primate vestibular nucleus neurons. Exp Brain Res 135: 511–526, 2000 [DOI] [PubMed] [Google Scholar]
- Grusser OJ, Pause M, Schreiter U. Localization and responses of neurons in the parieto-insular vestibular cortex of awake monkeys (Macaca fascicularis). J Physiol 430: 537–557, 1990a [DOI] [PMC free article] [PubMed] [Google Scholar]
- Grusser OJ, Pause M, Schreiter U. Vestibular neurones in the parieto-insular cortex of monkeys (Macaca fascicularis): visual and neck receptor responses. J Physiol 430: 559–583, 1990b [DOI] [PMC free article] [PubMed] [Google Scholar]
- Guldin WO, Akbarian S, Grusser OJ. Cortico-cortical connections and cytoarchitectonics of the primate vestibular cortex: a study in squirrel monkeys (Saimiri sciureus). J Comp Neurol 326: 375–401, 1992 [DOI] [PubMed] [Google Scholar]
- Guldin WO, Grusser OJ. Is there a vestibular cortex? Trends Neurosci 21: 254–259, 1998 [DOI] [PubMed] [Google Scholar]
- Guldin WO, Mirring S, Grusser OJ. (1993) Connections from the neocortex to the vestibular brain stem nuclei in the common marmoset. Neuroreport 5: 113–116, 1993 [DOI] [PubMed] [Google Scholar]
- Hoffstaedter F, Grefkes C, Zilles K, Eickhoff SB. The “What” and “When” of self-initiated movements. Cereb Cortex 23: 520–530, 2013 [DOI] [PMC free article] [PubMed] [Google Scholar]
- Indovina I, Maffei V, Bosco G, Zago M, Macaluso E, Lacquaniti F. Representation of visual gravitational motion in the human vestibular cortex. Science 308: 416–419, 2005 [DOI] [PubMed] [Google Scholar]
- Jahn K, Deutschlander A, Stephan T, Strupp M, Wiesmann M, Brandt T. Brain activation patterns during imagined stance and locomotion in functional magnetic resonance imaging. Neuroimage 22: 1722–1731, 2004 [DOI] [PubMed] [Google Scholar]
- Kahane P, Hoffmann D, Minotti L, Berthoz A. Reappraisal of the human vestibular cortex by cortical electrical stimulation study. Ann Neurol 54: 615–624, 2003 [DOI] [PubMed] [Google Scholar]
- Karnath HO, Baier B. Right insula for our sense of limb ownership and self-awareness of actions. Brain Struct Funct 214: 411–417, 2010 [DOI] [PubMed] [Google Scholar]
- Karnath HO, Baier B, Nagele T. Awareness of the functioning of one's own limbs mediated by the insular cortex? J Neurosci 25: 7124–7138, 2005 [DOI] [PMC free article] [PubMed] [Google Scholar]
- King WM, Lisberger SG, Fuchs AF. Responses of fibers in medial longitudinal fasciculus (MLF) of alert monkeys during horizontal and vertical conjugate eye movements evoked by vestibular or visual stimuli. J Neurophysiol 39: 1135–1149, 1976 [DOI] [PubMed] [Google Scholar]
- Kleinschmidt A, Thilo KV, Büchel C, Gresty MA, Bronstein AM, Frackowiak RS. Neural correlates of visual-motion perception as object- or self-motion. Neuroimage 16: 873–882, 2002 [DOI] [PubMed] [Google Scholar]
- Leichnetz GR. Connections of the medial posterior parietal cortex (area 7m) in the monkey. Anat Rec 263: 215–236, 2001 [DOI] [PubMed] [Google Scholar]
- Lindner A, Haarmeier T, Erb M, Grodd W, Thier P. Cerebrocerebellar circuits for the perceptual cancellation of eye-movement-induced retinal image motion. J Cogn Neurosci 18: 1899–1912, 2006 [DOI] [PubMed] [Google Scholar]
- Liou LM, Guo YC, Lai CL, Tsai CL, Khor GT. Isolated ataxia after pure left insular cortex infarction. Neurol Sci 31: 89–91, 2010 [DOI] [PubMed] [Google Scholar]
- Liu S, Dickman JD, Angelaki DE. Response dynamics and tilt versus translation discrimination in parietoinsular vestibular cortex. Cereb Cortex 21: 563–573, 2011 [DOI] [PMC free article] [PubMed] [Google Scholar]
- Longo MR, Iannetti GD, Mancini F, Driver J, Haggard P. Linking pain and the body: Neural correlates of visually induced analgesia. J Neurosci 32: 2601–2607, 2012 [DOI] [PMC free article] [PubMed] [Google Scholar]
- Lopez C, Blanke O, Mast FW. The human vestibular cortex revealed by coordinate-based activation likelihood estimation meta-analysis. Neuroscience 212: 159–179, 2012a [DOI] [PubMed] [Google Scholar]
- Lopez C, Schreyer HM, Preuss N, Mast FM. Vestibular stimulation modifies the body schema. Neuropsychologia 50: 1830–1837, 2012b [DOI] [PubMed] [Google Scholar]
- Lotsch J, Walter C, Felden L, Noth U, Deichmann R, Oertel BG. The human operculo-insular cortex is pain-preferentially but not pain-exclusively activated by trigeminal and olfactory stimuli. PLoS One 7: e34798, 2012 [DOI] [PMC free article] [PubMed] [Google Scholar]
- Luan H, Gdowski MJ, Newlands SD, Gdowski GT. Convergence of vestibular and neck proprioceptive sensory signals in the cerebellar interpositus. J Neurosci 33: 1198–1210, 2013 [DOI] [PMC free article] [PubMed] [Google Scholar]
- Luks TL, Simpson GV. Preparatory deployment of attention to motion activates higher-order motion-processing brain regions. Neuroimage 22: 1515–1522, 2004 [DOI] [PubMed] [Google Scholar]
- Macey PM, Wu P, Kumar R, Ogren JA, Richardson HL, Woo MA, Harper RM. Differential responses of the insular cortex gyri to autonomic challenges. Auton Neurosci 168: 72–81, 2012 [DOI] [PMC free article] [PubMed] [Google Scholar]
- Mardia KV. Statistics of Directional Data. New York: New York Academic, 1972, pp. 133–135 [Google Scholar]
- Marlinski V, McCrea RA. Activity of ventroposterior thalamus neurons during rotation and translation in the horizontal plane in the alert squirrel monkey. J Neurophysiol 99: 2533–2545, 2008a [DOI] [PubMed] [Google Scholar]
- Marlinski V, McCrea RA. Coding of self-motion signals in ventro-posterior thalamus neurons in the alert squirrel monkey. Exp Brain Res 189: 463–472, 2008b [DOI] [PubMed] [Google Scholar]
- Marlinski V, McCrea RA. Self-motion signals in vestibular nuclei neurons projecting to the thalamus in the alert squirrel monkey. J Neurophysiol 101: 1730–1741, 2009 [DOI] [PMC free article] [PubMed] [Google Scholar]
- Mazzola L, Faillenot I, Barral FG, Mauguière F, Peyron R. Spatial segregation of somato-sensory and pain activations in the human operculo-insular cortex. Neuroimage 60: 409–418, 2012 [DOI] [PubMed] [Google Scholar]
- Medendorp WP, Beurze SM, Van Pelt S, Van Der Werf J. Behavioral and cortical mechanisms for spatial coding and action planning. Cortex 44: 587–597, 2008 [DOI] [PubMed] [Google Scholar]
- Morecraft RJ, Cipolloni PB, Stilwell-Morecraft KS, Gedney MT, Pandya DN. Cytoarchitecture and cortical connections of the posterior cingulated and adjacent somatosensory fields in the rhesus monkey. J Comp Neurol 469: 37–69, 2004 [DOI] [PubMed] [Google Scholar]
- Morecraft RJ, Van Hoesen GW. Convergence of limbic input to the cingulated motor cortex in the rhesus monkey. Brain Res Bull 45: 209–232, 1998 [DOI] [PubMed] [Google Scholar]
- Morris AP, Kubischik M, Hoffmann KP, Krekelberg B, Bremmer F. Dynamics of eye-position signals in the dorsal visual system. Curr Biol 22: 173–179, 2012 [DOI] [PMC free article] [PubMed] [Google Scholar]
- Nagel M, Sprenger A, Zapf S, Erdmann C, Kompf D, Heide W, Binkofski F, Lencer R. Parametric modulation of cortical activation during smooth pursuit with and without target blanking. An fMRI study. Neuroimage 29: 1319–1325, 2006 [DOI] [PubMed] [Google Scholar]
- Newlands SD, Lin N, Wei M. Response linearity of alert monkey non-eye movement vestibular nucleus neurons during sinusoidal yaw rotation. J Neurophysiol 102: 1388–1397, 2009 [DOI] [PMC free article] [PubMed] [Google Scholar]
- Nowak M, Holm S, Biering-Sorensen F, Secher NH, Friberg L. “Central command” and insular activation during attempted foot lifting in paraplegic humans. Hum Brain Mapp 25: 259–265, 2005 [DOI] [PMC free article] [PubMed] [Google Scholar]
- Penfield W, Boldrey E. Somatic motor and sensory representation in the cerebral cortex of man as studied by electrical stimulation. Brain 60: 389–443, 1937 [Google Scholar]
- Petit L, Beauchamp MS. Neural basis of visually guided head movements studied with fMRI. J Neurophysiol 89: 2516–2527, 2003 [DOI] [PubMed] [Google Scholar]
- Robinson CJ, Burton H. Organization of somatosensory receptive fields in cortical areas 7b, retroinsula, postauditory and granular insula of M. fascicularis. J Comp Neurol 192: 69–92, 1980 [DOI] [PubMed] [Google Scholar]
- Shinder ME, Newlands SD. Vestibular responses of neurons in retroinsular and ventral intraparietal cortices of the rhesus monkey during active and passive head movements. Soc Neurosci Abstr 392: 8, 2005 [Google Scholar]
- Shinder ME, Taube JS. Differentiating ascending vestibular pathways to the cortex involved in spatial cognition. J Vestib Res 20: 3–23, 2010 [DOI] [PubMed] [Google Scholar]
- Simmons WK, Avery JA, Barcalow JC, Bodurka J, Drevets WC, Bellgowan P. Keeping the body in mind: Insula functional organization and functional connectivity integrate interoceptive, exteroceptive, and emotional awareness. Hum Brain Mapp 34: 2944–2958, 2013 [DOI] [PMC free article] [PubMed] [Google Scholar]
- Stanton GB, Friedman HR, Dias EC, Bruce CJ. Cortical afferents to the smooth-pursuit region of the macaque monkey's frontal eye field. Exp Brain Res 165: 179–192, 2005 [DOI] [PubMed] [Google Scholar]
- Sunaert S, Van Hecke P, Marchal G, Orban GA. Motion-responsive regions of the human brain. Exp Brain Res 127: 355–370, 1999 [DOI] [PubMed] [Google Scholar]
- zu Eulenburg P, Baumgärtner U, Treede RD, Dieterich M. Interoceptive and multimodal functions of the operculo-insular cortex: Tactile, nociceptive and vestibular representations. Neuroimage 83C: 75–86, 2013 [DOI] [PubMed] [Google Scholar]