Abstract
The survival of Mycobacterium avium subsp. paratuberculosis was studied by culture of fecal material sampled at intervals for up to 117 weeks from soil and grass in pasture plots and boxes. Survival for up to 55 weeks was observed in a dry fully shaded environment, with much shorter survival times in unshaded locations. Moisture and application of lime to soil did not affect survival. UV radiation was an unlikely factor, but infrared wavelengths leading to diurnal temperature flux may be the significant detrimental component that is correlated with lack of shade. The organism survived for up to 24 weeks on grass that germinated through infected fecal material applied to the soil surface in completely shaded boxes and for up to 9 weeks on grass in 70% shade. The observed patterns of recovery in three of four experiments and changes in viable counts were indicative of dormancy, a hitherto unreported property of this taxon. A dps-like genetic element and relA, which are involved in dormancy responses in other mycobacteria, are present in the M. avium subsp. paratuberculosis genome sequence, providing indirect evidence for the existence of physiological mechanisms enabling dormancy. However, survival of M. avium subsp. paratuberculosis in the environment is finite, consistent with its taxonomic description as an obligate parasite of animals.
Paratuberculosis, or Johne's disease, occurs worldwide and is a chronic, enteric infection of animals caused by Mycobacterium avium subsp. paratuberculosis. It is transmitted insidiously from adults to juveniles mainly by the fecal-oral route, and grazing animals are most commonly affected. The organism can cause significant mortality rates when large doses are acquired by young animals. The infection is difficult and expensive to diagnose, and it is very costly to eliminate from a farm (7, 47). As M. avium subsp. paratuberculosis may also be associated with Crohn's disease in humans (1, 17), pressure is building to reduce the prevalence of infection in farmed livestock.
Programs for M. avium subsp. paratuberculosis control in livestock are being developed and promoted in many developed countries (4, 24). They are based either on testing and culling of individual animals from within infected populations to reduce prevalence or on depopulation of entire infected herds and flocks to eliminate the infection. Central to these efforts is an assumption about the causative organism. M. avium subsp. paratuberculosis is described taxonomically as an obligate pathogen and parasite of animals (36), so in theory it can be eradicated by removal of all infected animals. However, this organism can survive for long periods outside the host, enabling it to persist and spread in the grassland environment and to withstand a periodic lack of suitable hosts. The transmission of the organism in animal feces was recognized early in the last century, and the question of how long pastures remain infective was raised as early as 1912 (30).
In Australia, where livestock production accounts for 13 billion Australian dollars in export earnings per annum, research is being conducted on the feasibility of eradication of ovine paratuberculosis by whole-flock depopulation, resting of pasture, and restocking with healthy sheep. However, the time that is required to eradicate the organism from the environment is unknown. It has been suggested that at least 6 months to a year is required to render pastures safe after grazing by infected cattle (7, 26). Data on the resistance of the organism were reported in 1944 (26) when feces from a cow with paratuberculosis was placed in an open bowl in an exposed place in London, United Kingdom, and cultured at intervals. The organism survived for about 9 months.
There are some other published data on the survival of M. avium subsp. paratuberculosis (Table 1), with a trend toward prolonged environmental viability, except in situations such as animal house slurry in which urine is also present, or in silage with low pH or high ammonia levels (22, 23). These data come from the northern hemisphere, where livestock are commonly housed indoors during winter on straw bedding, and where climates tend to be milder than in the temperate grazing regions of Australia. Furthermore, the data come from experimental models without field validation and pertain to the C or cattle strain of the organism, which is distinct from the important S or sheep strain that is prevalent in Australian sheep flocks (42). The S strain also occurs commonly in sheep in New Zealand (8) and some European countries such as Iceland (49) and Spain (R. J. Whittington and R. Juste, unpublished data). In Australia, the S strain is found mostly in sheep, but it may also infect goats and less commonly cattle (42, 48), and in New Zealand it is also found in goats and red deer (11). The S strain has cultural requirements different from those of the C strain (8, 43), but little else is known about it microbiologically.
TABLE 1.
Summary of reported duration of survival of M. avium subsp. paratuberculosis C strain in natural substrates exposed to conditions mimicking the natural environment and in various laboratory models
| Substrate | Source of bacilli | Estimated starting concn or no. of bacillia | Temp (°C); light | Duration of survival | Reference |
|---|---|---|---|---|---|
| In dip fluids, slurry, feces, and urine | |||||
| Amitraz cattle dip fluid (pH 12.4) | Naturally infected feces | Uncertain | 22 | >2, <3 wk | 13 |
| Anaerobic bovine slurry (mixture of feces, urine, straw, and water) | Cultured bacilli | 106/g | 5 | >252, <287 days | 20 |
| Anaerobic bovine slurry | Cultured bacilli | 106/g | 15 | >98, <112 days | 20 |
| Anaerobic bovine slurry | Cultured bacilli | 104/g | 35 | >21, <28 days | 29 |
| Anaerobic bovine slurry | Cultured bacilli | 104/g | 53-55 | <1 day | 29 |
| Bovine feces and strains | Naturally infected feces, containing orange-pigmented strainb | Uncertain | Not recorded | >5 mo | 35 |
| Bovine feces | Cultured bacilli | Uncertain | Uncertain | 11 mo | 38 |
| Bovine feces (liquid) in open bowl | Naturally infected feces | Uncertain | Ambient, −3 to 23; exposed | >246, <284 days | 26 |
| Bovine feces in open bowl | Naturally infected feces | Uncertain | Ambient, −2 to 23; exposed | >208, <236 days | 26 |
| Bovine feces in open bowl | Naturally infected feces | Uncertain | Ambient, −2 to 23; exposed | <5 mo | 26 |
| Caprine feces in open bowl | Naturally infected feces | Uncertain | Ambient, −2 to 23; exposed | >67 days | 26 |
| Bovine urine | Cultured bacilli | Uncertain | Uncertain | 7 days | 38 |
| Bovine urine | Cultured bacilli | 109/ml | 38; dark | <30 days | 25 |
| Bovine urine and feces | Cultured bacilli | 109/ml | 38; dark | <30 days | 25 |
| In water | |||||
| Tap water (pH 7) | Cultured bacilli | 109/ml | 38; dark | >17, <19 mo | 25 |
| Tap water (pH 5 or 8.5) | Cultured bacilli | 109/ml | 38; dark | >14, <17 mo | 25 |
| Distilled water, sterile (pH 6.4-6.8), in sealed bottle | Cultured bacilli | 105/ml | Ambient, 9 to 26 | >9, <13 mo | 26 |
| Tap water, sterile (pH 7.1-8.0), in sealed bottle | Cultured bacilli | 105/ml | Ambient, 9 to 26 | >9, <13 mo | 26 |
| Pond water plus mud, sterile (pH 5.3-5.9), in sealed bottle | Cultured bacilli | 105/ml | Ambient, 9 to 26 | >9, <13 mo | 26 |
| River water in bottle | Bovine intestinal scrapings | Uncertain | Ambient, January to May in London (United Kingdom); shade | >113, <141 days | 26 |
| River water in open bowl | Bovine intestinal scrapings | Uncertain | Ambient, −7 to 18; shade | >135, <163 days | 26 |
| River water in open bowl | Bovine intestinal scrapings | Uncertain | Ambient, −7 to 18; sun | >163, <218 days | 26 |
| Distilled water | Cultured bacilli | 106/ml | Uncertain | 455 days; D value; 69 to 92 days | 9 |
| In laboratory models | |||||
| Silage model (pH 4.4) | Cultured bacilli | Spotted on paper | 30 to 37 | <14 days | 22 |
| Silage model NH3 >1% | Cultured bacilli | Spotted on paper | 37 | <14 days | 23 |
| Saline | Cultured bacilli | 109/ml | 38; dark | >17, <19 mo | 25 |
| Desiccated culture | Cultured bacilli | 1011 | 38; dark | >17 mo | 25 |
| Desiccated culture | Cultured bacilli | 1011 | 38; dark | >47 mo | 25 |
| Desiccated culture | Cultured bacilli | 1010 | −14 for 5 mo, then 4 for 5 mo, then 38 for 8 mo | Viable | 25 |
| Desiccated culture | Cultured bacilli | 1010 | −14 for 12 mo, then 4 for 5 mo | Viable | 25 |
| Desiccated culture | Cultured bacilli | 1010 | Up to 44 | >65, <100 h | 25 |
| Bovine feces | Naturally infected feces | 104/g | −70 | >15 wk | 34 |
| Bovine feces | Naturally infected feces | >103/g | −70 | >15 wk | 33 |
| Bovine feces | Naturally infected feces | <103/g | −70 | <15 wk | 33 |
Based on authors' raw data (colony count) or, if no other data given, assuming 1 mg (wet weight) of bacilli = 107 organisms and 1 mg (dry weight) of bacilli = 108 organisms.
Strain type uncertain.
The apparent duration of survival of M. avium subsp. paratuberculosis strain S can be inferred from observations on farms in southeastern Australia, where it was recovered from approximately 20% of 163 soil-pasture, water, and sediment samples from six farms with clinically affected sheep or goats (45). When the same sites were sampled again about 5 months later, after removal of affected animals, only one was culture positive, and none were culture positive ≥12 months later.
The aim of this study was to determine the duration of environmental survival of the S strain of M. avium subsp. paratuberculosis under Australian conditions and to investigate the effects of a number of factors, including solar radiation and soil pH and moisture, that might influence survival.
MATERIALS AND METHODS
Natural pasture plots and boxes of soil containing sown grasses were contaminated with infected sheep feces. Fecal, soil, and pasture samples were collected at intervals for up to 117 weeks and cultured to detect viable M. avium subsp. paratuberculosis. There were four experiments (Table 2). Experiment 1 began in January 1998 and was undertaken at two locations with seven plots at each to evaluate the effects of shade, irrigation, and lime application on survival. Experiment 2, a pilot study, began in November 1998 with plots at the same locations and boxes containing soil and pasture at a third site to evaluate the effect of shade and potential differences between plots and boxes. Experiment 3 was undertaken at two locations with plots and boxes, was started in November 1999, and was repeated as experiment 4 in January 2000, to examine the seasonal effects of solar radiation and shade on the survival of the organism.
TABLE 2.
Experimental design, starting levels of contamination, and maximum observed period of survival
| Expt no. | Starting datea | Unit (no. of subplots or replicates) | Treatment
|
Location(s) | Viable counts of M. avium subsp. paratuberculosis at start
|
Max observed survival (wks) | ||||
|---|---|---|---|---|---|---|---|---|---|---|
| Shade (%) | Irrigation | Lime | Vegetation removed to simulate grazingb | Per g of fecal mixture | Per cm2 of soil surface | |||||
| 1 | Jan 1998 | Plot 1 (3)c | No | No | No | No | Carcoar, Borenore | 5.00 × 10⁶ | 7.11 × 10⁵ | 32 |
| Plot 2 (3)c | 70 | No | No | No | Carcoar, Borenore | 7.11 × 10⁵ | 32 | |||
| Plot 3 (3)c | 70 | Yes | No | No | Carcoar, Borenore | 7.11 × 10⁵ | 32 | |||
| Plot 4 (3)c | 70 | Yes | Low | No | Carcoar, Borenore | 7.11 × 10⁵ | 26 | |||
| Plot 5 (3)c | 70 | Yes | High | No | Carcoar, Borenore | 7.11 × 10⁵ | 32 | |||
| Plot 6 (3) | 70 | Yes | No | No | Carcoar, Borenore | 5.00 × 10⁵ | 3.34 × 10⁴ | 26 | ||
| Plot 7 (3) | No | No | No | No | Carcoar, Borenore | 3.34 × 10⁴ | 32 | |||
| 2 | Nov 1998 | Plot 8 (3) | No | No | No | Yes | Carcoar, Borenore | 1.20 × 10⁶ | 1.07 × 10⁵ | 5 |
| Boxes (2) | Partial | At start | No | Once | Camden | 1.63 × 10⁵ | 10 | |||
| 3 | Nov 1999 | Plot 9 (4) | No | No | No | Yes | Borenore | 1.58 × 10⁵ | 3.16 × 10⁴ | 2 |
| Plot 10 (4) | 70 | No | No | Yes | Borenore | 3.16 × 10⁴ | 12 | |||
| Boxes (2) | No | At start | No | Once | Borenore | 2.10 × 10⁴ | 2 | |||
| Boxes (2) | 70 | At start | No | Once | Borenore | 2.10 × 10⁴ | 12 | |||
| Boxes (3) | No | At start | No | Once | Camden | 2.10 × 10⁴ | 12 | |||
| Boxes (3) | 70 | At start | No | Once | Camden | 2.10 × 10⁴ | 12 | |||
| Boxes (3) | 100 | At start | No | Once | Camden | 2.10 × 10⁴ | 28 | |||
| 4 | Jan 2000 | Plot 11 (4) | No | No | No | Yes | Borenore | 1.58 × 10⁵ | 3.16 × 10⁴ | 10 |
| Plot 12 (4) | 70 | No | No | Yes | Borenore | 3.16 × 10⁴ | 10 | |||
| Boxes (2) | No | At start | No | Once | Borenore | 2.10 × 10⁴ | 16 | |||
| Boxes (2) | 70 | At start | No | Once | Borenore | 2.10 × 10⁴ | 24 | |||
| Boxes (3) | No | At start | No | Once | Camden | 2.10 × 10⁴ | 12 | |||
| Boxes (3) | 70 | At start | No | Once | Camden | 2.10 × 10⁴ | 16 | |||
| Boxes (3) | 100 | At start | No | Once | Camden | 2.10 × 10⁴ | 55 | |||
Jan, January; Nov, November.
Vegetative cover provided significant shade if not removed.
These plots received slurry mix. All other treatments received pellet mix.
Field sites.
Field sites were established in areas of endemicity for ovine paratuberculosis at Borenore and Carcoar (altitude, 1,000 m above sea level; 33°S latitude) in the Central Tablelands district and at Camden (70 m above sea level; 34°S) in the Sydney district of New South Wales. At Camden there was an exposed unshaded site, as well as a protected partially shaded site on the veranda of a building. An intentionally shaded site (70%) was constructed on the veranda with knitted polypropylene cloth, and a second site on the veranda was totally shaded (100%). Shaded enclosures (70%), fully covered with knitted polypropylene cloth and measuring 10 by 6 by 2.4 m (length by breadth by height, respectively) were constructed in open paddocks on farms at Borenore and Carcoar. Each was surrounded by a secure perimeter fence to exclude livestock and an earth mound to prevent surface water runoff. With a handheld radiometer it was confirmed that 70% of incident solar radiation was absorbed by the woven cloth at each site and that there was little or no UV radiation in the 100% shade treatment at Camden. The shaded sites at Camden were completely protected from natural rainfall.
At Borenore and Carcoar, marker pegs and string lines were used to create pasture plots and square subplots either 1.5 by 1.5 m in triplicate (experiments 1 and 2) or 1.1 by 1.1 m in quadruplicate (experiments 3 and 4), within the shade enclosures and also in unshaded locations on the northern side of each enclosure. Microirrigation sprayers were installed in plots 3, 4, 5, and 6 to provide water for 15 min each night to ensure constantly moist soil conditions. To increase soil pH, fine agricultural lime was applied to plots 4 and 5 at rates of 50 and 250 g/m2 (0.5 and 2.5 tonnes/ha), respectively, immediately prior to application of fecal material. Very little pasture was present at the start of experiment 1, and fecal material was applied to bare soil, but pasture was allowed to grow during this experiment, and this created shade at soil level. By 5 months there was a dense cover of grasses, broadleaf weeds, and clover, particularly inside the shaded enclosures. For experiments 2 to 4, pasture was kept <10 to 15 cm high by regular manual cutting and removal to simulate grazing by sheep. The vegetation was grass dominant with broadleaf weeds and clover and covered between 40 and 85% of the soil surface in shaded plots and 50 to 95% in unshaded plots.
Soil boxes composed of expanded polystyrene (58 by 38 by 23 cm) were filled to a depth of 20 cm with soil. A commercial grass seed mixture (couch, 20%; chewing fescue, 10%; perennial ryegrass, 70%) was sown with a light dressing (10 g/box) of fertilizer (4.8% nitrogen as ammonium, 5.7% phosphorus, 5.9% potassium chloride, 12.6% sulfur, and 12.4% calcium) 7 days before application of infected feces so that the grasses would germinate after contamination of the boxes. Boxes were lightly watered to maintain the viability of the grasses, generally at a rate of >0.5 liter per box per week. The boxes generally had an even cover of grass shoots to 75 mm high by 1 week after contamination with feces. At Camden in experiments 3 and 4, rainfall in unshaded boxes supported grass growth whereas grass was not watered after 3 months and allowed to brown off in the shaded boxes. A drainage tube was fitted to the base of one box in experiment 2 to enable collection of runoff water.
Weather data.
Automatic weather data loggers (Easydata Mk4; Environdata Australia Pty. Ltd., Warwick, Queensland, Australia) were installed at the Borenore and Carcoar sites (experiments 1 to 3) and also at Camden (experiments 3 and 4). These recorded dry bulb air temperature, soil temperature at 1-cm depth, UV radiation (290 to 400 nm), solar radiation (500 to 1,000 nm with correction to encompass 400 to 3,000 nm), and rainfall. Daily maximum, minimum, and average dry bulb air temperature, soil temperature, rainfall, solar radiation, and UV radiation were recorded or derived from these measurements. For experiment 2 at Camden, only the daily maximum and minimum dry bulb air temperatures in the immediate environment of the boxes were recorded.
Source and preparation of naturally infected feces.
Feces containing M. avium subsp. paratuberculosis were collected from groups of sheep on three separate occasions, namely, just prior to experiments 1, 2, and 3. The feces used in experiment 4 were from the same sheep as those used in experiment 3 but were stored at −80°C for about 2 months. The sheep were infected with M. avium subsp. paratuberculosis strain BstEII type S1, IS1311 type S (42). Sheep were individually identified; purchased from a farm at Goulburn, New South Wales; housed in a secure animal house; and fed lucerne pellets, lucerne hay, chaff, and oats, and feces were collected as described elsewhere (46). The feces from each animal from each day were collected into plastic bags and held at 4°C, or at −80°C if not required for use within a few days. The quantities of feces collected in the first year were representative of those in later years and are reported separately (46). Feces from animals with soft-formed stools were premixed with chaff (4 liters/kg of feces) to obtain discrete masses of feces which were added to the other feces with some water and additional chaff to obtain a dry, flaky, free-falling pelleted mixture (85% feces by weight), or they were mixed for longer and pellets were broken down by hand to form a slurry mix. The pooled feces were thoroughly mixed in a large mechanically rotated drum and then divided into portions and stored overnight in sealed plastic bags at 4°C prior to contamination of sites. Subsamples were retained at −80°C for later enumeration of M. avium subsp. paratuberculosis cells (see below). The fecal mixtures contained 105 to 106 viable organisms per g (Table 2). The organisms in both fecal mixtures used in experiments 3 and 4 were enumerated in April 2000, and counts were the same.
Contamination of plots and boxes.
Plots were contaminated evenly by hand with pellet mix at a rate of 0.9 to 1.7 kg/m2, being a level of fecal contamination consistent with usual sheep stocking rates and equivalent visually to a pellet upon every few square centimeters of soil surface, or with slurry mix at a rate of 0.7 kg/m2. Similarly each box was contaminated evenly with 300 g of fecal pellet mix. The contamination rates applied to soil were in the range of 104 to 106 viable organisms per square centimeter (Table 2). The boxes were contaminated in situ, except for experiment 3, where the fecal mixture was applied at Camden and the contaminated boxes were then transported for 3 h by vehicle to Borenore. Movement during transport caused surface pooling of water and coating of fecal material in some boxes with mud and adversely affected grass seed germination.
Sampling from plots and boxes.
In each experiment all the subplots of each of the field plots were sampled at each time. A galvanized steel wire grid, 1 m2, with 1,600 numbered cells each of 2.5 cm2 was placed on the ground and aligned carefully with a fixed marker peg at the corner of each subplot, and random numbers were used to select cells for the collection of samples. A fecal pellet was collected from the cell containing a pellet that was nearest to the selected cell. Vegetation was parted carefully, and after removal of the pellet, a core 1 cm in diameter by 2 cm deep was taken from the soil beneath the pellet by using a sterile 10-ml syringe barrel from which the tip had been cut. Soil cores from plots contaminated with fecal slurry mixture included the slurry mixture on the surface of the soil, and separate collection of fecal material was not attempted. Soil cores included surface litter, soil, and plant roots to a depth of about 2 cm as well as some aerial parts of plants where these could not be avoided.
Boxes in experiment 2 were marked out into two equal segments and used for two consecutive collections of pellets and soil beneath them. About 50 ml of runoff water was collected weekly from a drainage tube in the base of box 10 after overwatering this box. In experiment 3, each box was marked out into three equal segments (A, B, and C). One segment of each of two (Borenore) or three (Camden) boxes was sampled at each time.
At each sampling, two pools of 10 pellets and subjacent soil cores were taken at random from each subplot or box segment for culture. Pellets and soil cores were pooled in separate containers. At the final sampling of boxes in each experiment, between 4 and 16 times the usual number of samples were collected to increase the probability of isolating low numbers of organisms. Culture results for the pooled samples of pellets and soil were paired to determine whether viable M. avium subsp. paratuberculosis organisms were present in that subplot or box segment (culture site) at each sampling time. After primary culture, all samples were stored at −80°C to enable enumeration of the organisms in selected culture-positive samples. Precontamination samples consisting of two pools of 10 soil cores were collected from representative subplots as negative controls for soil inside and outside the shade enclosures, and negative-control soil samples were taken from boxes. These samples were all culture negative. Immediate-postcontamination samples were collected from all subplots and boxes to confirm uniform contamination and effective sampling. These samples were all culture positive. Sampling of pellets was continued for as long as they were recognizable as discrete objects. Grass samples were collected with scissors, with careful cutting so as to avoid contamination with feces or soil.
Culture methods.
Samples were thoroughly mixed prior to subsamples of 2 g being taken for culture. Initially mixing was undertaken by hand with a mortar and pestle and scissors to break up plant material, but in most cases a high-speed electric blender with metal cutting blades was used (41). Cultures were performed using a double incubation and centrifugation method to decontaminate samples and modified BACTEC 12B radiometric medium (Becton Dickinson) as previously described (43, 44). Vials were incubated at 37°C for 20 weeks to detect low numbers of the target organism (45). Identification of M. avium subsp. paratuberculosis was achieved by detection of IS900 by PCR directly from the BACTEC culture medium, with restriction endonuclease analysis of PCR product to ensure specificity (10). Grass samples were placed in resealable plastic bags, and 250 to 500 ml of saline with 0.1% (vol/vol) Tween 80 was added so that the grass was completely covered. The bag was placed on a rocking platform for 1 h at room temperature and turned over every 15 min to ensure thorough washing of the grass. The washing water was collected and centrifuged at 11,000 × g for 20 min. The pellet was then added to a tube containing 10 ml of saline to sediment debris, and the remainder of the procedure was identical to that used for culture of feces. Water samples from box 10 in experiment 2 were centrifuged at 11,000 × g for 20 min, and the pellet was added to saline and cultured as described above.
Enumeration of M. avium subsp. paratuberculosis.
Unless otherwise stated, five replicate cultures, each of 2 g, were undertaken for each sample, and the organism was enumerated by endpoint titration in radiometric culture medium (46). Dilutions were made in phosphate-buffered saline. Rates of contamination of M. avium subsp. paratuberculosis per unit surface area of soil were calculated based on the results of enumeration of the organism in the fecal mixture and the amount of mixture applied per unit area.
Direct PCR analysis of fecal pellets.
DNA was extracted from fecal pellets by boiling, purified over a silica column, and examined for IS900 exactly as described elsewhere (27).
Soil analysis.
The soil used in boxes was well mixed, and 1-kg samples were submitted for analysis. Standard soil samples were collected from plots in September 1999, 20 months after liming plots for experiment 1, with the use of a corer 2 cm in diameter by 10 cm in depth. Twelve cores were collected in a grid pattern from each subplot in plots 2, 3, 4, 5, and 6 (36 cores per plot). Samples were well mixed before analysis. Surface samples were also collected from the upper 50 mm of selected plots. Soil analyses were performed by Analysis Systems, Incitec Ltd., Port Kembla, New South Wales, Australia, by standard methods: color and texture by observation; pH meter; conductivity meter; colorimetry for organic carbon, nitrate nitrogen, sulfur (also measured turbidimetrically), phosphorus, and chloride; and atomic absorption spectroscopy for potassium, calcium, magnesium, sodium, aluminum, and iron.
In silico analysis of dormancy-associated genes.
The Dps protein (DNA binding protein from starved cells) and the relA gene product (GTP pyrophosphokinase) are active in survival and dormancy responses of bacteria under starvation conditions, with homologues known in mycobacteria (2, 15). The DNA sequences for Mycobacterium smegmatis dps (GenBank accession no. AY065628) and Mycobacterium tuberculosis relA (relA gene accession no. Rv2583c, Tuberculist Web Server, http://genolist.pasteur.fr/TubercuList/) were submitted to the M. avium subsp. paratuberculosis genome database (http://www.ncbi.nlm.nih.gov, accession no. NC 002944). Matching sequences from M. avium subsp. paratuberculosis were then analyzed in each reading frame for amino acid sequences similar to those of Dps and RelA. Alignments were done in GAP with the BLOSUM62 amino acid substitution table (16, 28) through the Bionavigator facility, Australian National Genomic Information Service, University of Sydney.
Statistical analysis. (i) Assessment of treatment and time effects on the proportion of culture-positive samples.
For experiment 1, totals of the culture-positive sites for each treatment in weeks 5 to 9 and weeks 14 to 18 were expressed as proportions of the corresponding total number of cultured sites. For experiments 3 and 4 combined, proportions of culture-positive sites for each treatment in weeks 2 to 6 and weeks 8 to 16, and also weeks 20 to 36 for the shaded treatments at Camden, were similarly determined. Mixed-model logistic regression analyses of the proportions were used to assess the fixed effects of periods and treatments and their two-factor interactions, with the effects of locations and the location-period and location-treatment interactions taken as random. The fixed effects in experiment 1 were source of contamination (slurry mix or pellet mix), period (5 to 9 and 14 to 18 weeks), shade (nil and 70%), and slurry treatment (control, lime rate, and irrigation), and those in experiments 3 and 4 were month of contamination (November or January), period (2 to 6 and 8 to 16 weeks, and 20 to 36 weeks for the shaded treatments at Camden), shade (nil and 70% at both sites; 70 and 100% at Camden), and plot type (field, and box at Borenore). For the latter experiments, the interactions with location involved only the periods and treatments common to the locations. The analyses were performed using ASReml statistical software (14). All tests were conducted at the 5% level of significance (P < 0.05).
(ii) Rates of decay of the number of viable organisms.
Counts of the number of viable organisms [log10(counts/gram)] over time were plotted (Prism; Graphpad Software Incorporated). Linear regressions of log10(counts/gram) on weeks after contamination were performed for experiments 1 and 2, excluding the data in later weeks, which were statistical outliers. For experiment 4, a linear mixed model which comprised a fixed linear term and a random nonlinear term, fitted as a cubic smoothing spline (37), was first fitted. This model showed that there were two distinct phases of decline, so separate linear regressions were fitted for each phase. For each regression relation, 95% confidence limits for the predicted mean values were calculated.
RESULTS
Duration and patterns of survival.
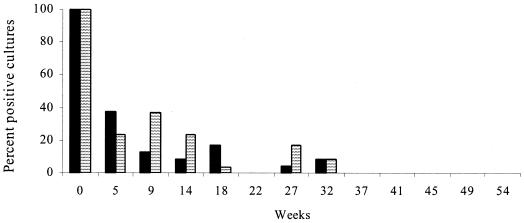
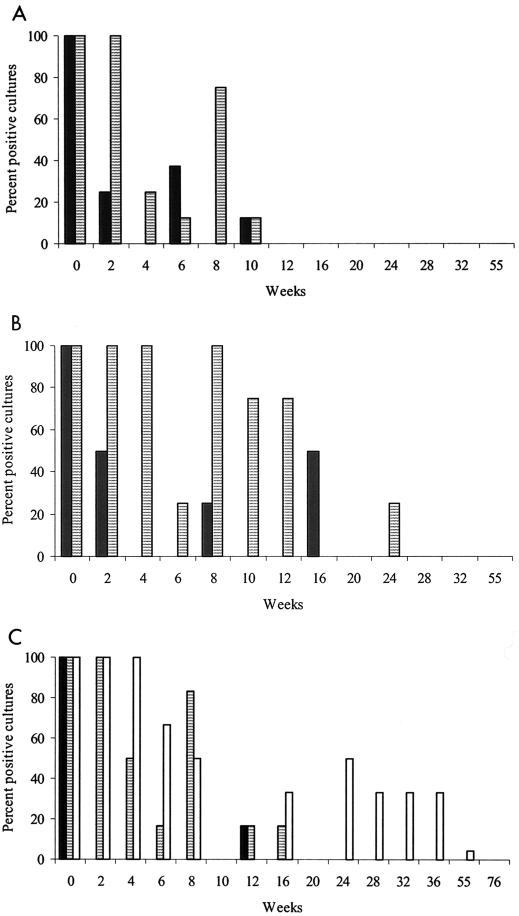
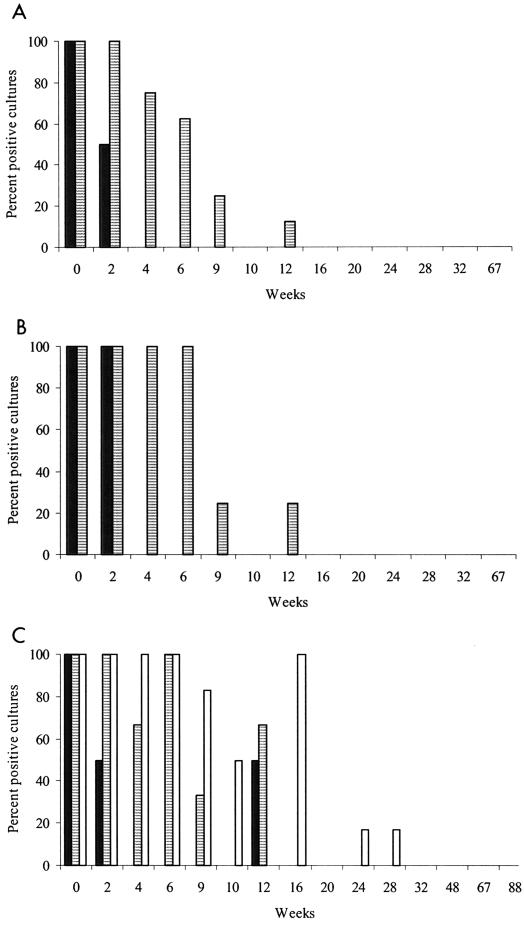
Over the first 12 to 18 weeks in the experiments, there were generally marked declines in the mean proportions of culture-positive sites to low or zero values (Fig. 1 to 4). No positive results occurred between 18 and 24 weeks in any experiment. However, in experiments 1, 3, and 4, culture-positive results occurred at and after 24 weeks for some treatments and on earlier occasions following one or more negative samplings, although the mean proportions were usually low (Fig. 1, 3, and 4).
FIG. 1.
Percentages of culture-positive sites in experiment 1 grouped by shade treatment. Data for the plots at Carcoar and Borenore were pooled. There were no culture-positive sites for week 57, 61, 65, 69, or 72. Solid bars, no shade; striped bars, 70% shade.
FIG. 4.
Percentages of culture-positive sites in experiment 4 grouped by shade treatment. (A) Plots at Borenore, fecal pellets sampled only to week 16 in 0% shade and week 10 in 70% shade; (B) boxes at Borenore, fecal pellets sampled only to week 24 in 0% shade and week 12 in 70% shade; (C) boxes at Camden, fecal pellets sampled only to week 32 in 0% shade and week 76 in 70 and 100% shade. Results for grass are not shown. Solid bars, no shade; striped bars, 70% shade; open bars, 100% shade.
FIG. 3.
Percentages of culture-positive sites in experiment 3 grouped by shade treatment. (A) Plots at Borenore, fecal pellets sampled only to week 20 in 0% shade and week 16 in 70% shade; (B) boxes at Borenore, fecal pellets sampled only to week 32 in 0% shade and week 20 in 70% shade; (C) boxes at Camden, fecal pellets sampled only to week 32 in 0% shade, week 48 in 70% shade, and week 88 in 100% shade. Results for grass are not shown. Solid bars, no shade; striped bars, 70% shade; open bars, 100% shade.
In experiment 1, the organism was recovered from plots at both sites to 32 weeks after contamination. No significant effects of shade, source of contamination, lime treatment, or irrigation on the proportion of culture-positive sites were detected (P > 0.05) (Fig. 1).
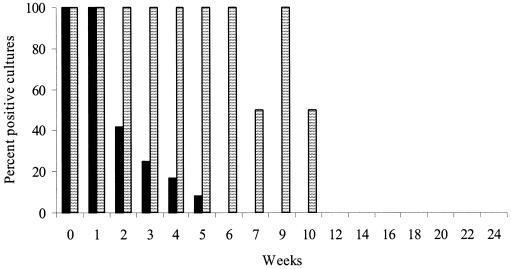
In experiment 2, which was a pilot study using boxes for the first time, the duration of survival of the organism in feces and soil on unshaded plots was up to 5 weeks, and up to 10 weeks in soil boxes at the partially shaded location. The rate of isolation from the shaded location appeared to be greater than that from the unshaded location (Fig. 2). Grass samples from the boxes were culture positive each week up to and including week 4. The time for grass samples to reach peak growth index (5 to 8 weeks) was similar to that of fecal pellets, implying similar viable counts of M. avium subsp. paratuberculosis. Runoff water collected from box 10 was culture positive to week 3, and this represented water that had moved through the soil profile and between the soil and the inside surfaces of the box.
FIG. 2.
Percentages of culture-positive sites in experiment 2 grouped by shade treatment. There were no culture-positive sites for week 29, 33, or 117; there were no samples for weeks 6 and 7 for the no-shade treatment. Results for grass are not shown. Solid bars, no shade, pooled results for the plots at the sites at Borenore and Carcoar; striped bars, 70% shade, results for boxes at Camden.
As the duration of survival of the organism was considerably longer in experiment 1, which started in January, than in experiment 2, which started in November, and was shorter in unshaded vegetated plots than in partially shaded boxes in experiment 2, it was hypothesized that differences in the amounts of solar radiation due to season, vegetation, and direct shading may have been important. Therefore, experiment 3 was started in early November, shade was included as a treatment at two levels (0 and 70%) for plots and boxes at Borenore and three levels (0, 70, and 100%) for boxes at Camden, and this design was repeated as experiment 4, which started about 3 months later, at the end of January (Fig. 3 and 4). In the latter experiment M. avium subsp. paratuberculosis survived for up to 55 weeks in fecal pellets in the shade but for much shorter periods in unshaded locations.
In experiments 3 and 4, there was a significant interaction between month of contamination and period: the mean proportions of culture-positive sites in November and January were 68.3 and 29.3%, respectively, for weeks 2 to 6 compared with 10.2 and 14.2%, respectively, for weeks 8 to 16. Over weeks 2 to 16 the mean proportion of positive sites for 70% shade (56.1%) was significantly higher than that for nil shade (9.3%). At Camden, over weeks 2 to 36 there was a significant increase of 17.2% in the mean proportion of positive sites between the 70 and 100% shade treatments. At Borenore, over weeks 2 to 16 the mean proportion of positive sites for boxes (38.2%) was significantly higher than that for plots (20.3%).
In experiment 3, grass samples from boxes in 70% shade at Camden were culture positive for 4 weeks while those in 100% shade were positive for 10 weeks. The corresponding values for experiment 4 were 9 and 24 weeks. The organism was not recovered from grass from unshaded boxes at Camden in either experiment. There were few positive cultures from grass from boxes at Borenore, but survival was found after 9 weeks in 70% shade in experiment 3.
A feature of the results for experiments 1, 3, and 4 was the reappearance of culture-positive results after one or more time points at which all samples were culture negative (Fig. 1, 3, and 4). To provide additional information on this phenomenon, samples from experiment 3 (boxes, 100% shade, Camden) were examined using direct PCR. M. avium subsp. paratuberculosis DNA was demonstrated in six of six culture-positive samples from time zero, six of six samples taken at 10 weeks (only three of which had been culture positive), four of five culture-negative samples taken at 12 weeks, and six of six culture-negative samples taken at 32 weeks. Thus, M. avium subsp. paratuberculosis cells were present in pellets in most samples even though the organism was not cultivable. In each experiment the incubation time required for cultures to reach peak growth index increased over time, consistent with a decline in the number of viable organisms. However, in some of the cases where the organism was cultured after a previous culture-negative time point, growth occurred more quickly at the later time point, suggesting an increase in the viable count or recruitment of viable cells from a dormant state.
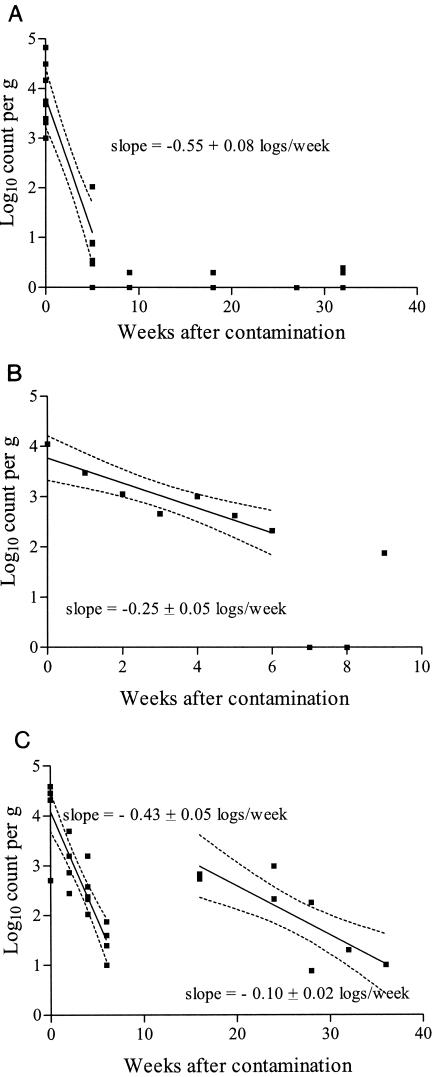
Retrospective enumeration of M. avium subsp. paratuberculosis in selected culture-positive samples from experiments 1, 2, and 4 was undertaken and confirmed these observations. There was an initial phase of rapid decline in viable count lasting several weeks to a few months, but thereafter the pattern was variable (Fig. 5). In experiment 1 counts were low or 0 from 9 to 32 weeks, while in experiment 2 the count was 0 at weeks 7 and 8 but rose to 75 at week 9. For experiment 4 there was a significant spline trend in the mean count over weeks after contamination, with a local minimum estimated near week 8 and a local maximum near week 18. The estimated increase in mean count between the sampled weeks 6 and 16 was 0.97 ± 0.37 logs, which was significant (P < 0.05) and indicated that there were two decline phases (Fig. 5). This increase in viable count coincided with a reduction in time to peak growth index from 10 to 6 weeks when these samples were cultured originally. There was a small rise in the viable count in experiment 2 between weeks 3 and 4 coinciding with a reduction in time to peak growth index from 8 to 6 weeks.
FIG. 5.
Log10 counts of M. avium subsp. paratuberculosis and linear regressions on weeks after contamination. (A) Experiment 1, fecal pellet and soil samples, data from Borenore and Carcoar pooled; (B) experiment 2, fecal pellet samples collected from partially shaded pasture boxes at Camden; (C) experiment 4, fecal pellet samples collected from boxes in the 100% shade treatment at Camden. Results shown are the counts for the individual samples, the regression line with 95% confidence limits for the predicted means, and the slope of the line ± standard errors.
Rates of decay of the number of viable organisms in the decline phases of experiments 1, 2, and 4 (with the week 16 data included as part of the second decline phase) were estimated by linear regression, and estimates ranged from 0.55 to 0.10 logs/week (Fig. 5). When grouped according to the duration of the decline phase, there was an inverse relation (Table 3).
TABLE 3.
Decay rates of M. avium subsp. paratuberculosis in shaded locations estimated by linear regression of actual counts
| Expt | Period of observation (mo) | Decay rate (logs/mo) | Shade | Sample |
|---|---|---|---|---|
| 1 | 0-1 | 2.2 | Partial | Pellets and soil from plots |
| 4 | 0-1.5 | 1.7 | 100% | Pellets from boxes |
| 2 | 0-1.5 | 1.0 | Partiala | Pellets from boxes |
| 4 | 4-9 | 0.4 | 100% | Pellets from boxes |
Shaded veranda boxes.
Weather data.
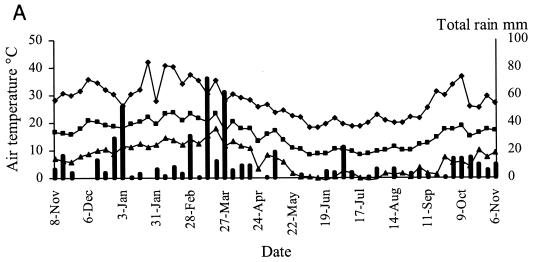
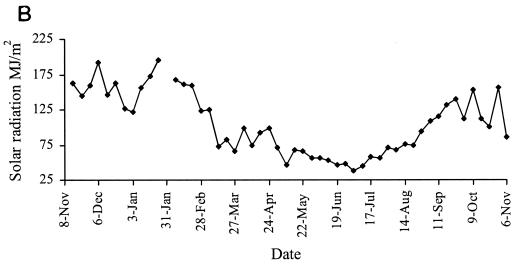
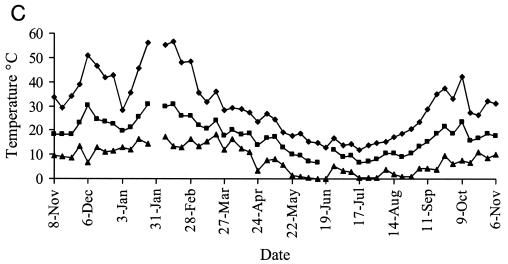
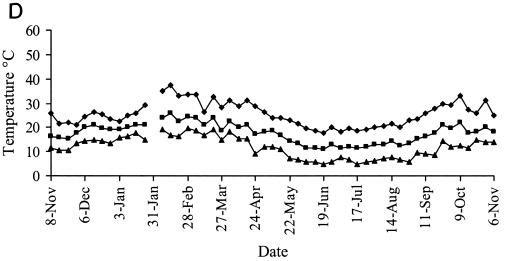
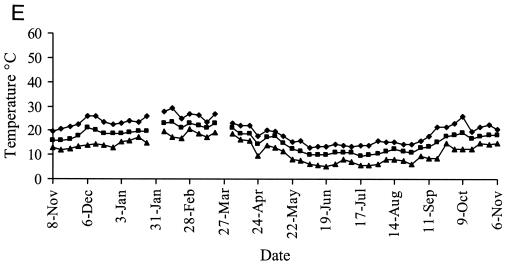
Representative weather data for a 12-month period at Camden are shown in Fig. 6. Rainfall was evenly distributed at each site, with periodic heavy falls of up to 100 mm/week associated with storms. Carcoar and Borenore received about 700 mm rainfall annually compared to 500 mm at Camden, which was warmer than the other sites. Maximum dry bulb air temperatures approached 40°C at Carcoar and Borenore and 45°C at Camden, and minima were below 0°C at each site. The main factors varying between shade treatments were the degree of solar radiation and soil temperature. In unshaded locations total weekly solar radiation levels exceeded 200 MJ/m2 in summer and were as low as 25 MJ/m2 in winter, while total weekly UV levels were 5 to 7 W/m2 in summer and 0.5 to 1 W/m2 in winter. In unshaded plots or boxes soil temperature at the 1-cm depth ranged from about 50°C in summer to just above 0°C in winter at Carcoar and Borenore and approached 60°C in summer at Camden. In 70% shaded plots and boxes the maximum soil temperature recorded was about 40°C whereas in 100% shade it was about 30°C. The diurnal range of soil temperatures was much less for shaded than for unshaded locations (Fig. 6).
FIG. 6.
Weather data from Camden for a 12-month period corresponding to experiments 3 and 4. Contamination occurred on 8 November 1999 and 31 January 2000. Temperature data are weekly maxima, averages, and minima. (A) Mean weekly dry bulb air temperatures and total weekly rainfall; (B) weekly total solar radiation; (C) mean weekly soil temperature, no shade; (D) mean weekly soil temperature, 70% shade; (E) mean weekly soil temperature, 100% shade. ♦, maximum; ▪, mean; ▴, minimum.
Analyses of soils.
The soil used in boxes was a dark yellow-brown, light, sandy loam with low organic matter content, a pH of 5.8 to 6.1, and iron levels of 12 to 30 mg/kg (Table 4). The soil present in pasture plots at Borenore and Carcoar was a brown clay loam, had a higher organic matter content than that in the boxes, was slightly acidic (pH 5.7 to 6.7 across plots), and had iron levels of up to 130 mg/kg. The application of lime resulted in an increase in pH of about 0.4 U for low lime and 1.0 U for high lime at Borenore and 0.2 U for low lime and 0.7 U for high lime at Carcoar. The high-lime plots at both Borenore and Carcoar had a pH of 7.4 in surface samples.
TABLE 4.
Soil analysis
| Parameter | Boxes
|
Plots
|
||||||
|---|---|---|---|---|---|---|---|---|
| Expt 2 | Expt 3 | Borenore
|
Carcoar
|
|||||
| No limea | Low lime | High lime | No limea | Low lime | High lime | |||
| pH (water) | 6.25 | 5.8 | 5.7 | 6.1 | 6.6 | 6.5 | 6.7 | 7.2 |
| pH (CaCl2) | 5.4 | 4.85 | 4.9 | 5.3 | 5.9 | 5.8 | 6 | 6.5 |
| pH (water), superficial soil | 6.4 | 6.9 | 7.4 | 6.7 | 6.9 | 7.4 | ||
| Organic carbon (% C) | 0.55 | 0.5 | 2.1 | 1.9 | 2 | 2 | 2 | 1.7 |
| Sulfate sulfur (KCl40) (mg/kg) | 10 | 8 | 14 | 17 | 17 | 5 | 4 | 4 |
| Phosphorus, Colwell (mg/kg) | 24 | 15.5 | 30 | 30 | 34 | 27 | 25 | 24 |
| Phosphorus, Bray (mg/kg) | 8.5 | 3.5 | 9 | 11 | 12 | 6 | 6 | 5 |
| Potassium (meq/100 g) | 0.21 | 0.085 | 0.35 | 0.35 | 0.36 | 0.86 | 0.85 | 0.74 |
| Calcium (meq/100 g) | 2.3 | 1.4 | 3.6 | 4 | 5.6 | 6.8 | 7.2 | 7.8 |
| Magnesium (meq/100 g) | 1.35 | 1.2 | 1.4 | 1.8 | 2 | 1 | 1 | 0.9 |
| Aluminum (meq/100 g) | 0.06 | 0.22 | 0.59 | NTb | NT | NT | NT | NT |
| Sodium (meq/100 g) | 0.19 | 0.105 | 0.08 | 0.07 | 0.08 | 0.1 | 0.11 | 0.09 |
| Chloride (mg/kg) | 82 | 7 | 8 | 11 | 10 | 8 | 6 | <5 |
| Electrical conductivity (dS/m) | 0.07 | 0.02 | 0.05 | 0.05 | 0.06 | 0.06 | 0.06 | 0.05 |
| Nitrogen Kjeldahl (%) | 0.04 | 0.025 | 0.17 | 0.17 | 0.18 | 0.2 | 0.24 | 0.19 |
| Iron DTPAc (mg/kg) | 12.5 | 23 | 129 | 98 | 75 | 60 | 50 | 32 |
Mean value for plots 2, 3, and 6.
NT, not tested.
DTPA, diethylenetriamine pentaacetic acid.
In silico analysis of dormancy-associated genes.
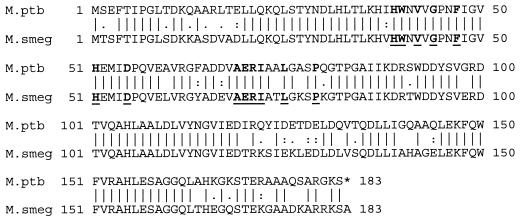
Regions highly similar to dps of M. smegmatis and relA of M. tuberculosis were identified in the M. avium subsp. paratuberculosis genome sequence. The 552-bp DNA sequence (GenBank accession no. AY065628) that codes for the 184-amino-acid Dps protein from M. smegmatis was used to locate the corresponding region in the M. avium subsp. paratuberculosis genome database through a Blast search. The predicted amino acid sequences had 82.5% similarity and 75.6% identity, including a perfect match for each of the amino acids thought to be involved in the DNA binding signature of the active protein in M. smegmatis (see Fig. 8)(15).
FIG. 8.
Alignment of the amino acid sequences for the Dps-like protein from M. avium subsp. paratuberculosis (M. ptb) and Dps from M smegmatis (M. smeg) (GenBank accession no. AY065628). Amino acid residues in boldface and underlined are reported to be involved in the DNA binding signature (15). Symbols: bar, identical; colon, highly related; period, more distantly related; no symbol, unrelated.
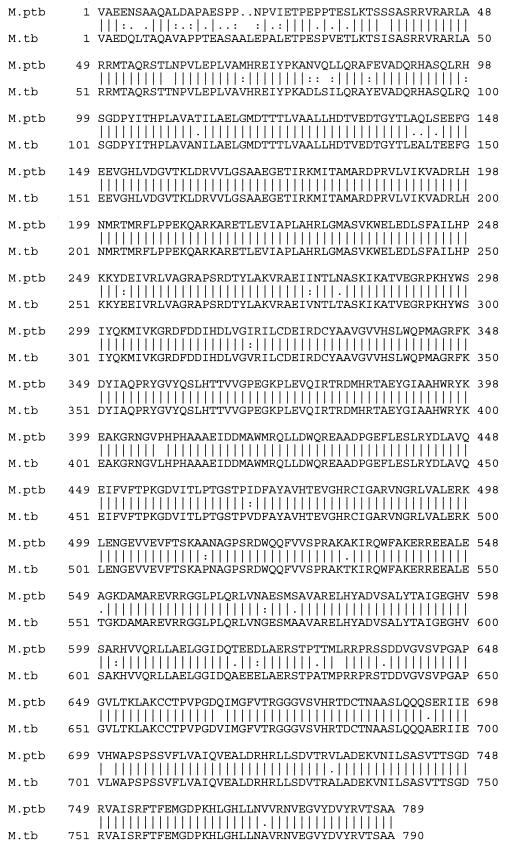
There was a homologue of M. tuberculosis relA in the M. avium subsp. paratuberculosis genome sequence (88% similarity over 2,373 bp). The predicted amino acid sequence of M. avium subsp. paratuberculosis RelA excluded amino acids arising from a 6-bp deletion corresponding to bp 49 to 54 in M tuberculosis but had 96% similarity and 93.4% identity (see Fig. 9).
FIG. 9.
Alignment of the amino acid sequences for the RelA-like element from M. avium subsp. paratuberculosis (M. ptb) and RelA from M. tuberculosis (M. tb) (relA gene accession no. Rv2583c, TubercuList Web Server, http://genolist.pasteur.fr/TubercuList/). Symbols: bar, identical; colon, highly related; period, more distantly related; no symbol, unrelated.
DISCUSSION
The results of this study support those from trials in the northern hemisphere with the cattle strain of M. avium subsp. paratuberculosis and confirm that this taxon can be extremely persistent in nature, with survival for more than 1 year. Unlike earlier trials where contaminated material was placed in small containers, survival was studied on farms where Johne's disease is prevalent, in natural pasture plots and in boxes containing soil and grass. The presence of soil and pasture provided a more realistic substrate than what could be achieved in a laboratory environment.
When M. avium subsp. paratuberculosis in feces becomes mixed with soil, there is a reduction of 90 to 99% in the apparent viable count of the organism. This is probably caused by binding of bacteria to soil particles, which are excluded from culture by sedimentation during sample preparation (45). Attachment to soil also occurs with other nontuberculous mycobacteria (5). The culture method used, in particular the use of antibiotics and disinfectants during sample preparation, further reduces the analytical sensitivity of in vitro culture by killing more than 2 log10 M. avium subsp. paratuberculosis cells (32). Thus, estimates of viable count or duration of survival of M. avium subsp. paratuberculosis based on culture from soil are likely to be underestimates. The duration of survival assessed in boxes containing soil and grass was comparable to that observed in pasture plots, although there were some differences, generally favoring recovery from soil in boxes. This was probably explained by the use in boxes of soil with low organic matter content. It is easier to isolate the organism from such soils than from soils of higher organic matter content (45). Boxes were a useful substitute for plots and may be used to advantage in future studies because they are simple to set up and maintain, soil type can be chosen, and contamination can be contained.
In addition to recoverability from samples and losses during culture preparation, and assuming log-linear decay, the observed duration of survival of microbes also depends on the starting level of contamination, so we attempted to standardize this between trials. However, the measurement of decay rates was also important, because these may be able to be extrapolated to situations with different starting levels of contamination.
The survival of the organism in fecal material applied to soil was greatest (55 weeks) in a fully shaded environment and was least where fecal material and soil were fully exposed to the weather and where vegetation was also removed. Vegetation provides shade at the soil surface, and in experiment 1 this explained the observation of survival for 32 weeks in plots that were not otherwise shaded. In experiment 3 the duration of survival was only 2 weeks in unshaded plots from which vegetation was removed to simulate grazing by sheep. Moderate degrees of shade were significantly protective when organisms were most numerous soon after contamination, but over a longer period a higher level of shade was required for significant protection. Factors such as moisture and soil pH did not appear to influence the duration of survival. Soil pH level has been suggested as a risk factor for Johne's diseases, through mechanisms related to iron availability (19). Iron levels in soils in plots (32 to 129 mg/kg) were higher than those in soils in boxes (12.5 to 23 mg/kg), but survival of M. avium subsp. paratuberculosis was greater in boxes than in plots. This result may be due to confounding with soil organic matter content, which was higher in plots than in boxes.
Natural rainfall was at times extremely heavy and conceptually may have caused leaching of bacteria from fecal material in all plots and the exposed boxes. However, we were unable to significantly reduce the contamination levels in fecal material in a laboratory trial in which a rainfall event of 400 mm over 4 days was simulated by repeatedly soaking pellets in water (data not shown). Therefore it is unlikely that the organism was eluted completely from fecal material in exposed plots and boxes.
M. avium subsp. paratuberculosis was isolated for up to 24 weeks from the aerial parts of grasses in this study. Following seed germination, grass shoots penetrated the surface litter and feces and presumably became contaminated with the organism in this way. The organism may then have been washed from grass shoots by rainfall. The shaded boxes at Camden were not exposed to natural rainfall and were watered very carefully by hand, which might explain the higher rate and longer duration of recovery of the organism from grass at Camden than of that from grass at Borenore.
What factors could explain the principal observation from this study that survival of M. avium subsp. paratuberculosis was favored by shade? Moisture was not a factor promoting survival. Factors apart from moisture that differed dramatically between shaded and unshaded treatments included solar radiation, soil temperature, and the diurnal range or flux of soil temperature. In a recent study of the effect of UV light on the cattle strain of M. avium subsp. paratuberculosis, the organism was irradiated while suspended in distilled water and appeared to be no more resistant than many other bacterial species (9). The following principles need to be considered: UV radiation cannot penetrate fecal pellets, and therefore it can cause only surface disinfection and cannot affect the shaded underside of pellets; pellets, being dark objects, absorb radiant energy and in turn radiate heat; heat would be conducted to deeper regions of the pellet; temperature ranges in pellets on the soil surface would be greater than those measured in soil at a depth of 1 cm; and evaporation may cool fresh fecal pellets but not dry pellets. Temperature flux stands out as an obvious factor correlated with “shade” that could affect survival of M. avium subsp. paratuberculosis.
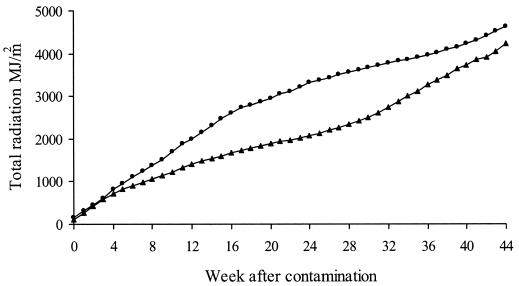
Experiments 3 and 4 began with contamination of plots and boxes in early November (presummer) or late January (end of summer), respectively. For the first 6 weeks after contamination, the survival rate of M. avium subsp. paratuberculosis in experiment 3 was more than double the rate in experiment 4. Over the same period, air and soil temperatures in experiment 3 were lower and had narrower ranges than those in experiment 4 (Fig. 6) but the differences in cumulative solar radiation were negligible (Fig. 7). These results strongly suggest that temperature flux influences survival more than solar radiation does and support our interpretation that the effect of shade is primarily through a reduction in temperature flux.
FIG. 7.
Cumulative solar radiation for experiments 3 and 4 measured at Camden and aligned by week after contamination. ▪, experiment 3, commencing 8 November 1999; ▴, experiment 4, commencing 31 January 2000.
The decay rates reported here were estimated from counts from fully shaded or partially shaded treatments, as these had a reasonable time series of culture-positive samples. These decay rates are therefore assumed to be the worst-case scenario. Although first-order kinetics for log-linear survival curves is commonly assumed for microbial inactivation, there are examples where this is not the case, and tailing of microbial survival is sometimes reported (6). Decay rates estimated from the linear regressions in this study ranged from 2.2 to 0.4 logs/month and were inversely related to the period of observation (Table 3). Differences in environment, climate, and other factors may impact decay rates such that the decline might occur in a different pattern from that seen in this study. Decay rates for unshaded locations are likely to be higher than those for shaded sites. They were inferred from starting counts of M. avium subsp. paratuberculosis in feces, and the observed durations of survival in feces consequently were highly variable, ranging from 1.1 to 7 logs/month. However, when the effect of dormancy (see below), which led to culture-positive outliers, was removed, the decay rates were more consistent (range of 3 to 7 logs/month) (Table 5) and greater than those measured for shaded locations. Inclusion of observations of the small numbers of viable organisms present following a period of dormancy is relevant when considering eradication of the organism from the environment but less relevant when considering control of the infection in livestock. The reliability of these inferred estimates for unshaded sites is unclear.
TABLE 5.
Decay rates of M. avium subsp. paratuberculosis in pellets in unshaded locations where pasture was either light or was removed to simulate grazing, inferred from starting concentrations of the organism and the observed duration of survival, which was assumed to be the closest week after the last culture-positive time point
| Expt | Site | Source | Starting concn in pellets | Assumed duration of survival (wk) | Decay (logs/mo) |
|---|---|---|---|---|---|
| 2 | Borenore | Plots | 1.2 × 10⁶ | 4 | 6 |
| 2 | Carcoar | Plots | 1.2 × 10⁶ | 6 | 3 |
| 3 | Borenore | Plots | 1.6 × 10⁵ | 3 | 5 |
| 3 | Borenore | Boxes | 1.6 × 10⁵ | 3 | 5 |
| 3 | Camden | Boxes | 1.6 × 10⁵ | 14 (3)a | 1.4 (7)a |
| 4 | Borenore | Boxes | 1.6 × 10⁵ | 18 (3) | 1.1 (7) |
| 4 | Borenore | Plots | 1.6 × 10⁵ | 12 (3) | 1.7 (7) |
| 4 | Camden | Boxes | 1.6 × 10⁵ | 14 (1) | 1.4 (5) |
Figures in parentheses ignore isolation of low numbers of organisms following the occurrence of dormancy.
In this study M. avium subsp. paratuberculosis was cultured from all fecal-soil samples collected soon after contamination, and afterwards there were a progressive reduction in the number of culture-positive samples and an increase in the incubation period required to reach peak growth index. This is consistent with a gradual decline in the viability of the organism. However, the time required to reach peak growth index tended to stabilize, often at around 9 weeks of incubation, with subsequent cultures being negative. For soils and feces, incubation periods to peak growth index greater than about 6 weeks are consistent with there being only one or several viable organisms in the sample (31). Growth index reaching a peak after this interval is suggestive of M. avium subsp. paratuberculosis cells requiring a resuscitation phase of several weeks in the culture medium prior to commencement of replication. After one or more time points at which all samples were culture negative, the organism was again recovered from soil and fecal pellets, sometimes with a reduction in the time required for cultures to reach peak growth index compared to that for earlier time points, and in some cases with a sudden increase in the proportion of culture-positive samples, coinciding with an increase in viable counts. There are four possible reasons for these observations: uneven distribution of organisms, systematic laboratory error, changes in properties of binding of the organism to feces or soil, and bacterial dormancy.
Firstly, consider uneven distribution of fecal material and a sampling effect, such that the organism was not included in all samples. This is unlikely because well-mixed feces were evenly spread by hand, all postcontamination control samples from all subplots and boxes were culture positive, the sampling method was random and was replicated, and M. avium subsp. paratuberculosis DNA was demonstrated in numerous samples of culture-negative fecal pellets. We infer the continuing presence of intact bacterial cells in these pellet samples, as extracellular DNA would have been degraded by the ubiquitous DNases from other organisms present in feces.
Secondly, systematic laboratory error influencing the sensitivity of culture (medium or operator effect) was unlikely because medium controls were used, there was little or no temporal overlap in testing batches of samples across the four experiments, and both positive- and negative-culture outcomes were obtained at common test times.
Thirdly, a physicochemical effect that causes the organism to change its binding properties with fecal material or soil components so that its availability in the culture system changes over time was unlikely within fecal pellets or soil.
The fourth explanation is dormancy of M. avium subsp. paratuberculosis cells. The data presented in this study are consistent with M. avium subsp. paratuberculosis being able to enter a dormant or viable-noncultivable state and later reverting to a vegetative form. This phenotypic property has not been reported before for M. avium subsp. paratuberculosis. Dormancy is defined as the state permitting survival of a non-spore-forming bacterial cell without requiring replication. It is genetically programmed, reversible, and induced by an unfavorable environment, classically when an essential nutrient required for growth becomes limiting. Evidence for dormancy is inability to culture the organism until the environment again becomes favorable and cells regain the ability to divide and thus become detectable (21).
In rapidly growing bacterial species dormancy is associated with expression of specific genes, at least some of which are known in mycobacteria. Oxygen depletion of cultures of M. smegmatis (12), Mycobacterium bovis (18), and M. tuberculosis (39) leads to dormancy and increased resistance to antibiotics (40). In M. tuberculoisis prolonged in vitro culture with reduced growth rate is associated with expression of heat shock proteins in the stationary phase of culture (50). Recently, Dps-like protein, which confers protection by binding to DNA during nutritional and oxidative stress in other bacteria, was identified in M. smegmatis and a homologue was found in the M. avium genome (15). An in silico investigation identified a putative sequence in M. avium subsp. paratuberculosis which contained each of the amino acid residues that form the DNA binding signature in the M smegmatis protein (Fig. 8). A second gene, relA, which is active during the stringent response of M. tuberculosis to amino acid or carbon source depletion (2), is also present in M. avium subsp. paratuberculosis (Fig. 9). These findings add weight to the proposition that M. avium subsp. paratuberculosis is capable of dormancy. However, the stimulus for dormancy in the present study is unclear apart from separation of this obligate parasite from its host with consequences inferred for access to nutrients. Similarly, there must have been an environment favorable for reversion to the vegetative state, which might have occurred in nature or might have occurred once dormant cells were added to culture media. However, the culture media alone, which were constant throughout the study, were not sufficient to resuscitate dormant cells, as there were time points in the longitudinal study at which all samples were culture negative and later time points at which some samples were culture positive.
Sporadic environmental replication of M. avium subsp. paratuberculosis is another explanation for some of the observations in this study but is less likely than dormancy. Environmental replication has not been reported for M. avium subsp. paratuberculosis and is precluded by the current taxonomic definition of the taxon (36). Further experiments, some of which may now be conducted in silico by evaluation of the M. avium subsp. paratuberculosis genome (3) for dormancy-associated genes, are indicated to evaluate dormancy in M. avium subsp. paratuberculosis.
In conclusion, M. avium subsp. paratuberculosis is capable of prolonged survival in the environment in Australia. However, under the conditions of the present study, survival was finite. Significant degrees of pasture decontamination can be achieved in a relatively short period, and this will have benefits for disease reduction in a flock or herd because of the likely beneficial effects that lower doses of M. avium subsp. paratuberculosis would have on incubation period and disease outcome (47). Eradication of the organism from pasture and soil requires very prolonged decontamination intervals. The protective effect of shade has important practical implications for control and eradication of paratuberculosis, even under the harsh environmental conditions in Australia. Pasture management, such as selective grazing with nonsusceptible hosts or mechanical slashing, may be used to maintain a relatively low level of shade at the soil surface to hasten decontamination. Dormancy of the organism appears to be a feature in the Australian environment, and this is supported by the presence of dormancy-related genes in the M. avium subsp. paratuberculosis genome. This may also have implications in vivo where survival in the intracellular environment is required.
Acknowledgments
This study was funded by Meat and Livestock Australia and NSW Agriculture.
Skilled technical assistance was provided by Elissa Choy, Scott McAllister, Vanessa Saunders, Aparna Vadali, Brian Maddaford, Christine Kearns, and Phil Slattery. Terry and Cecily Hayes, Hillwood, Goulburn; Bess Vickers, Barrawinga, Carcoar; and Australian National Field Days, Borenore, assisted us with hospitality, supply of sheep, and access to their land.
REFERENCES
- 1.Acheson, D. W. K. 2001. An alternative perspective on the role of Mycobacterium paratuberculosis in the etiology of Crohn's disease. Food Control 12:335-338. [Google Scholar]
- 2.Avarbock, D., J. Salem, L. Li, Z. Wang, and H. Rubin. 1999. Cloning and characterization of a bifunctional RelA/SpoT homologue from Mycobacterium tuberculosis. Gene 233:261-269. [DOI] [PubMed] [Google Scholar]
- 3.Bannantine, J. P., E. Baechler, Q. Zhang, L. Li, and V. Kapur. 2002. Genome scale comparison of Mycobacterium avium subsp. paratuberculosis with Mycobacterium avium subsp. avium reveals potential diagnostic sequences. J. Clin. Microbiol. 40:1303-1310. [DOI] [PMC free article] [PubMed] [Google Scholar]
- 4.Benedictus, G., J. Verhoeff, Y. H. Schukken, and J. W. Hesselink. 2000. Dutch paratuberculosis programme history, principles and development. Vet. Microbiol. 77:399-413. [DOI] [PubMed] [Google Scholar]
- 5.Brooks, R. W., K. L. George, B. C. Parker, and J. O. Falkinham. 1984. Recovery and survival of nontuberculous mycobacteria under various growth and decontamination conditions. Can. J. Microbiol. 30:1112-1117. [DOI] [PubMed] [Google Scholar]
- 6.Cerf, O. 1977. A review: tailing of survival curves of bacterial spores. J. Appl. Bacteriol. 42:1-19. [DOI] [PubMed] [Google Scholar]
- 7.Chiodini, R. J., H. J. Van Kruiningen, and R. S. Merkal. 1984. Ruminant paratuberculosis (Johne's disease): the current status and future prospects. Cornell Vet. 74:218-262. [PubMed] [Google Scholar]
- 8.Collins, D. M., D. M. Gabric, and G. W. de Lisle. 1990. Identification of two groups of Mycobacterium paratuberculosis strains by restriction endonuclease analysis and DNA hybridization. J. Clin. Microbiol. 28:1591-1596. [DOI] [PMC free article] [PubMed] [Google Scholar]
- 9.Collins, M. T., U. Spahr, and P. M. Murphy. 2001. Ecological characteristics of M. paratuberculosis, p. 32-40. In Bulletin of the International Dairy Federation no. 362/2001. International Dairy Federation, Brussels, Belgium.
- 10.Cousins, D. V., R. J. Whittington, I. Marsh, A. Masters, R. J. Evans, and P. Kluver. 1999. Mycobacteria distinct from Mycobacterium avium subsp. paratuberculosis isolated from the faeces of ruminants possess IS900-like sequences detectable by IS900 polymerase chain reaction: implications for diagnosis. Mol. Cell. Probes 14:431-442. [DOI] [PubMed] [Google Scholar]
- 11.de Lisle, G. W., G. F. Yates, and D. M. Collins. 1993. Paratuberculosis in farmed deer: case reports and DNA characterisation of isolates of Mycobacterium paratuberculosis. J. Vet. Diagn. Investig. 5:567-571. [DOI] [PubMed] [Google Scholar]
- 12.Dick, T., B. H. Lee, and B. Murugasu-Oei. 1998. Oxygen depletion induced dormancy in Mycobacterium smegmatis. FEMS Microbiol. Lett. 163:159-164. [DOI] [PubMed] [Google Scholar]
- 13.Eamens, G. J., S. A. Spence, and M. J. Turner. 2001. Survival of Mycobacterium avium subsp. paratuberculosis in amitraz cattle dip fluid. Aust. Vet. J. 79:703-706. [DOI] [PubMed] [Google Scholar]
- 14.Gilmour, A. R., B. R. Cullis, S. J. Welham, and R. Thompson. 1999. ASReml reference manual. Biometric bulletin no. 3. NSW Agriculture, Orange Agricultural Institute, Orange, Australia.
- 15.Gupta, S., S. B. Pandit, N. Srinivasan, and D. Chatterji. 2002. Proteomics analysis of carbon-starved Mycobacterium smegmatis: induction of Dps-like protein. Protein Eng. 15:503-511. [DOI] [PubMed] [Google Scholar]
- 16.Henikoff, S., and J. G. Henikoff. 1992. Amino acid substitution matrices from protein blocks. Proc. Natl. Acad. Sci. USA 89:10915-10919. [DOI] [PMC free article] [PubMed] [Google Scholar]
- 17.Hermon-Taylor, J. 2001. Mycobacterium avium subspecies paratuberculosis: the nature of the problem. Food Control 12:331-334. [Google Scholar]
- 18.Hutter, B., and T. Dick. 1999. Up-regulation of narX, encoding a putative ‘fused nitrate reductase' in anaerobic dormant Mycobacterium bovis BCG. FEMS Microbiol. Lett. 178:63-69. [DOI] [PubMed] [Google Scholar]
- 19.Johnson-Ifearulundu, Y., and J. B. Kaneene. 1999. Distribution and environmental risk factors for paratuberculosis in dairy cattle herds in Michigan. Am. J. Vet. Res. 60:589-596. [PubMed] [Google Scholar]
- 20.Jorgensen, J. B. 1977. Survival of Mycobacterium paratuberculosis in slurry. Nord. Vetmed. 29:267-270. [PubMed] [Google Scholar]
- 21.Kaprelyants, A. S., J. C. Gottschal, and D. B. Kell. 1993. Dormancy in non-sporulating bacteria. FEMS Microbiol. Rev. 104:271-286. [DOI] [PubMed] [Google Scholar]
- 22.Katayama, N., C. Tanaka, T. Fujita, Y. Saitou, S. Suzuki, and E. Onouchi. 2000. Effect of ensilage on inactivation of M. avium subsp. paratuberculosis. Grass Sci. 46:282-288. [Google Scholar]
- 23.Katayama, N., C. Tanaka, T. Fujita, T. Suzuki, S. Watanabe, and S. Suzuki. 2001. Effect of silage fermentation and ammonia treatment on activity of M. avium subsp. paratuberculosis. Grass Sci. 47:296-299. [Google Scholar]
- 24.Kennedy, D. J., and M. B. Allworth. 2000. Progress in national control and assurance programs for bovine Johne's disease in Australia. Vet. Microbiol. 77:443-451. [DOI] [PubMed] [Google Scholar]
- 25.Larsen, A. B., R. S. Merkal, and T. H. Vardaman. 1956. Survival time of Mycobacterium paratuberculosis. Am. J. Vet. Res. 17:549-551. [PubMed] [Google Scholar]
- 26.Lovell, R., M. Levi, and J. Francis. 1944. Studies on the survival of Johne's bacilli. J. Comp. Pathol. 54:120-129. [Google Scholar]
- 27.Marsh, I. B., and R. J. Whittington. 2001. Progress towards a rapid polymerase chain reaction diagnostic test for the identification of Mycobacterium avium subsp. paratuberculosis in faeces. Mol. Cell. Probes 15:105-118. [DOI] [PubMed] [Google Scholar]
- 28.Needleman, S. B., and C. D. Wunsch. 1970. A general method applicable to the search for similarities in the amino acid sequence of two proteins. J. Mol. Biol. 48:443-453. [DOI] [PubMed] [Google Scholar]
- 29.Olsen, J. E., J. B. Jorgensen, and P. Nansen. 1985. On the reduction of Mycobacterium paratuberculosis in bovine slurry subjected to batch mesophilic or thermophilic anaerobic digestion. Agric. Wastes 13:273-280. [Google Scholar]
- 30.Penberthy, J. 1912. The treatment of grass land with a view to the elimination of disease. J. R. Agric. Soc. 73:73-90. [Google Scholar]
- 31.Reddacliff, L. A., P. J. Nicholls, A. Vadali, and R. J. Whittington. 2003. Use of growth indices from radiometric culture for quantitation of sheep strains of Mycobacterium avium subsp. paratuberculosis. Appl. Environ. Microbiol. 69:3510-3516. [DOI] [PMC free article] [PubMed] [Google Scholar]
- 32.Reddacliff, L. A., A. Vadali, and R. J. Whittington. 2003. The effect of decontamination protocols on the numbers of sheep strain Mycobacterium avium subsp. paratuberculosis isolated from tissues and faeces. Vet. Microbiol. 95:271-282. [DOI] [PubMed] [Google Scholar]
- 33.Richards, W. D. 1981. Effects of physical and chemical factors on the viability of Mycobacterium paratuberculosis. J. Clin. Microbiol. 14:587-588. [DOI] [PMC free article] [PubMed] [Google Scholar]
- 34.Richards, W. D., and C. O. Thoen. 1977. Effect of freezing on the viability of Mycobacterium paratuberculosis in bovine feces. J. Clin. Microbiol. 6:392-395. [DOI] [PMC free article] [PubMed] [Google Scholar]
- 35.Stuart, P. 1965. A pigmented M. johnei strain of bovine origin. Br. Vet. J. 121:332-334. [DOI] [PubMed] [Google Scholar]
- 36.Thorel, M. F., M. Krichevsky, and V. V. Levy-Frebault. 1990. Numerical taxonomy of mycobactin-dependent mycobacteria, emended description of Mycobacterium avium, and description of Mycobacterium avium subsp. avium subsp. nov., and Mycobacterium avium subsp. paratuberculosis subsp. nov., and Mycobacterium avium subsp. silvaticum subsp. nov. Int. J. Syst. Bacteriol. 40:254-260. [DOI] [PubMed] [Google Scholar]
- 37.Verbyla, A. P., B. R. Cullis, M. G. Kenward, and S. J. Welham. 1999. The analysis of designed experiments and longitudinal data by using smoothing splines (with discussion). Appl. Stat. 48:269-311. [Google Scholar]
- 38.Vishnevskii, P. P., E. G. Mamatsev, V. V. Chernyshev, and N. S. Chernyshev. 1940. The viability of the bacillus of Johne's disease. Sov. Vet. 11-12:89-93. [Cited by C. Wray, Vet. Bull. 45:543-550, 1975.] [Google Scholar]
- 39.Wayne, L. G., and L. G. Hayes. 1996. An in vitro model for sequential study of shiftdown of Mycobacterium tuberculosis through two stages of nonreplicating persistence. Infect. Immun. 64:2062-2069. [DOI] [PMC free article] [PubMed] [Google Scholar]
- 40.Wayne, L. G., and H. A. Sramek. 1994. Metronidazole is bactericidal to dormant cells of Mycobacterium tuberculosis. Antimicrob. Agents Chemother. 38:2054-2058. [DOI] [PMC free article] [PubMed] [Google Scholar]
- 41.Whittington, R. J., S. Fell, D. Walker, S. McAllister, I. Marsh, E. Sergeant, C. A. Taragel, D. J. Marshall, and I. J. Links. 2000. Use of pooled fecal culture for sensitive and economic detection of Mycobacterium avium subsp. paratuberculosis infection in flocks of sheep. J. Clin. Microbiol. 38:2550-2556. [DOI] [PMC free article] [PubMed] [Google Scholar]
- 42.Whittington, R. J., A. F. Hope, D. J. Marshall, C. A. Taragel, and I. Marsh. 2000. Molecular epidemiology of Mycobacterium avium subsp. paratuberculosis: IS900 restriction fragment length polymorphism and IS1311 polymorphism analyses of isolates from animals and a human in Australia. J. Clin. Microbiol. 38:3240-3248. [DOI] [PMC free article] [PubMed] [Google Scholar]
- 43.Whittington, R. J., I. Marsh, S. McAllister, M. J. Turner, D. J. Marshall, and C. A. Fraser. 1999. Evaluation of modified BACTEC 12B radiometric medium and solid media for the culture of Mycobacterium avium subsp. paratuberculosis from sheep. J. Clin. Microbiol. 37:1077-1083. [DOI] [PMC free article] [PubMed] [Google Scholar]
- 44.Whittington, R. J., I. Marsh, M. J. Turner, S. McAllister, E. Choy, G. J. Eamens, D. J. Marshall, and S. Ottaway. 1998. Rapid detection of Mycobacterium paratuberculosis in clinical samples from ruminants and in spiked environmental samples by modified BACTEC 12B radiometric culture and direct confirmation by IS900 PCR. J. Clin. Microbiol. 36:701-707. [DOI] [PMC free article] [PubMed] [Google Scholar]
- 45.Whittington, R. J., I. B. Marsh, P. J. Taylor, D. J. Marshall, C. Taragel, and L. A. Reddacliff. 2003. Isolation of Mycobacterium avium subsp. paratuberculosis from environmental samples collected from farms before and after destocking sheep with paratuberculosis. Aust. Vet. J. 81:559-563. [DOI] [PubMed] [Google Scholar]
- 46.Whittington, R. J., L. A. Reddacliff, I. Marsh, S. McAllister, and V. Saunders. 2000. Temporal patterns and quantification of excretion of Mycobacterium avium subsp. paratuberculosis in sheep with Johne's disease. Aust. Vet. J. 78:34-37. [DOI] [PubMed] [Google Scholar]
- 47.Whittington, R. J., and E. S. G. Sergeant. 2001. Progress towards understanding the spread, detection and control of Mycobacterium avium subsp. paratuberculosis in animal populations. Aust. Vet. J. 79:267-278. [DOI] [PubMed] [Google Scholar]
- 48.Whittington, R. J., and C. A. Taragel. 2000. Cross-species transmission of ovine Johne's disease—phase 1. Final report to Meat and Livestock Australia. NSW Agriculture, Camden, Australia.
- 49.Whittington, R. J., C. A. Taragel, S. Ottaway, I. Marsh, J. Seaman, and V. Fridriksdottir. 2000. Molecular epidemiological confirmation of occurrence of sheep (S) strains of Mycobacterium avium subsp. paratuberculosis in cases of paratuberculosis in cattle in Australia and sheep and cattle in Iceland. Vet. Microbiol. 79:311-322. [DOI] [PubMed] [Google Scholar]
- 50.Yuan, Y., D. D. Crane, and C. E. Barry III. 1996. Stationary phase-associated protein expression in Mycobacterium tuberculosis: function of the mycobacterial α-crystallin homolog. J. Bacteriol. 178:4484-4492. [DOI] [PMC free article] [PubMed] [Google Scholar]


