Abstract
We describe a remote sensing and GIS-based study that has three objectives: (1) characterize fine particulate matter (PM2.5), insolation and land surface temperature using NASA satellite observations, EPA ground-level monitor data and North American Land Data Assimilation System (NLDAS) data products on a national scale; (2) link these data with public health data from the REasons for Geographic And Racial Differences in Stroke (REGARDS) national cohort study to determine whether these environmental risk factors are related to cognitive decline, stroke and other health outcomes; and (3) disseminate the environmental datasets and public health linkage analyses to end users for decision-making through the Centers for Disease Control and Prevention (CDC) Wide-ranging Online Data for Epidemiologic Research (WONDER) system. This study directly addresses a public health focus of the NASA Applied Sciences Program, utilization of Earth Sciences products, by addressing issues of environmental health to enhance public health decision-making.
Keywords: remote sensing, GIS, fine particulates, insolation, heat, public health
1. Introduction
A major challenge in studying the relationship between air pollution, heat or sunlight exposure and human health outcomes is characterization of population-level or individual-level exposures. Human exposure measurements are typically estimated by relying on environmental measures available from ground-based meteorological and ambient air monitoring networks. Although ground-based monitors provide the best characterization of heat and pollutant concentration levels at the specific places and times they are available, temporal and spatial gaps in these data can limit their applicability for exposure assessment in health studies. Available fixed-site meteorological and air quality monitoring stations tend to be located strategically in areas where population density is high. Thus, many epidemiology studies examining the association between the environment and health have had to rely on measurements from stationary monitoring sites located at substantial distances from where study participants actually live or work. Moreover, the frequency of measurement at the fixed sites varies from hourly to once every several days across monitoring sites. One promising method for characterizing environmental exposure for public health practice and epidemiologic research is the integration of remote sensing satellite systems data with monitoring network data. Use of remotely sensed data can be helpful for filling the temporal and spatial gaps found with ground-level monitor data.
Among the components of air pollution, there is a rapidly developing interest in the role of fine particulate matter with aerodynamic diameter less than or equal to 2.5 micrometers (PM2.5) as a potential major contributor to vascular health and cognitive decline (Brook et al. 2004). Human observation studies show that exposure to general pollution containing PM2.5 leads to altered regulation of biomarkers involved in cognitive function, the pathology of diseases such as Alzheimer’s and Parkinson’s, and neurological inflammation and oxidation (Weuve 2012; Calderon-Garciduenas et al. 2003, 2004, 2007, 2008). PM2.5 is also emerging as a possible risk factor for cardiovascular diseases (Wellenius 2012; Brook 2007; Walker and Mouton 2008). Recent research has also shown that serotonin regulation, melatonin regulation, and cerebral blood flow, mechanisms that are involved in the relationship between sunlight and light therapy and mood, are also involved in cognition, suggesting that cognitive function may also be influenced by sunlight exposure (Srinivasan et al. 2006; Winkler et al. 2006). In addition, there is growing evidence that outdoor temperature is a leading factor for seasonal fluctuations in blood pressure (Kent et al. 2011; Alperovitch et al. 2009). Thus, improving the understanding of the relationship between particulate matter, sunlight or heat exposure and health outcomes such as cognitive function, stroke and hypertension will allow the public health community to make decisions that will benefit our society as a whole, and serve as examples of approaches that can be generalized to allow the assessment of other environmental exposures.
Use of satellite remote sensing in conjunction with air monitoring network data is proving very useful to characterize PM2.5, sunlight or heat exposure for public health practice and epidemiologic research (Kent et al. 2011; Al-Hamdan et al. 2009; Kent et al. 2009; Liu et al. 2007; Koelemeijer et al. 2006; Al-Saadi et al. 2005; and Engel-Cox et al. 2004). Data retrieved by space-borne sensors can be useful in filling the temporal and spatial gaps found with ground-level monitor data. Satellite data, with their synoptic perspective, cover large geographic areas at moderate spatial resolution for multiple years and with reliable repeated measurements.
In the study reported here, high-quality national spatial data sets of PM2.5, sunlight and heat related products were developed, linked with data related to cognitive decline and other health outcomes from the REasons for Geographic And Racial Differences in Stroke (REGARDS) study, and integrated into the CDC Wide-ranging Online Data for Epidemiologic Research (WONDER) system. This provides a very beneficial addition to CDC WONDER, allowing public health researchers and policy makers to efficiently and effectively include environmental exposure data in the context of other health data available in the WONDER online system and to link these data with state and local public health datasets.
2. Goals and Objectives
This project has the following overall goals in decision-making activities:
To provide information to decision makers to determine associations between environmental exposures and cognitive decline, stroke and other health outcomes in a large national cohort study;
To enrich the CDC WONDER system through the addition of a number of national environmental datasets developed with utilization of NASA remotely-sensed data.
These goals are intrinsic to the NASA Applied Sciences Public Health Program which focuses on Earth science applications of remote sensing data to public health, particularly regarding infectious disease, emergency preparedness and response, and environmental health issues. They also address concerns expressed in the National Research Council Decadal Survey (NRC, 2007) regarding the need for continued work to firmly establish the predictive relationships between remotely-sensed environmental data and patterns of environment-related health effects. The detailed objectives of this project can be summarized as following:
-
Develop high-quality daily spatial data sets of environmental variables for the conterminous United States (U.S.) for the years 2003–2008 utilizing data from NASA and other sources:
Fine particulate matter (PM2.5) (NASA MODerate-resolution Imaging Spectroradiometer (MODIS) and U.S. EPA’s Air Quality System (AQS));
Land Surface Temperature (LST) (NASA MODIS);
Incoming Solar Radiation (Insolation) and heat-related products (North American Land Data Assimilation System (NLDAS));
-
Link these environmental variables with public health data from a national cohort study of 30,229 participants from REGARDS and examine relationships between each of the environmental datasets and:
Cognitive function;
Stroke;
Secondary outcomes, such as inflammation, hyperlipidemia and hypertension
Disseminate the environmental datasets and public health linkage analysis results to local, state and federal end-user public health groups through the CDC WONDER online system and through peer-reviewed publications.
3. Methodology
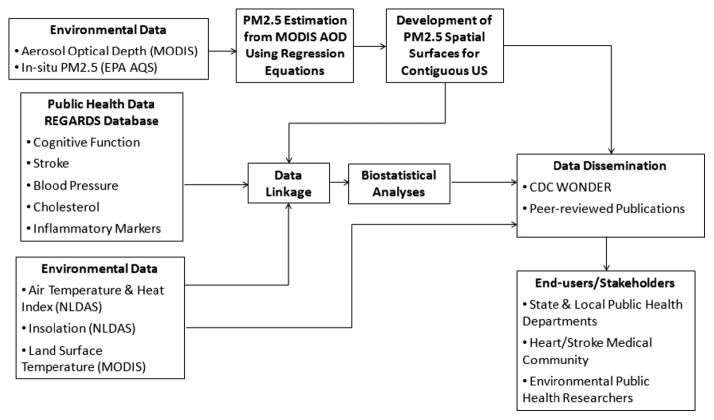
As shown in Figure 1, remotely-sensed data from MODIS LST and AOD products are used in conjunction with EPA ground observations and Daily Insolation (DI), and heat-related data from NLDAS to develop national environmental data products for linkage to and analysis of public health data from the REGARDS cohort study. Three daily environmental data sets were developed for the conterminous U.S. on different spatial resolutions for the period 2003–2008: (1) spatial surfaces of estimated PM2.5 exposures on a 10-km grid using the US Environmental Protection Agency (EPA) ground observations and NASA’s MODIS data; (2) a 1-km grid of LST using MODIS data; and (3) a 12-km grid of DI and heat-related products using the NLDAS forcing data.
Figure 1.
Methodology of research and data development and dissemination.
The above remote sensing-related data sets were linked with public health data from the REGARDS study to determine whether exposures to these environmental risk factors are related to cognitive decline, stroke, hypertension, hyperlipidemia (high cholesterol) and/or inflammation. The environmental datasets are publically disseminated through the CDC WONDER system, and the results from the public health linkage analyses have been distributed through peer-reviewed publications for access by end users for decision-making. These decision-makers may include state and local public health departments and environmental public health researchers.
4. Environmental Products
4.1 Fine Particulates (PM2.5)
Several studies such as Al-Hamdan et al. (2009), Zhang et al. (2009), Wang and Christopher (2003) and Gupta et al. (2006; 2008) have developed linear regression models for estimating PM2.5 concentrations from remotely-sensed AOD. Others such as Liu et al. (2005; 2007) and Paciorek et al. (2008) have added meteorological parameters as independent variables in addition to remotely-sensed AOD and developed multiple regression models or generalized additive models to estimate PM2.5 concentrations. McMillan et al. (2010) developed a hierarchical Bayesian model (HBM) for PM2.5 that combined EPA monitoring data and Community Multi-scale Air Quality (CMAQ) numerical model output to improve spatial prediction, and Garcia et al. (2006) used an HBM space-time model to estimate PM2.5 by giving more weight to monitoring data in monitored areas and relying on numerical model output and remotely-sensed data in non-monitored areas. In addition to that weighting capability, the original B-spline regional surfacing algorithm of Al-Hamdan et al. (2009) that is nationally expanded in this paper included methods for MODIS-estimated PM2.5 bias adjustment, AQS PM2.5 quality control, and merging AQS and MODIS-estimated PM2.5 to generate continuous PM2.5 spatial surfaces. B-spline is a noninterpolating surface-fitting technique, the recursion of which provides a robust methodology for datasets with mixtures of data-sparse and data-rich regions, a common condition with many environmental and health datasets. Also, unlike interpolating techniques, B-spline does not involve the unrealistic assumption that that the maxima and minima can occur only at the observation points.
To that end, daily Aqua MODIS Aerosol Optical Depth (AOD) data for the conterminous U.S. were acquired for the period of 2003–2008 from NASA’s Atmosphere Archive and Distribution System using the Warehouse Inventory Search Tool that has been recently replaced by the “Reverb” tool. The data processing produced a national dataset. Part of the processing was also to estimate ground-level PM2.5 from MODIS AOD using regression equations per EPA region per season that were adopted from Zhang et al. (2009), who found that the estimation of ground-level PM2.5 from MODIS AOD using seasonal regression relations derived for each region is more accurate than that using a fixed ratio between PM2.5 and AOD. The EPA AQS PM2.5 data were obtained and processed for the conterminous U.S. for this time period. Given the potential spatial and temporal gaps in both the EPA and MODIS data, the regional B-spline surfacing algorithm of Al-Hamdan et al. (2009) was then modified and used to generate continuous spatial surfaces of daily PM2.5 on a 10-km grid for the conterminous U.S. as illustrated in Figure 2.
Figure 2.
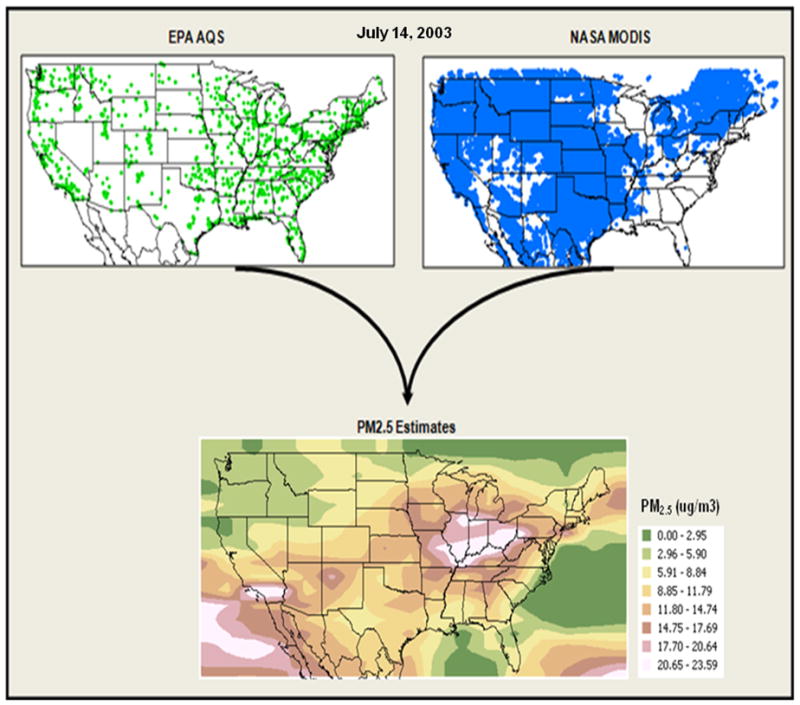
Example of PM2.5 surface for July 14, 2003.
Prior to creating the PM2.5 daily spatial surfaces, a QC procedure for the EPA AQS data and a bias adjustment procedure for the MODIS data were applied. The QC procedure uses observations from surrounding sites in a non-parametric rank-order spatial analysis to identify and eliminate anomalous measurements; otherwise their effect on the generated spatial surfaces would be over a much larger extent than the local phenomenon warranted. The procedure is based on a spatial analysis in which a corroborative neighbors statistic (CNS), predetermined on the basis of a rank-order spatial analysis of the monitoring values, was used to filter the raw data. The CNS was determined by finding the five stations (i.e., neighbors) nearest the test observation. The ratio of the test observation value to the value of the five neighbors was then calculated. After that, the ratio closest to 1 (i.e., most similar neighbor to the test observation) was identified for all observations within the study region. Finally, the ratios were binned within an increment of 0.025 and the bin frequencies were plotted on a logarithmic scale. The 95th percentile of all CNS values was used to filter the AQS raw data. The test station was removed from the dataset if all five closest neighbors have values larger than 95th percentile times the test observation, or all five closest neighbors have values smaller than the test observation divided by the 95th percentile.
The bias adjustment procedure was developed to account for potential biases in the MODIS-derived PM2.5 estimates due to the indirect nature of the observation and the imperfect relationship between AOD and PM2.5. More details about the quality control and bias adjustment procedures can be found at Al-Hamdan et al. (2009).
4.2 Land Surface Temperature (LST)
Aqua and Terra daytime and nighttime LST data for 2003–2008 for the conterminous United States (CONUS) and surrounding areas were downloaded from NASA’s Land Processes Distributed Active Archive Center (DAAC) using the Warehouse Inventory Search Tool. The MODIS Reprojection Tool was used to extract daily LST data from multiple grid tiles and to mosaic the data onto a 1-km CONUS spatial grid that consists of 3280 rows and 5158 columns. Monthly and seasonal mean Aqua and Terra LSTs were then generated, and Aqua-Terra differences were computed separately for each season and for daytime and nighttime overpasses. Merged Aqua-Terra daily LST data were generated for each day and night in 2003–2008 by filling in data gaps in the Aqua LST gridded fields using Terra data, where available, adjusted with the respective day or night difference grid for the season. More details about this merged dataset and the methodology used can be found at Crosson et al. (2012). An example of Aqua, Terra and merged LST grids is given in Figure 3.
Figure 3.
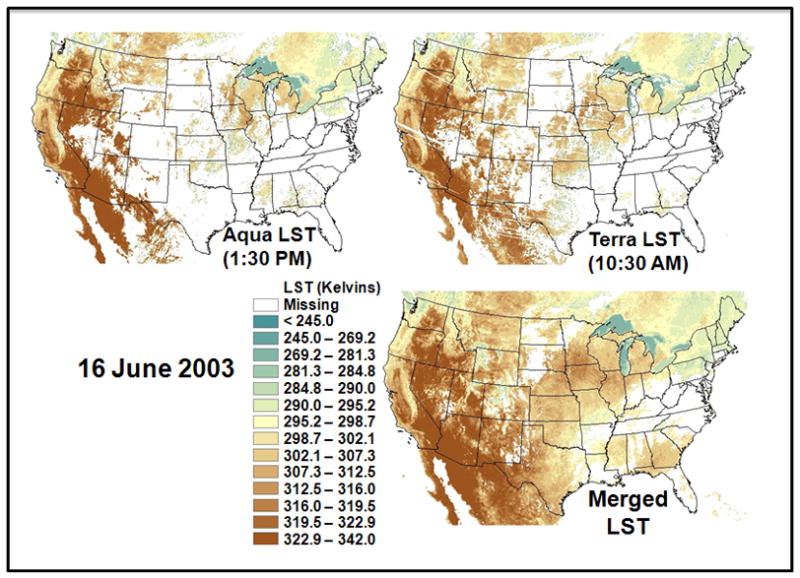
Example of LST merged product for June 16, 2003.
4.3 NLDAS Forcing Data
The non-precipitation land-surface forcing fields for NLDAS are derived from the analysis fields of the National Centers for Environmental Prediction (NCEP) North American Regional Reanalysis (NARR). NARR analysis fields are 32-km spatial resolution and 3-hourly temporal frequency. Those NARR fields that are used to generate NLDAS forcing fields are spatially interpolated to the finer resolution of the NLDAS 1/8th-degree grid (~ 12 km) and then temporally disaggregated to the NLDAS hourly frequency (Cosgrove et al., 2003). The NLDAS hourly data used in this study were acquired as part of the mission of NASA’s Earth Science Division and archived and distributed by the Goddard Earth Sciences (GES) Data and Information Services Center (DISC). We computed daily maximum and minimum air temperature, maximum Heat Index, and daily insolation for 2003–2008 using the hourly NLDAS data for this time period. Examples of these data are illustrated in Figures 4 and 5.
Figure 4.
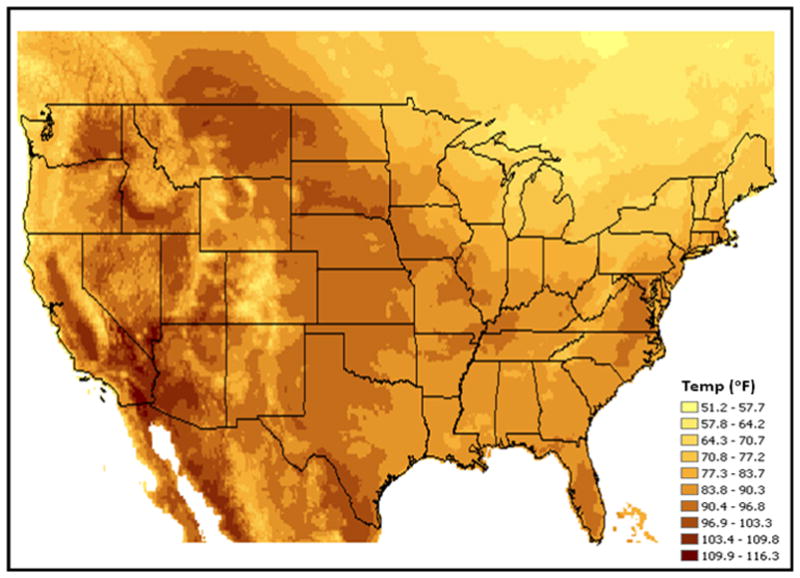
Example of NLDAS-based daily maximum air temperature for July 15, 2008.
Figure 5.
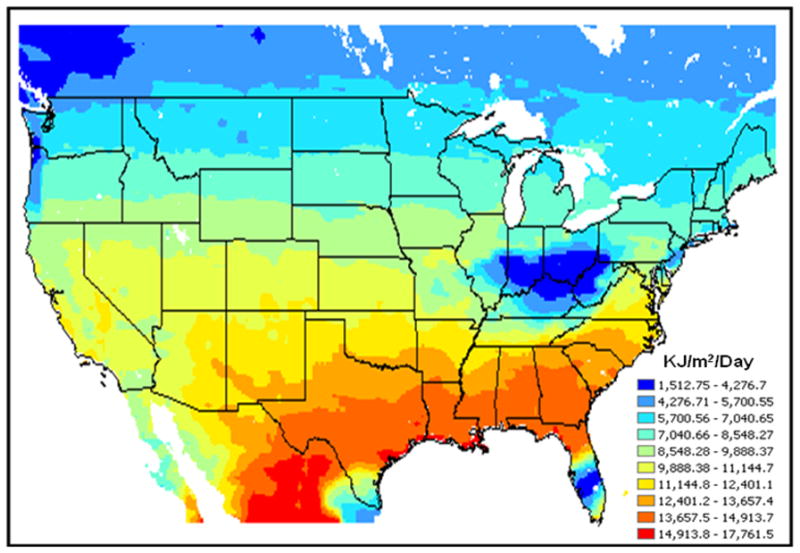
Example of NLDAS-based daily insolation for January 1, 2008.
5. Environmental Health Data Linkage
PM2.5, daily minimum and maximum air temperatures and DI estimates were spatially linked with the participants from the REGARDS study in a Geographic Information System (GIS) on the individual level at the geographic coordinates of the participants’ residences at baseline.
The REGARDS study is a national population-based longitudinal study that has recruited 30,229 participants 45 years of age or older, with 45% male, 55% female; 42% black and 58% white (Howard et al. 2003) (Figure 6). Recruitment of the cohort began in February, 2003, and was completed in October, 2007. Baseline data, including demographics, smoking history, cardiovascular risk factor history, and others, were collected via a computer-assisted telephone interview. Following completion of the baseline interview, an in-home visit was performed in order to collect physical measurements, including blood pressure, blood and urine samples. Follow-up phone contact is made at six-month intervals in order to assess likely stroke events. During annual follow-up phone contacts, cognitive function is assessed using a battery of tests. All REGARDS participants are geo-coded for geographic identification. Participants were geo-coded to their home address using the SAS/GIS batch geocoding. Geo-coding information was validated against a commercially available program (www.geocode.com) using the Haversine formula, and high agreement between the two methods was found.
Figure 6.
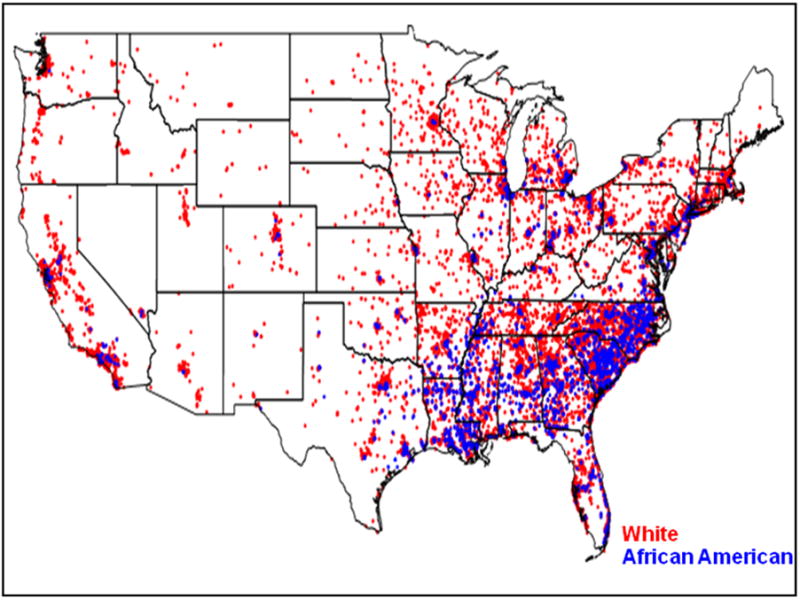
REGARDS National Cohort Study Distribution.
The linked data sets consisted of annual tables that included participant ID and the associated daily minimum and maximum air temperatures, insolation and PM2.5 for one year (one table per environmental variable). The value of the environmental data was defined by the value of the MODIS, NLDAS or PM2.5 grid point that contains the REGARDS participant’s residence location. The procedure does not depend on the spatial resolution of the environmental data and was followed in linking each of the environmental data sets with the health data. The environmental data by participant ID were then sorted and merged with the corresponding REGARDS health data. The data were then filtered by the date of the baseline interview and by the date of each follow-up interview so that only necessary measures for that particular participant were retained. Figure 7 shows the distribution of each of PM2.5, temperature and DI among the REGARDS participants. Each of PM2.5, temperature and DI were computed as the two-week average value prior to the participants’ baseline visit. Analyses are currently in process using the linked datasets to determine whether exposure to PM2.5 or DI is related to the rate of cognitive decline and/or stroke incidence among participants in the REGARDS study, independent of other known risk factors for these health outcomes. We are currently examining the relationships between the estimated PM2.5 and DI and other health-related conditions among REGARDS participants, including hypertension, hyperlipidemia, diminished kidney function, and inflammation (measured by C-reactive protein). Each of these analyses will be published separately in appropriate disease-specific journals.
Figure 7.
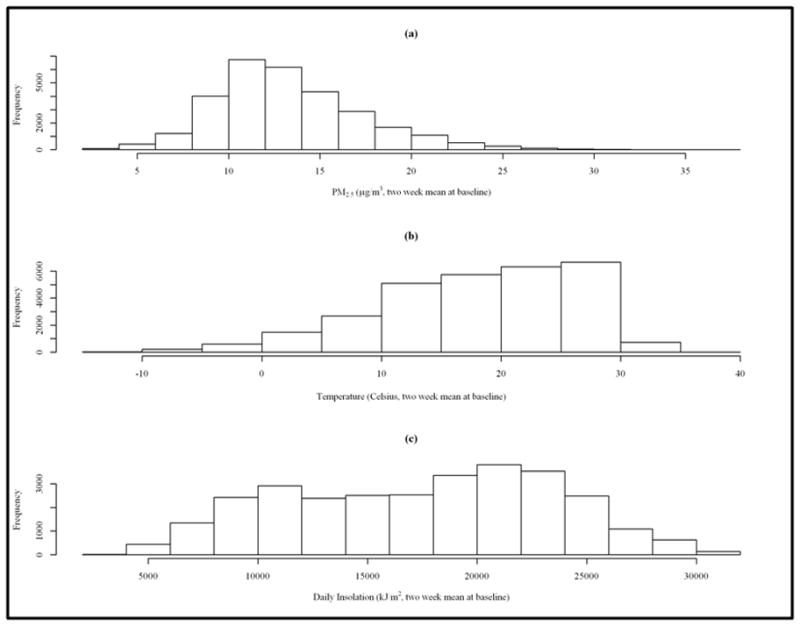
Distribution of (a) PM2.5 (b) Temperature and (c) Daily Insolation among REGARDS Participants.
6. Data Dissemination to End Users
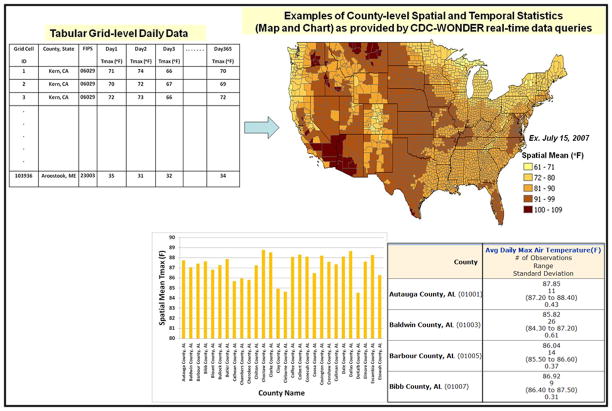
National environmental exposure datasets (PM2.5, LST, daily minimum and maximum air temperatures and DI) were made available to public health professionals, researchers and the general public via the CDC WONDER web site (http://wonder.cdc.gov/) as an “online database” for each data product. Using Federal Information Processing (FIPS) codes, the provided gridded datasets can there be aggregated (i.e. averaged) to the county, state, or regional level as per users’ needs and downloaded in tabular, graphical and map formats (Figure 8). This allows public health researchers and policy makers to use these environmental exposure data in the context of other health data available in the CDC WONDER online system. It also permits linking these data with state and local public health datasets. By doing so, researchers worldwide will have the opportunity to link these datasets to their unique public health outcomes data and further the understanding of how each of these exposures -- PM2.5, temperature and DI --contribute to morbidity and mortality.
Figure 8.
Illustration of Data Dissemination via CDC WONDER.
7. Limitations of this Work
As with all research, ours is not without limitations. One of the limitations of the PM2.5 surface-fitting model is the difficulty of incorporating meteorological factors such as wind velocity, which affects the advection of particulates from point sources within the region; the mixing height of the atmosphere, which significantly affects the environmental hazard distribution (Gupta et al., 2006; Paciorek et al., 2008; Joffre et al., 2001); and RH, which significantly affects the size of the hygroscopic particles and the light extinction efficiency. The MODIS column measurements used in this study could be combined in future work with profile information provided by satellites like the Cloud-Aerosol Lidar and Infrared Pathfinder Satellite Observation (CALIPSO) to provide a more robust remotely-sensed dataset. Also, new algorithms designed to provide better AOD retrievals in regions of sparse vegetation such as Hsu et al. (2004) could be applied to improve PM2.5 estimates in the western United States.
A limitation in using land surface temperature for assessing the health impacts of extreme heat is that heat stress is caused primarily by the temperature of the near-surface air, which is not equivalent to LST. Temporally and spatially, changes in air temperature closely track LST variations, but LST exhibits highly amplified diurnal and spatial patterns compared to air temperature. Especially in urban or sparsely-vegetated areas, the diurnal range of LST can be greater than 40 Kelvins, while the diurnal air temperature range rarely exceeds 25 Kelvins. At the 1 km resolution of the MODIS LST data, some of the most extreme LST variations, such as those of dark pavement materials, are averaged out, but still the LST variations exaggerate the human heat exposure. Another limitation of LST in this context is that temperature alone does not wholly indicate the risk of extreme heat; the humidity of the air plays a large role. While the LST products do not hold humidity information, the NLDAS data have been used to create a daily maximum heat index product, which reflects the combined effects of heat and humidity.
A limitation of any gridded data set for assessing public health impacts resides in its spatial resolution, which in this project is 1 km for MODIS LST, 10 km for PM2.5 and 12 km for the NLDAS products. At 1 km, ‘neighborhood’ scale variations are well-captured. However, at 10–12 km scales, these patterns are not represented accurately. For example, very high PM2.5 values associated with highway corridors or wildfires may be unreported or under-estimated in this data set. Meteorological fields of insolation and heat are somewhat more spatially uniform, and the 12 km NLDAS scale generally captures these variations, with the exception of some urban micro-climates. Further, by linking each of the products with the REGARDS participants at the level of their home address, we assume that they are actually in residence at that address, and that the time the participants spend out of doors is sufficient to expose them to levels that are measured by satellite. Thus, there is the possibility of exposure misclassification.
8. Summary
The three major outcomes of this project are: (1) several new standardized data products were created, including daily products of PM2.5, insolation, land surface temperature and air temperature using NASA satellite observations, EPA ground level monitor data and NLDAS data products on a national scale for 2003–2008; (2) linkages of these data with public health data from REGARDS cohort was performed to determine whether these environmental risk factors are related to cognitive decline, stroke, and other related health conditions such as hypertension, hyperlipidemia and inflammation; and (3) dissemination of these national environmental datasets to end users through the CDC WONDER online system was accomplished, and results from the public health linkage analyses are being disseminated through peer-reviewed publications. Completion of this research in terms of the biostatistical analyses of the linked datasets will provide insight into important public health problems that will persist and become more predominant in the future. This effort also provides an outstanding addition to the CDC WONDER online system, allowing public health researchers and policy makers to have better access to, and be able to include environmental exposure data in the context of other WONDER health data and link these data with state and local public health datasets. The integration of these data with CDC WONDER substantially expands public access to NASA data, thereby facilitating their use by a wider community of public health officials and policy and decision-makers.
References
- Al-Hamdan M, Crosson W, Limaye A, Rickman D, Quattrochi D, Estes M, Qualters J, Sinclair A, Tolsma D, Adeniyi K, Niskar A. Methods for Characterizing Fine Particulate Matter Using Ground Observations and Satellite Remote-Sensing Data: Potential Use for Environmental Public Health Surveillance. Journal of the Air & Waste Management Association. 2009;59:865–881. doi: 10.3155/1047-3289.59.7.865. [DOI] [PubMed] [Google Scholar]
- Alperovitch A, Lacombe JM, Hanon O, Dartigues JF, Ritchie K, Ducimetiere P, Tzourio C. Relationship between blood pressure and outdoor temperature in a large sample of elderly individuals: the Three- City study. Arch Intern Med. 2009;169:75–80. doi: 10.1001/archinternmed.2008.512. [DOI] [PubMed] [Google Scholar]
- Brook RD. Is air pollution a cause of cardiovascular disease? Updated review and controversies. Rev Environ Health. 2007;22(2):115–37. doi: 10.1515/reveh.2007.22.2.115. [DOI] [PubMed] [Google Scholar]
- Calderon-Garciduenas L, Maronpot RR, Torres-Jardon R, Henriquez-Roladan C, Schoonhovan R, Acuna-Ayala H, Villarreal-Calderon A, Nakamura J, Fernando R, Reed W, Zaazrelli B, Swenberg JA. DNA damage in nasal and brain tissues of canines exposed to air pollutants is associated with evidence of chronic brain inflammation and neurodegeneration. Toxicol Pathol. 2003;31(5):524–38. doi: 10.1080/01926230390226645. [DOI] [PubMed] [Google Scholar]
- Calderon-Garciduenas L, Reed W, Maronpot RR, Henriquez-Roldan C, Delgado-Chavez R, Calderon-Garciduenas A, Dragustinovis I, Franco-Lira M, Aragon-Flores M, Solt AC, Altenburg M, Torres-Jardon R, Swenberg JA. Brain inflammation and Alzheimer’s-like pathology in individuals exposed to severe air pollution. Toxicol Pathol. 2004;32(6):650–8. doi: 10.1080/01926230490520232. [DOI] [PubMed] [Google Scholar]
- Calderon-Garciduenas L, Franco-Lira M, Torres-Jardon R, Henriquez-Roldan C, Barragan-Mejia G, Valencia-Salzar G, Gonazlez-Maciel A, Reynoso-Robles R, Villarreal-Calderon R, Reed W. Pediatric respiratory and systemic effects of chronic air pollution exposure: nose, lung, heart, and brain pathology. Toxicol Pathol. 2007;35(1):154–62. doi: 10.1080/01926230601059985. [DOI] [PubMed] [Google Scholar]
- Calderon-Garciduenas L, Sold AC, Henriquez-Roldan C, Torres-Jardon R, Nuse B, Herritt L, Villarreal-Calderon R, Osnaya N, Stone I, Garcia R, Brooks DM, Gonzalez-Maciel A, Reynoso-Robles R, Delgado-Chavez R, Reed W. Long-term air pollution exposure is associated with neuroinflammation, an altered innate immune response, disruption of the blood-brain barrier, ultrafine particulate deposition, and accumulation of amyloid beta-42 and alpha-synuclein in children and young adults. Toxicol Pathol. 2008;36(2):289–310. doi: 10.1177/0192623307313011. [DOI] [PubMed] [Google Scholar]
- Cosgrove BA, et al. Real-time and retrospective forcing in the North American Land Data Assimilation System (NLDAS) project. Journal of Geophysical Research-Atmospheres. 2003:108. [Google Scholar]
- Crosson WL, Al-Hamdan MZ, Hemmings SN, Wade GM. A daily merged MODIS Aqua-Terra land surface temperature data set for the conterminous United States. Rem Sens Environ. 2012;119:315–324. doi: 10.1016/j.rse.2011.12.019. [DOI] [Google Scholar]
- Garcia V, Kondragunta S, Holland D, Dimmick F, Boothe V, Szykman J, Chu A, Chu A, Kittaka C, Al-Saadi J, Engel-Cox J, Hoff R, Wayland R, Rao S, Remer L. Integration of Satellite, Modeled, and Ground-Based Aerosol Data for Use in Air Quality and Public Health Applications. Presented at the American Geophysical Union (AGU) Fall Meeting; AGU: Washington, DC. 2006. p. Abstract A33E-06. [Google Scholar]
- Gupta P, Christopher S, Wang J, Gehrig R, Lee Y, Kumar R. Satellite Remote Sensing of Particulate Matter and Air Quality over Global Cities. Atmos Environ. 2006;40:5880–5892. [Google Scholar]
- Gupta P, Christopher SA. Seven Year Particulate Matter Air Quality Assessment from Surface and Satellite Measurements. Atmos Chem Phys Discuss. 2008;8:1–39. [Google Scholar]
- Hsu NC, Tsay SC, King MD, Herman JR. Aerosol Properties over Bright-Reflecting Source Regions. IEEE Trans Geosci Remote Sens. 2004;42:557–569. [Google Scholar]
- Joffre KA, Kukkonen SM, Bremer P. Evaluation of Inversion Strengths and Mixing Heights during Extremely Stable Atmospheric Stratification. Int J Environ Pollut. 2001;16:1–6. [Google Scholar]
- Kent Shia T, McClure Leslie A, Crosson William L, Arnett Donna K, Wadley Virginia G, Sathiakumar Nalini. Effect of sunlight exposure on cognitive function among depressed and non-depressed participants: a REGARDS cross-sectional study. Environmental Health. 2009;8:34. doi: 10.1186/1476-069X-8-34. [DOI] [PMC free article] [PubMed] [Google Scholar]
- Kent ST, Howard G, Crosson WL, Prineas RJ, McClure LA. The association of remotely sensed outdoor temperature with blood pressure levels in REGARDS: a cross-sectional study of a large, national cohort of African-American and white participants. Environmental Health. 2011;10:7. doi: 10.1186/1476-069X-10-7. [DOI] [PMC free article] [PubMed] [Google Scholar]
- Liu Y, Sarnat J, Kilaru V, Jacob D, Koutrakis P. Estimating Ground-Level PM2.5 in the Eastern United States Using Satellite Remote Sensing. Environ Sci Technol. 2005;39:3269–3278. doi: 10.1021/es049352m. [DOI] [PubMed] [Google Scholar]
- Liu Y, Franklin M, Kahn R, Koutrakis P. Using Aerosol Optical Thickness to Predict Ground-Level PM2.5 Concentrations in the St. Louis Area: a Comparison between MISR and MODIS. Remote Sens Environ. 2007;107:33–44. [Google Scholar]
- Maciel A, Reynoso-Robles R, Delgado-Chavez R, Reed W. Long-term air pollution exposure is associated with neuroinflammation, an altered innate immune response, disruption of the blood-brain barrier, ultrafine particulate deposition, and accumulation of amyloid beta-42 and alpha-synuclein in children and young adults. Toxicol Pathol. 2008;36(2):289–310. doi: 10.1177/0192623307313011. [DOI] [PubMed] [Google Scholar]
- McMillan N, Holland DM, Morara M, Feng J. Combining Different Sources of Particulate Data Using Bayesian Space-Time Modeling. Environmetrics. 2010;21(1):8–65. [Google Scholar]
- NRC. Earth Science and Applications from Space: National Imperatives for the Next Decade and Beyond. National Research Council; Washington, D.C: 2007. p. 428. ( http://www.nap.edu/catalog.php?record_id=11820#toc) [Google Scholar]
- Paciorek CJ, Liu Y, Moreno-Macias H, Kondragunta S. Spatio-Temporal Associations between GOES Aerosol Optical Depth Retrievals and Ground-Level PM2.5. Environ Sci Technol. 2008;42:5800–5806. doi: 10.1021/es703181j. [DOI] [PubMed] [Google Scholar]
- Srinivasan V, Smits M, Spence W, Lowe AD, Kayumov L, Pandi-Perumal SR, Parry B, Cardinali DP. Melatonin in mood disorders. World J Biol Psychiatry. 2006;7(3):138–151. doi: 10.1080/15622970600571822. [DOI] [PubMed] [Google Scholar]
- Walker B, Jr, Mouton CP. Environmental influences on cardiovascular health. J Natl Med Assoc. 2008;100(1):98–102. doi: 10.1016/s0027-9684(15)31182-2. [DOI] [PubMed] [Google Scholar]
- Wang J, Christopher SA. Intercomparison between Satellite-Derived Aerosol Optical Thickness and PM2.5 Mass: Implications for Air Quality Studies. Geophys Res Lett. 2003;30:2095. doi: 10.1029/2003/GL018174. [DOI] [Google Scholar]
- Weuve J, Puett RC, Schwartz J, Yanosky JD, Laden F, Grodstein F. Exposure to particulate air pollution and cognitive decline in older women. Archives of Internal Medicine. 2012;172(3):219–227. doi: 10.1001/archinternmed.2011.683. [DOI] [PMC free article] [PubMed] [Google Scholar]
- Wellenius GA, Burger MR, Coull BA, Schwartz J, Suh HH, Koutrakis P, Schlaugh G, Gold DR, Mittleman MA. Ambient air pollution and the risk of acute ischemic stroke. Archives of Internal Medicine. 2012;173(3):229–234. doi: 10.1001/archinternmed.2011.732. [DOI] [PMC free article] [PubMed] [Google Scholar]
- Winkler D, Pjrek E, Iwaki R, Kasper S. Treatment of seasonal affective disorder. Expert Rev Neurother. 2006;6(7):1039–1048. doi: 10.1586/14737175.6.7.1039. [DOI] [PubMed] [Google Scholar]
- Zhang H, Hoff RM, Engel-Cox JA. The relation between Moderate Resolution Imaging Spectroradiometer (MODIS) aerosol optical depth and PM2.5 over the United States: a geographical comparison by EPA regions. Journal of the Air & Waste Management Association. 2009;59:1358–1369. doi: 10.3155/1047-3289.59.11.1358. [DOI] [PubMed] [Google Scholar]


