Abstract
Advanced imaging provides insight into biophysical, physiologic, metabolic, or functional properties of tissues. Since water mobility is sensitive to cellular homeostasis, cellular density and microstructural organization, it is considered a valuable tool in the advanced imaging arsenal. This article briefly summarizes diffusion imaging concepts and highlights clinical applications of diffusion MRI for oncologic imaging. The inverse relationship between water mobility and density of cellular elements has been exploited in attempts to characterize and grade brain tumor based on apparent diffusion coefficient (ADC), as well as distinguish tumor from peritumoral edema. Diffusion tensor imaging and its derivative maps of diffusion anisotropy allow assessment of tumor compression or destruction of adjacent normal tissue anisotropy thus may aid to assess tumor infiltration and aid pre-surgical planning. A variety of preclinical studies on treated tumor models demonstrate ADC is sensitive to therapeutic alteration of tumor by effective cytotoxic agents, and that ADC changes are measurable before the lesion shrinks in size. In corresponding clinical studies, these ADC changes have been detected before completion of fractionated chemo-radiation schedules thus diffusion-based biomarkers of response have the potential to be used to intervene and individualize therapy delivery. Several methods to distill diffusion information into quantitative biomarkers have been proposed and include tumor summary statistics of baseline ADC/FA values and their change with time, as well as production of voxel-by-voxel response maps that reflect the relative volume of responding tumor. The voxel-based methods require coregistration of image volumes but this approach may also have value to guide spatially-directed therapies.
Introduction
For 2009 it is estimated there will be over 22,000 newly diagnosed cancers of the brain and central nervous system (CNS) in the US and that nearly 13,000 individuals will die of cancer of the brain and CNS [1]. Despite the emergence of many new treatment strategies and multimodality therapies, successful management of brain tumors in adults and children remains largely unsatisfactory. In particular, glioblastoma multiforme (GBM) presents a major challenge given its moderate response rates to essentially all available standard-of-care therapies leading to a median survival time of only 12.2 – 18.2 months in these patients [2]. This is in contrast to patients with anaplastic astrocytomas that survive over 40 months on average [3], and low grade gliomas that have a better prognosis; although still the vast majority of these individuals eventually succumb to their disease [4]. To date, patient age, tumor histology, patient functional status and the combination of these parameters are considered the most reliable prognostic indicators of overall survival [5, 6]. This is an unfortunate fact considering remarkable advances in neuro imaging that have occurred over the last couple decades. That is, despite major strides in spatial resolution and contrast of anatomical features, along with information rich functional, metabolic and physiologic representations of tissues, these undeniable achievements in neuro imaging have not had a commensurate impact on brain tumor patient survival outcome. The reader is referred to other chapters in this issue for reviews of other advanced imaging approaches applied to brain tumor. Of course it is the therapy and not the imaging that ultimately treats the tumor, thus lack of any major improvement in brain tumor treatment outcome is more of an indictment of these therapies than of imaging. Moreover, while advanced imaging techniques have been available for many years, these methodologies are still evolving rapidly and have not been standardized or applied uniformly in large clinical trials. Indeed, in most instances imaging is used as a simple indicator of change in tumor size well after therapy administration by way subjective or objective assessment of lesion dimensions. Unfortunately, early change in size is not a reliable indication of tumor response particularly for patients receiving combination therapy of temozolomide with radiation. The phenomena of “pseudo-progression” is indistinguishable from true tumor progression by conventional imaging [7-9]. Pseudo-progression is characterized by an increase in size or number of contrast-enhancing lesions soon after treatment with temozolomide plus radiation which eventually resolves or stabilizes without additional treatment. Pseudo-progression is observed in an estimated 15-30% of patients receiving this treatment and the majority of these patients remain clinically stable despite the progression-like appearances [7-9]. It is often unclear whether current therapy should be maintained or second line therapy initiated.
While a fully satisfactory method to determine tumor response by imaging has not been developed, solid tumor response based on a simple single linear summation of lesion dimension termed Response Evaluation Criteria in Solid Tumors (RECIST) is still in use today [10]. Utilization of advanced imaging as an integral intervention to customize delivery of treatment on an individual patient basis remains largely untested. The goal of this chapter is to summarize the concepts and use of diffusion MR imaging as a prognostic indicator as well as a potential biomarker of brain tumor treatment response. The scope will briefly refer to basic diffusion principles and preclinical diffusion work, and focus on clinical investigations in use diffusion for oncologic applications. To date most of these clinical studies are single institution trials and involve modest patient numbers. Despite these limitations, diffusion imaging has shown promise as a tool for oncologic imaging of treatment response.
Diffusion Concepts
The essential element of diffusion-based imaging is thermally-driven random motion of water molecules which are the sole source of desired signal. While water is the sole signal source, it is all the non-water constituents that provide the contrast and interest in diffusion imaging of tissue. Indeed, in pure water the only relevant modifier to water mobility is temperature, thus pure water maintained at body temperature has no contrast. Classic diffusion theory provides a statistical estimate for the average random displacement of water molecules over a given time interval. Assuming body temperature (37°C), water molecules will migrate approximately 30microns over a 50ms interval but only if they are totally free of impediments. The 50ms interval was chosen since it is representative of typical diffusion-weighted imaging (DWI) echo time TE. The fact that the diameter of a mammalian cell is approximately a few micrometers to tens of micrometers and that other subcellular structures (i.e. membranes, organelles and macromolecules) have smaller dimensions, the likelihood a given water molecule will encounter non-water cellular constituents is extremely high. In fact the water molecule will likely have many interactions with large obstructions over the diffusion measurement interval. As a result the reduction of water mobility in tissue is a strong reflection of presence and density of non-water cellular constituents such as cell membranes, organelles and macromolecules. Given water moves within and across intra- and extracellular domains, water will also encounter impediments presented by tortuosity in the extracellular interstitium [11-13].
The reader is referred elsewhere for excellent reviews on technical aspects of how diffusion imaging is performed [14-17], although for our interest it is sufficient to summarize a few key concepts. Sensitivity of the MR sequence to water mobility is determined by the strength, duration and direction of gradient pulses interleaved within the imaging sequence. The single most important parameter selected by the operator for diffusion imaging is the “b-value” which is calculated based on gradient waveform amplitude and duration properties. As the b-value is increased, the signal strength decays due to spin dephasing secondary to random molecular displacements. The resultant diffusion-weighted image (DWI) exhibits tissues where less mobile water appears hyper intense compared to hypo intense tissues where water is more mobile. Keen sensitivity to acute ischemic insult leading to cytoxic edema manifest as a hyper intensity on DWI is a classic example of this principle [18, 19]. While diffusion-based contrast increases with b-value, there are practical signal-to-noise (SNR) and hardware limitations such that reasonable a b-value range for each particular application is reasonably well established. For example, the vast majority of clinical DWI of the human brain is performed in the b-value range 0 – 1000s/mm2. Aside from qualitative interpretation of heavily diffusion weighted images (eg. at b=1000s/mm2), the combination of at least two diffusion weighted images allows quantitative calculation of an apparent diffusion coefficient (ADC) given by,
| Eq(1) |
where S1 and S2 represent signal intensity of images acquired at low b-value, b1, and high b-value, b2, respectively.
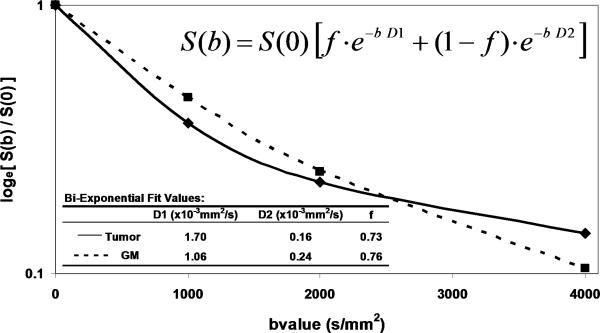
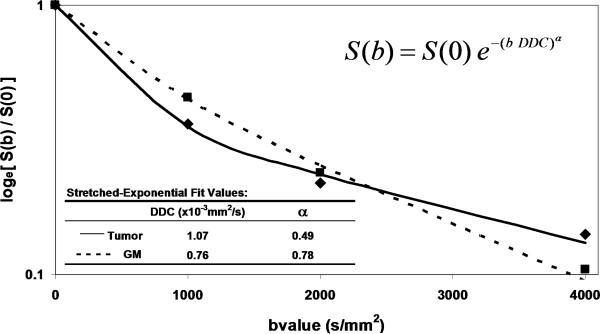
The simplicity of Eq(1) implies monoexponential signal decay with increasing b-value; however, water diffusion in tissue is well known to exhibit non monoexponential behavior observed at very high b-values (b > 3000 s/mm2) [20-23]. The existence of non monoexponetial behavior is not surprising considering the complex nature of the extracellular and subcellular domains, although which biophysical model and means to interpret multi exponential in vivo data remains the subject of debate [21, 23-25]. In addition, SNR limitations and long scantimes to acquire a wide b-value range necessary to demonstrate multi exponential features have hampered clinical utilization of this phenomenon. Figure 1 illustrates signal loss and gain in diffusion-weighted contrast of normal tissues and glioma with increasing b-value. Non monoexponential behavior is demonstrated by the graphs of signal vs b-value for ROIs defined on normal brain and glioma. Two functional forms proposed to fit these signal decay features are a bi-exponential model [17, 20, 25] and the stretched exponential model [24]. Model fit parameter values and their functional form are illustrated on the graphs for these examples of tumor and normal gray matter. Note the dominant compartment signified by f > 1 has a higher diffusion coefficient than the minority compartment (i.e. D1 > D2). This finding is consistent with other studies and indicates a simple conceptual assignment of lower diffusion in the dominant intra-cellular compartment and higher diffusion in the smaller extra-cellular compartment is not valid, thus more complex models are required [20, 25]. The α index from the stretched exponential relates to intravoxel diffusion heterogeneity. A lower α solid tumor suggests a greater spread in intravoxel diffusion values relative to gray matter [26].
Figure 1.
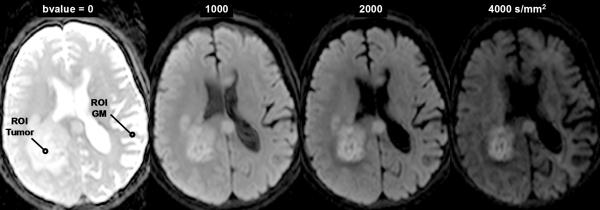
DWI contrast at high b-value in a 61yo patient with a GBM. (A) DWI of the brain typically performed at b-value=0, 1000s/mm2, although conspicuity of cellular dense central tumor increases at higher b-values. (B) Tissue has multiexponential diffusion decay properties as is evident by curvature in log(signal) with b-value which can be fit by a bi-exponential function to yield fast diffusion D1, slow diffusion D2 coefficients and relative fraction of fast diffusion component f. (C) The stretched exponential is an alternative functional form to fit multiexponential decay, where DDC is the distributed diffusion coefficient and a lower α value indicates greater heterogeneity of diffusion contributions in the curve. Both the bi-exponential and stretched exponential fits indicate there is a greater spread in diffusion values in tumor relative to normal grey matter for this patient.
Another fundamental consideration relates the fact water mobility in tissue can be directional – that is, anisotropic. White matter, in particular, is very anisotropic where the apparent water mobility varies several-fold based on relative orientation of the measurement direction and myelinated white matter fiber axis [27-32]. Diffusion sensitization gradients must be applied along multiple non colinear directions (at least 6) such that the underlying directional architecture of the tissue can be numerically estimated. Again the reader is referred elsewhere for technical details on diffusion tensor imaging (DTI) [16, 30, 31], although a common intermediate step in the DTI analysis is calculation of eigen values for each voxel. Eigen values (λ1, λ2, λ3) represent diffusivity along the natural tissue-based axes that may exist in the voxel. The standard convention is to have λ1 represent the highest diffusivity value ostensibly along the fiber axis, whereas λ2, and λ3 are lower values perpendicular to the fiber direction. In isotropic media λ1 ≈ λ2 ≈ λ3. These eigen values are used in subsequent calculations to derive a variety indices representing the degree of diffusion anisotropy which infers the degree of cytoarchitectural anisotropy and omnidirectonal order in tissue. For example, fractional anisotropy (FA) is commonly used as an anisotropy index and is defined as,
| Eq(2) |
where Dave is the average of the eigen values which is effectively equivalent to ADC. Mathematically, FA is a dimensionless quantity bound between 0 (non directional isotropic) and 1 (highly directional anisotropic), though in actual anisotropic tissue such as the splenium of the corpus callosum the maximum FA value is approximately 0.7 to 0.8 and varies with patient age [31].
Fractional anisotropy is just one of several indices available to characterize isotropic and anisotropic elements of tissue [17, 33, 34]. In addition to the degree of anisotropy there are geometric “shape” indices that may be particularly relevant in tumor that may induce anisotropy by compression of otherwise isotropic spherical cells. In white matter fibers the principle eigen value is significantly greater than the second and third eigen value, thus the “diffusion shape” is envisioned as an elongated prolate ellipsoid (ie. λ1 >> λ2 ≈ λ3). However, imagine a spherical cell undergoing compression, analogous to a spherical balloon compressed between two planes. For such a shape the first and second eigen value are nearly equivalent and are significantly greater than the third (ie. λ1 ≈ λ2 >> λ3). In this situation the envisioned shape is an oblate ellipsoid which is a suitable model for normal cells being compressed by tumor mass effect. These two distinct shape forms of anisotropy can be quantified by CL (linear) and CP (planar) indices defined as [33, 35],
| Eq(3) |
It should be apparent that a linear prolate shape would have a high CL and low CP, whereas planar oblate shape would have low CL and high CP.
Anisotropy provoked by tumor mass effect in adjacent brain has been demonstrated in animal tumor models [36, 37]. Figure 2 illustrates this effect can occur in human brain tumor as well. The FA map shows both anisotropic shapes can have relatively high FA values (Figure 2(B)). The high CL values are associated with normal and displaced white matter tracts (Figure 2(C)), whereas high CP values are primarily in the compression zone around the tumor (Figure 2(D)).
Figure 2.
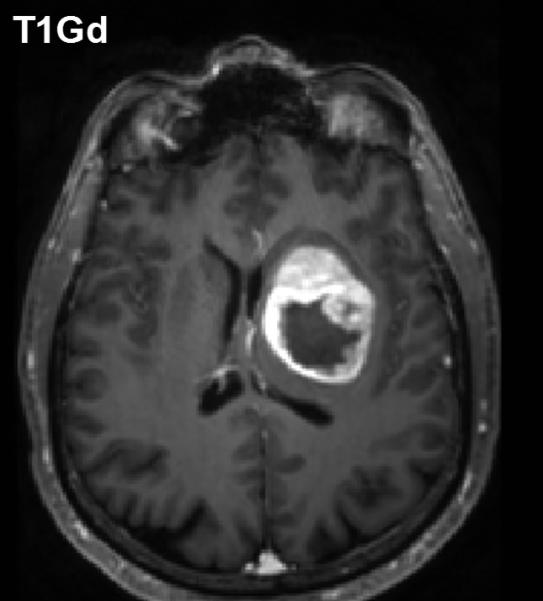
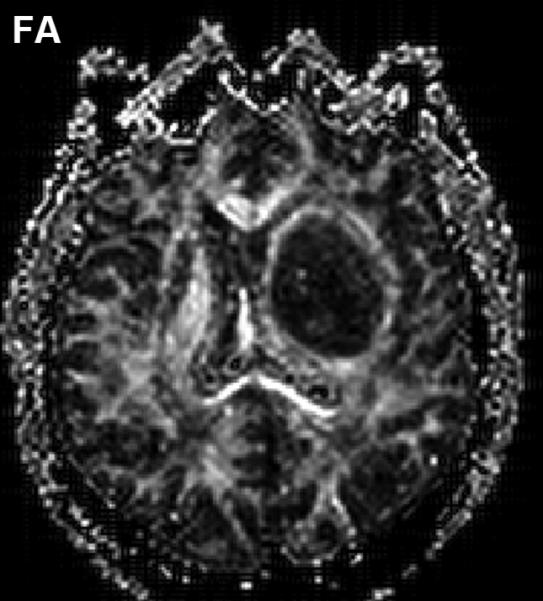
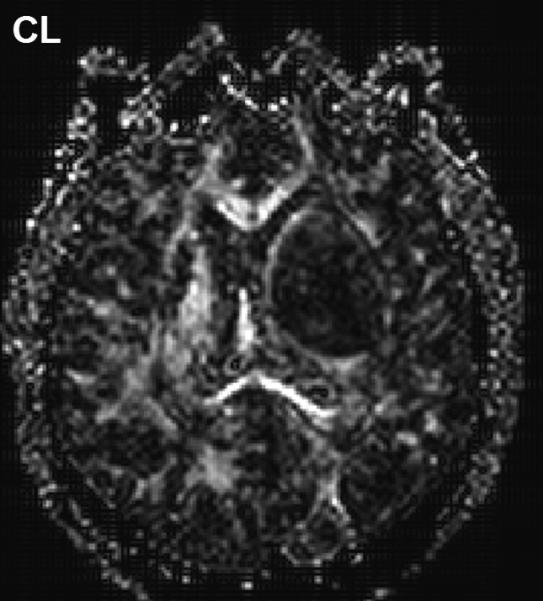
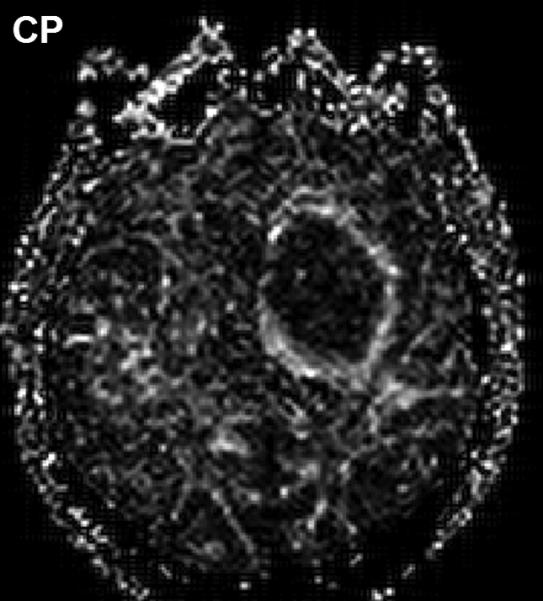
Diffusion anisotropy is typically associated with normal white matter structures but may be induced by tumor mass-effect compression of adjacent tissues. (A) Conventional post-contrast T1wt shows a well-delineated lesion in this 56yo GBM patient. (B) Fractional anisotropy map shows high anisotropy in normal white matter structures as well as anisotropy around surrounding the lesion. (C) Anisotropy shape analysis of DTI eigen values shows linear shaped structures on at CL map based on high contrast between first and second eigen values. (D) Planar shaped anisotropic zones are apparent on the CP map which is based on high contrast between second and third eigen values. The conspicuous rim around the lesion is likely due to compression of cells immediately adjacent to the expanding tumor mass.
Further analyses to extend anisotropy information to color-coding the dominant eigen value direction, or to map fiber tracts through the anatomy are also performed clinically. Again the reader is referred elsewhere for excellent reviews on DTI and fiber tractography techniques, along with their clinical application [30, 38]. Within the context of diffusion for oncologic imaging and therapy response assessment, the vast majority of work has been done using ADC and simple anisotropy indices such as FA.
Diffusion Imaging in Characterization of Tumor
As indicated above, water mobility is extremely sensitive to interactions with non water constituents in tissues which provides DWI contrast and diagnostic content. Indeed, DWI is used extensively in clinical practice due to its exquisite sensitivity to cellular status, cytotoxic versus vasogenic edema, cellular density and directional organization of tissues. In application to tumor, several studies have demonstrated a clear relationship between ADC and tissue/tumor cellularity by histology [39-42]. It is generally noted that low ADC values are associated with cellular dense zones on histology, thus ADC and cellular density are inversely related. These studies suggest the lowest ADC values measured in the most solid elements of the tumor may be valuable to characterize and grade tumor in analogy to histologic sampling the most malignant portion of the tumor [39, 41-43]. However, tumor heterogeneity remains problematic and leads to overlap between groups stratified solely by ADC. A high choline concentration in proton MR spectroscopy is indicative of membrane turnover thus choline tends to be high in the viable solid portion of a brain tumor. Combining this with the known relationship between ADC and cellularity, one would expect choline and ADC to be inversely related as was demonstrated in a study of 20 glioma patients [44]. Figure 3 exemplifies this in a patient with a high grade glioma where the tumor is highly perfused as seen on the blood flow map, and has high choline (Cho) with low n-acetylaspartate (NAA) suggesting viable tumor and membrane production. This tumor also has a relatively low ADC which supports a cellular dense microenvironment consistent with the MRS characterization.
Figure 3.
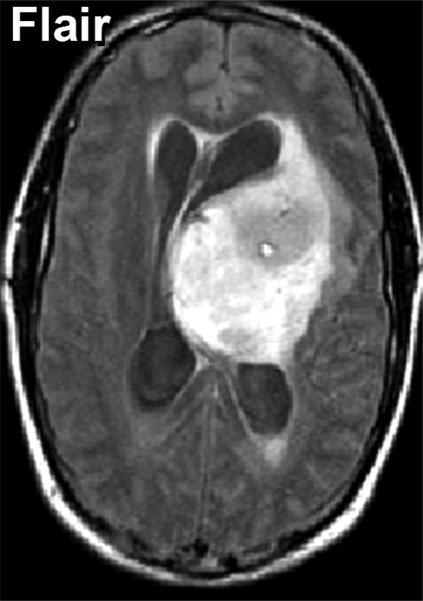
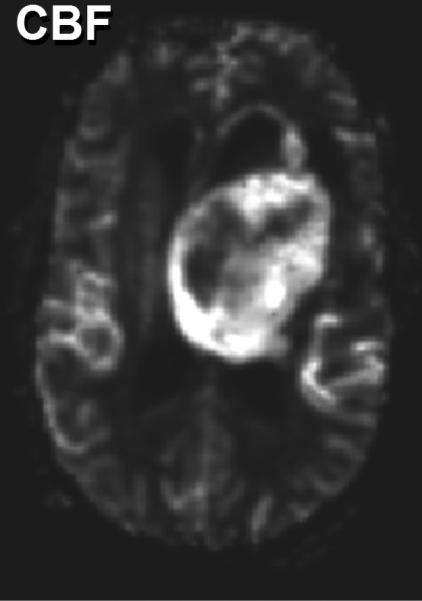
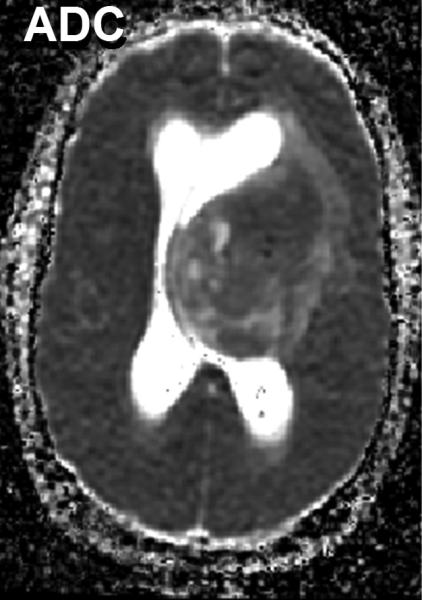
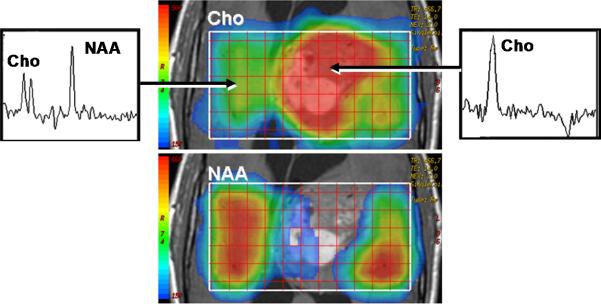
Multimodality depiction of a malignant glioma in a 29yo patient. (A) FLAIR contrast MRI shows a large central mass. (B) Cerebral blood flow (CBF) map indicates the tumor is well perfused. (C) Relatively low ADC suggests a high cellular density in the tumor. (D) Choline and NAA maps with extracted spectra indicate high membrane turnover in the tumor. High choline content, high CBF and low ADC are mutually consistent and support the diagnosis of a cellular dense, viable, malignant tumor. This patient expired within 1month after this MRI exam.
Apparent diffusion coefficient maps have been evaluated in distinguishing solid enhancing tumor, non-contrast enhancing tumor, peritumoral edema, and necrotic and/or cystic tumor from normal surrounding brain tissue. Some studies indicate ADC values can be helpful to discriminate edema from tumor [45, 46] but there are conflicting studies as well [43, 47, 48]. It has been noted that one likely explanation for contradictory results is the methodological variability in image acquisition and post processing including ROI definition criteria. Some have concluded it is unlikely ADC values alone can reliably differentiate between peritumoral edema and non contrast enhancing neoplasm in individual patients [49]. Although several studies have shown cystic or necrotic regions consistently have high ADC values relative to contrast-enhancing presumably viable portions of the tumor [46, 50, 51].
In terms of the diagnostic value of FA over ADC in distinguishing tumor elements from peritumoral edema, a common observation is that as ADC increases, FA tends to decrease. Therefore, while ADC and FA represent fundamentally distinct features of the tissue they are still mathematically linked by their eigen values. Studies have shown a significant increase in mean diffusivity and significant decrease in FA in the peritumoral region of both gliomas and metastatic tumors when compared with those of normal appearing white matter [52, 53]. However, the peritumoral ADC of metastatic lesions was significantly greater than those of gliomas, whereas the FA values showed no discrepancy between tumor and metastasis, suggesting that the FA changes in tissue surrounding gliomas can be attributed to both increased water content and tumor infiltration [52, 53]. A clear challenge in measurement of peritumoral FA values is the fact that white matter is the main source of anisotropy, thus the peritumoral FA value is heavily influenced by the anatomic location of the tumor.
Diffusion Imaging to Grade Tumor
Diffusion-weighted imaging and DTI have been explored as aids to grade tumor in adult and pediatric populations. Several studies have shown that low-grade astrocytoma has higher ADC values relative to lower ADC in high-grade malignant glioma. These studies refer to increased tumor cellularity as the source of reduced ADC in high-grade glioma [40, 41, 43]. In use of anisotropy, one group showed FA values in grade 1 and grade 2 gliomas were significantly lower compared to grade 3 and 4 gliomas [54], thus they concluded that FA values can distinguish between high grade and low grade gliomas. Consistent with other studies, they also noted ADC was significantly higher in grade 1 than in grade 3 and 4 glioma. However there remains controversy in the literature on use of FA values which are generally reduced in tumors suggesting structural disorder thus may not add much information for tissue classification across tumors [46]. That said, FA may help in the understanding of the effect of brain tumors on nearby white matter fibers which may be important to assess tumor infiltration and for pre-surgical planning [29, 55]. Again, one must keep in mind the high degree of normal variation in FA depending on location in the brain [56, 57] which must be considered and may help explain disparity across studies. Depending on how fiber tracts are altered, one may expect normal anisotropy from shifted tracts, increased anisotropy due to compression of tracks [50], or a reduction of anisotropy due to edema, infiltration and destruction of white matter [49]. Directionally-encoded color maps of FA were categorized into four major patterns of tumor altered white matter tracts: deviated, edematous, infiltrated, and destroyed [58]. Classification by these patterns may aid presurgical planning and thereby potentially avoid damaging an intact tract during surgery. Figure 4 illustrates three clinical examples where directionally-encoded by color FA maps illustrate gradations of white matter anisotropy affected by tumor. In the example on the left the white matter tracts are shifted but otherwise intact, whereas the examples in the middle and right illustrate reduced and obliterated anisotropy respectively due to greater tumor invasion.
Figure 4.
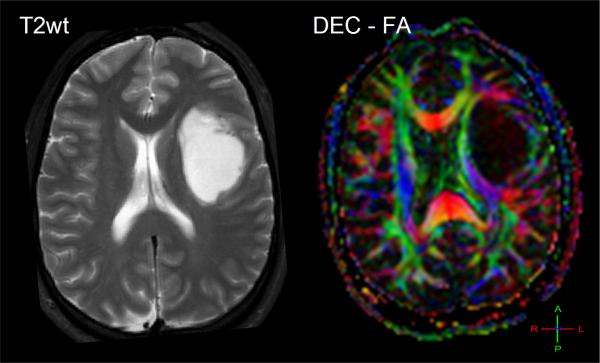
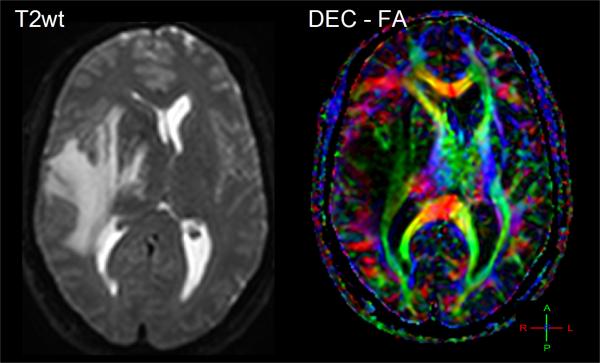
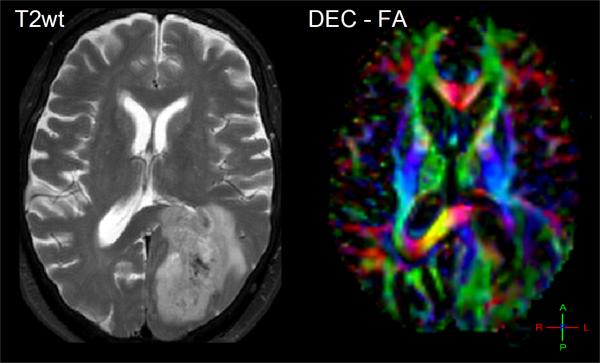
The effect of tumor on normal white matter structures can be studied by directionally-encoded-color FA maps. (A) A 26yo patient with white matter and normal tissues shifted and somewhat compressed by this anaplastic astrocytoma. (B) This 48yo patient has reduced anisotropy and mass effect due to infiltration of his GBM. (C) This 62yo GBM patient has lost all anisotropy in the due to tumor replacement of white matter in portions of the splenium.
Diffusion Imaging for Prognosis and Treatment Monitoring
Undoubtedly many of the challenges in use of diffusion and anisotropy to characterize and grade tumor stem from heterogeneity within and across tumor types. However, consider an alternative scenario wherein a given lesion is followed over time during anticancer treatment. In this application, diffusion is used to detect change in the lesion microenvironment presumably due to a direct therapeutic impact on the lesion. In this regard, there is less concern with pretreatment diffusion properties of lesion; rather emphasis is placed on its evolution during and after treatment. Furthermore, if we assume the therapy is an effective cytotoxic therapy it is reasonable to expect tissue changes by way of cellular necrosis, apoptosis and membrane lysis should occur prior to removal of cellular debris and subsequent mass shrinkage. Based on the linkage between water mobility and microscopic cellular features, it has been hypothesized these positive therapeutic events can be quantified noninvasively by diffusion before traditional measures of therapeutic response (i.e. lesion size) reflect the change. While this section deals with serial change in response to treatment, one group also demonstrated pretreatment ADC may have prognostic value for brain tumor patients [59]. This study showed a low baseline ADC presumably due to cellular/viable tumor was more responsive to treatment than tumor having a preexisting high ADC from necrosis.
There are numerous preclinical studies to support the hypothesis that serial change in ADC may be a biomarker of treatment response. Original work on a 9L glioma model treated by single dose of chemotherapy (1,3-bis(2-chloroethyl)-1-nitrosourea, or BCNU) demonstrated the increase in tumor diffusion values following treatment was reflective of cellular density changes observed by histology [36]. Furthermore, dose-response experiments involving low chemo therapeutic doses suggest diffusion is sensitive to subtle effects provoked at relatively low cell-kill rates [60]. In this and other tumor models the increase in tumor diffusion occurred prior to mass shrinkage thereby supporting the argument that ADC may serve as an early biomarker of response [61-67].
In translating diffusion as a therapy response indicator to the clinic, several inherent features work in its favor. Unlike many other MRI quantities, water mobility is not a magnetization property per se, therefore diffusion measurement is relatively independent of field strength and vendor platform. Moreover, DWI and DTI are already commonplace sequences in human brain imaging protocols therefore feasibility to acquire the data is well established. However, there are several key differences between human and animal scenarios that lessen biomarker sensitivity to response and should be considered. Human brain tumors are often more heterogeneous than implanted tumor in animal studies such as the 9L glioma in rodents. Also, tumor evolution time scales tend to be shorter in animal studies in terms of therapy delivery, tumor growth and response such that tissue/tumor alteration due to therapy tends to appear more slowly and less pronounced in humans than in animal studies. The typical situation in treating human brain cancer is that therapies are administered over an extended interval (eg. several weeks). And since therapies are only moderately effective, the absolute change in water mobility following delivery of a fraction of a moderately effective therapy is attenuated. Despite these concerns there is good evidence therapeutic effects are detectable via diffusion which supports its investigation as a response biomarker. There are other recent examples where diffusion reveals therapeutic effects outside the brain for patients treated for cancer in the head and neck [68], bone [69], breast [70, 71], liver [72], sarcoma [73] and cervix [74]. The common trend in these studies is an increase in tumor ADC values appear to be correlated with positive clinical response.
Original work in human brain tumor demonstrated the feasibility to detect therapy-induced tumor ADC changes relatively early into therapy [60], and was found to be consistent with subsequent studies involving chemo therapy [75],chemo/radiation [76], and stereotactic radiotherapy [77, 78]. As with extracranial tumor sites, an ADC increase in brain tumor relatively early during treatment was more likely associated with a positive therapeutic response measured at a later date by traditional means. Work by Mardor [76] also involved use of multi exponential diffusion decay features measurable at high b-values and these authors found additional sensitivity to treatment response in a composite index. This suggests that while there are fairly consistent findings across tumor sites and therapies, there remain technical issues in how to best analyze ADC data.
Definition of lesion extent and tumor heterogeneity are recognized challenges to use of image-based biomarkers including diffusion. In general, the studies cited above utilized conventional region-of-interest (ROI) analysis to yield whole tumor average ADC values. However, standard ROI summary statistics of mean or median do not address intra-lesion spatial heterogeneity or variable spatial response across the lesion. Cellular changes in tumor after therapy may involve a combination of cell swelling due to loss of cellular water homeostasis, and subsequent cell lysis or apoptotic cell shrinkage. In addition, there may be a redistribution or resorption of excess water from edema and cysts. The balance of these effects can yield transient and spatially focal reduction and increases in diffusion values. The magnitude of these regional changes may be underestimated by ROI-derived whole-tumor averages. An alternative potential remedy to these effects is to deal with changes on a voxel-by-voxel basis. This concept originally applied to diffusion was referred to as “functional diffusion mapping” (fDM) [79]. An essential element of fDM is spatial alignment of 3D ADC maps into a common geometrical framework. In this way diffusion changes are measurable on a voxel-by-voxel basis by subtraction of pre- from mid-therapy or pre- from post-therapy 3D image sets. In addition, coregistered ADC maps can be spatially aligned with high quality 3D anatomic data such as post-contrast T1-weighted and T2-weighted FLAIR images. Typically multiple contrasts are coregistered using a mutual information algorithm and an affine transformation [80]. A clear advantage of this is that tumor boundaries can be drawn with the aid of the best available tumor contrast and defined over multiple slices (i.e. volume of interest, VOI). Since all 3D image sets are spatially aligned, the VOIs defined on one type of image contrast are directly applicable to another image type or quantitative map. Another important distinction of this type of analysis is that instead of measuring the intensity of ADC change averaged over the VOI, one measures the volume (or fractional volume) of the tumor that exhibits a “significant” change. For this one needs to provide the threshold above which change is considered significant thus more likely true than random. One method to determine this threshold was proposed in the original fDM article although alternative approaches can be applied [81]. This concept has been extended to other modalities thus is generally referred to as parametric response mapping (PRM) [82]. For consistency with the generalized approach the original fDM may be referred to as PRMADC . Recently, PRM principles were applied to diffusion anisotropy [83] and to monitor recurrent brain tumor [84].
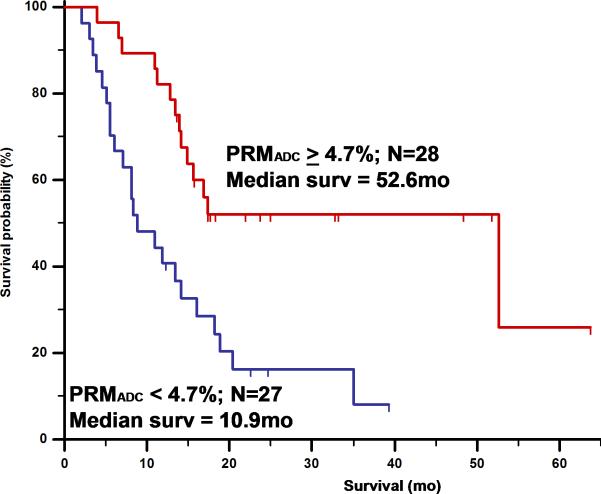
Figure 5 and 6 illustrates PRMADC analysis of two individuals treated by chemoradiotherapy for their high grade gliomas. The first patient (Figure 5) exhibited increasing ADC early during therapy although there was not much change in the size of the tumor. By week 3 into treatment PRMADC analysis indicated a relatively large fraction of the tumor volume exhibited a significant increase in ADC as coded by red voxels superimposed on T1-Gad images in Figure 5B, and was classified as a “responder” by PRMADC. A counter example is shown in Figure 6 where very little change in ADC was noted during treatment, thus this individual was classified as a “non responder” by PRMADC. In contrast to the PRMADC response scores, traditional response criteria based primarily on radiographic size of the tumor at week 10 classified the patient in Figure 5 as progressive disease and the patient in Figure 6 as stable disease. However, the actual overall survival (OS) of these two individuals (OS patient in Figure 5 = 33months; OS patient in Figure 6 = 7months) was more in agreement with the PRMADC findings than the traditional response score. Figure 7 shows the survival curves from this study that included 55 high grade tumor patients as stratified by PRMADC [85]. A key finding from this study was that PRMADC was at least as prognostic as the traditional response criteria (Macdonald criteria). However, PRMADC stratification was available 7 to 8 weeks earlier well before therapy was completed therefore it potentially allows for individualization of treatments [85]. As exemplified in these examples the PRM also provides a visual indication of where tumor that appears more responsive to treatment as well as regions unaltered thus possibly resistant to treatment. This information may be valuable to guide spatially-directed therapy such as radiosurgery, although use of PRM to guide interventions has not yet been tested in large multi institutional clinical trials.
Figure 5.

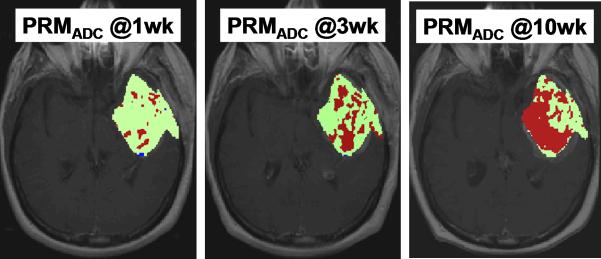
Parametric response map analysis of ADC (PRMADC) of a 45yo GBM patient. (A) Series of co-registered ADC maps one week prior to therapy; and 1, 3 and 10weeks from start of start of chemo-radiotherapy. ADC maps are on a quantitative color scale in units of 10-3mm2/s. (B) Series of PRMADC maps showing an increase in ADC beyond a +0.55×10- 3mm2/s significance threshold as red voxels; or a decrease in ADC by more than −0.55x10⁻³mm2/s as blue voxels and the remainder (non-significant change) as green voxels. These voxels are superimposed on the co-registered T1wt-gad image used to define the tumor volume of interest. PRMADC @1wk, @3wk and @10wk corresponds to ADC changes measured at 1, 3 and 10 weeks from start of therapy relative to pre-therapy baseline. This patient had a relatively large fraction of the tumor that exhibited an increase in ADC early into treatment and was considered a “responder” by PRMADC analysis which was consistent with this patient's 33month survival. Adapted from reference 85.
Figure 6.

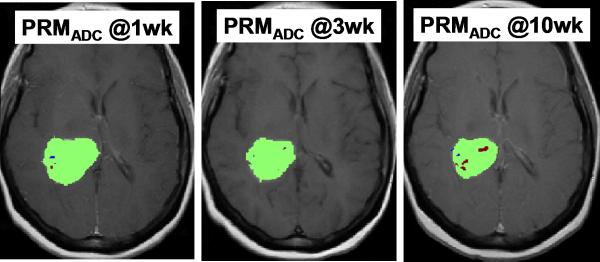
Parametric response map analysis of ADC (PRMADC) of a 53yo GBM patient. (A) Series of co-registered ADC maps one week prior to therapy; and 1, 3 and 10weeks from start of start of chemo-radiotherapy. ADC maps are on a quantitative color scale in units of 10-3mm2/s. (B) Series of PRMADC maps showing an increase in ADC beyond a +0.55×10- 3mm2/s significance threshold as red voxels; or a decrease in ADC by more than −0.55x10⁻³mm2/s as blue voxels and the remainder (non- significant change) as green voxels. These voxels are superimposed on the co-registered T1wt-gad image used to define the tumor volume of interest. PRMADC @1wk, @3wk and @10wk corresponds to ADC changes measured at 1, 3 and 10 weeks from start of therapy relative to pre-therapy baseline. This patient had a relatively small fraction of the tumor that exhibited an increase in ADC early into treatment and was considered a “non responder” by PRMADC analysis which was consistent with this patient's 7month survival. Adapted from reference 85.
Figure 7.
Overall survival by log-rank test based on PRMADC stratification of 55 high grade glioma patients at 3 weeks from start of treatment. PRMADC at 3 weeks from start of treatment was found to be at least as predictive of conventional lesion sized-based response criteria measured at 10weeks. Adapted from reference 85: Hamstra, D.A., et al., J Clin Oncol, 2008. 26(20): p. 3387-94.
Summary
Advanced imaging methodologies offer insight into functional and biophysical status of tumor/tissue and are being considered for large multi institutional clinical trials of new brain tumor treatment strategies. Diffusion imaging offers potential as a biomarker of treatment response since it sensitive to tissue/tumor cellular density and organization thus may be useful as a quantitative index of change in these qualities due to positive therapeutic effects. Results from animal model studies, feasibility and single-institution studies provide supportive evidence for use of diffusion-based quantities as treatment response biomarkers. A variety of methods to analyze diffusion information have been proposed and range from simple ROI summary of baseline ADC/FA values in the lesion and their change with time, to more elaborate mapping voxel-by-voxel differences. These approaches have shown promise as response indicators, although the voxel-byvoxel response maps have the potential to guide spatially-directed therapies.
Acknowledgements
Supported in part by Grant Nos. P01CA85878, P01CA59827, P01CA87634 and P50CA93990 from The National Institutes of Health and the National Cancer Institute.
References
- 1.Horner MJ, Ries LAG, Krapcho M, et al. SEER Cancer Statistics Review, 1975-2006. National Cancer Institute; Bethesda, MD.: 2009. [Google Scholar]
- 2.Hegi ME, Diserens AC, Gorlia T, et al. MGMT gene silencing and benefit from temozolomide in glioblastoma. N Engl J Med. 2005;352(10):997–1003. doi: 10.1056/NEJMoa043331. [DOI] [PubMed] [Google Scholar]
- 3.Keles GE, Chang EF, Lamborn KR, et al. Volumetric extent of resection and residual contrast enhancement on initial surgery as predictors of outcome in adult patients with hemispheric anaplastic astrocytoma. J Neurosurg. 2006;105(1):34–40. doi: 10.3171/jns.2006.105.1.34. [DOI] [PubMed] [Google Scholar]
- 4.Sanai N, Berger MS. Glioma extent of resection and its impact on patient outcome. Neurosurgery. 2008;62(4):753–64. doi: 10.1227/01.neu.0000318159.21731.cf. discussion 264-6. [DOI] [PubMed] [Google Scholar]
- 5.Gaspar LE, Scott C, Murray K, et al. Validation of the RTOG recursive partitioning analysis (RPA) classification for brain metastases. Int J Radiat Oncol Biol Phys. 2000;47(4):1001–6. doi: 10.1016/s0360-3016(00)00547-2. [DOI] [PubMed] [Google Scholar]
- 6.Scott CB, Scarantino C, Urtasun R, et al. Validation and predictive power of Radiation Therapy Oncology Group (RTOG) recursive partitioning analysis classes for malignant glioma patients: a report using RTOG 90-06. Int J Radiat Oncol Biol Phys. 1998;40(1):51–5. doi: 10.1016/s0360-3016(97)00485-9. [DOI] [PubMed] [Google Scholar]
- 7.Brandes AA, Franceschi E, Tosoni A, et al. MGMT promoter methylation status can predict the incidence and outcome of pseudoprogression after concomitant radiochemotherapy in newly diagnosed glioblastoma patients. J Clin Oncol. 2008;26(13):2192–7. doi: 10.1200/JCO.2007.14.8163. [DOI] [PubMed] [Google Scholar]
- 8.Brandsma D, Stalpers L, Taal W, et al. Clinical features, mechanisms, and management of pseudoprogression in malignant gliomas. Lancet Oncol. 2008;9(5):453–61. doi: 10.1016/S1470-2045(08)70125-6. [DOI] [PubMed] [Google Scholar]
- 9.Taal W, Brandsma D, de Bruin HG, et al. Incidence of early pseudo- progression in a cohort of malignant glioma patients treated with chemoirradiation with temozolomide. Cancer. 2008;113(2):405–10. doi: 10.1002/cncr.23562. [DOI] [PubMed] [Google Scholar]
- 10.Therasse P, Arbuck SG, Eisenhauer EA, et al. New guidelines to evaluate the response to treatment in solid tumors. European Organization for Research and Treatment of Cancer, National Cancer Institute of the United States, National Cancer Institute of Canada. J Natl Cancer Inst. 2000;92(3):205–16. doi: 10.1093/jnci/92.3.205. [DOI] [PubMed] [Google Scholar]
- 11.Kauppinen RA. Monitoring cytotoxic tumour treatment response by diffusion magnetic resonance imaging and proton spectroscopy. NMR Biomed. 2002;15(1):6–17. doi: 10.1002/nbm.742. [DOI] [PubMed] [Google Scholar]
- 12.Norris DG. The effects of microscopic tissue parameters on the diffusion weighted magnetic resonance imaging experiment. NMR Biomed. 2001;14(2):77–93. doi: 10.1002/nbm.682. [DOI] [PubMed] [Google Scholar]
- 13.Szafer A, Zhong J, Gore JC. Theoretical model for water diffusion in tissues. Magn Reson Med. 1995;33(5):697–712. doi: 10.1002/mrm.1910330516. [DOI] [PubMed] [Google Scholar]
- 14.Haacke EM, Brown RW, Thompson MR, et al. Magnetic Resonance Imaging: Physical Principles and Sequence Design. A. John Wiley & Sons, Inc.; New York, NY.: 1999. [Google Scholar]
- 15.Hagmann P, Jonasson L, Maeder P, et al. Understanding diffusion MR imaging techniques: from scalar diffusion-weighted imaging to diffusion tensor imaging and beyond. Radiographics. 2006;26(Suppl 1):S205–23. doi: 10.1148/rg.26si065510. [DOI] [PubMed] [Google Scholar]
- 16.Le Bihan D, Mangin JF, Poupon C, et al. Diffusion tensor imaging: concepts and applications. J Magn Reson Imaging. 2001;13(4):534–46. doi: 10.1002/jmri.1076. [DOI] [PubMed] [Google Scholar]
- 17.Basser PJ, Jones DK. Diffusion-tensor MRI: theory, experimental design and data analysis - a technical review. NMR Biomed. 2002;15(7-8):456–67. doi: 10.1002/nbm.783. [DOI] [PubMed] [Google Scholar]
- 18.Sorensen AG, Buonanno FS, Gonzalez RG, et al. Hyperacute stroke: evaluation with combined multisection diffusion-weighted and hemodynamically weighted echo-planar MR imaging. Radiology. 1996;199(2):391–401. doi: 10.1148/radiology.199.2.8668784. [DOI] [PubMed] [Google Scholar]
- 19.Warach S, Gaa J, Siewert B, et al. Acute human stroke studied by whole brain echo planar diffusion-weighted magnetic resonance imaging. Ann Neurol. 1995;37(2):231–41. doi: 10.1002/ana.410370214. [DOI] [PubMed] [Google Scholar]
- 20.Clark CA, Le Bihan D. Water diffusion compartmentation and anisotropy at high b values in the human brain. Magn Reson Med. 2000;44(6):852–9. doi: 10.1002/1522-2594(200012)44:6<852::aid-mrm5>3.0.co;2-a. [DOI] [PubMed] [Google Scholar]
- 21.Le Bihan D. The ‘wet mind’: water and functional neuroimaging. Phys Med Biol. 2007;52(7):R57–90. doi: 10.1088/0031-9155/52/7/R02. [DOI] [PubMed] [Google Scholar]
- 22.Mulkern RV, Gudbjartsson H, Westin CF, et al. Multi-component apparent diffusion coefficients in human brain. NMR Biomed. 1999;12(1):51–62. doi: 10.1002/(sici)1099-1492(199902)12:1<51::aid-nbm546>3.0.co;2-e. [DOI] [PubMed] [Google Scholar]
- 23.Mulkern RV, Haker SJ, Maier SE. On high b diffusion imaging in the human brain: ruminations and experimental insights. Magn Reson Imaging. 2009;27(8):1151–1162. doi: 10.1016/j.mri.2009.05.003. [DOI] [PMC free article] [PubMed] [Google Scholar]
- 24.Bennett KM, Schmainda KM, Bennett RT, et al. Characterization of continuously distributed cortical water diffusion rates with a stretched- exponential model. Magn Reson Med. 2003;50(4):727–34. doi: 10.1002/mrm.10581. [DOI] [PubMed] [Google Scholar]
- 25.Lee JH, Springer CS., Jr. Effects of equilibrium exchange on diffusion- weighted NMR signals: the diffusigraphic “shutter-speed”. Magn Reson Med. 2003;49(3):450–8. doi: 10.1002/mrm.10402. [DOI] [PubMed] [Google Scholar]
- 26.Kwee TC, Galbán CJ, Tsien C, et al. Intravoxel water diffusion heterogeneity imaging of human high-grade gliomas. NMR Biomed. 2009 doi: 10.1002/nbm.1441. In Press. [DOI] [PMC free article] [PubMed] [Google Scholar]
- 27.Beaulieu C. The basis of anisotropic water diffusion in the nervous system - a technical review. NMR Biomed. 2002;15(7-8):435–55. doi: 10.1002/nbm.782. [DOI] [PubMed] [Google Scholar]
- 28.Chenevert TL, Brunberg JA, Pipe JG. Anisotropic diffusion in human white matter: demonstration with MR techniques in vivo. Radiology. 1990;177(2):401–5. doi: 10.1148/radiology.177.2.2217776. [DOI] [PubMed] [Google Scholar]
- 29.Mori S, Frederiksen K, van Zijl PC, et al. Brain white matter anatomy of tumor patients evaluated with diffusion tensor imaging. Ann Neurol. 2002;51(3):377–80. doi: 10.1002/ana.10137. [DOI] [PubMed] [Google Scholar]
- 30.Mori S, van Zijl PC. Fiber tracking: principles and strategies - a technical review. NMR Biomed. 2002;15(7-8):468–80. doi: 10.1002/nbm.781. [DOI] [PubMed] [Google Scholar]
- 31.Moseley M. Diffusion tensor imaging and aging - a review. NMR Biomed. 2002;15(7-8):553–60. doi: 10.1002/nbm.785. [DOI] [PubMed] [Google Scholar]
- 32.Moseley ME, Kucharczyk J, Asgari HS, et al. Anisotropy in diffusion- weighted MRI. Magn Reson Med. 1991;19(2):321–6. doi: 10.1002/mrm.1910190222. [DOI] [PubMed] [Google Scholar]
- 33.Alexander AL, Hasan K, Kindlmann G, et al. A geometric analysis of diffusion tensor measurements of the human brain. Magn Reson Med. 2000;44(2):283–91. doi: 10.1002/1522-2594(200008)44:2<283::aid-mrm16>3.0.co;2-v. [DOI] [PubMed] [Google Scholar]
- 34.Papadakis NG, Xing D, Houston GC, et al. A study of rotationally invariant and symmetric indices of diffusion anisotropy. Magn Reson Imaging. 1999;17(6):881–92. doi: 10.1016/s0730-725x(99)00029-6. [DOI] [PubMed] [Google Scholar]
- 35.Westin CF, Maier SE, Mamata H, et al. Processing and visualization for diffusion tensor MRI. Med Image Anal. 2002;6(2):93–108. doi: 10.1016/s1361-8415(02)00053-1. [DOI] [PubMed] [Google Scholar]
- 36.Chenevert TL, McKeever PE, Ross BD. Monitoring early response of experimental brain tumors to therapy using diffusion magnetic resonance imaging. Clin Cancer Res. 1997;3(9):1457–66. [PubMed] [Google Scholar]
- 37.Lope-Piedrafita S, Garcia-Martin ML, Galons JP, et al. Longitudinal diffusion tensor imaging in a rat brain glioma model. NMR Biomed. 2008;21(8):799–808. doi: 10.1002/nbm.1256. [DOI] [PMC free article] [PubMed] [Google Scholar]
- 38.Melhem ER, Mori S, Mukundan G, et al. Diffusion tensor MR imaging of the brain and white matter tractography. AJR Am J Roentgenol. 2002;178(1):3–16. doi: 10.2214/ajr.178.1.1780003. [DOI] [PubMed] [Google Scholar]
- 39.Gauvain KM, McKinstry RC, Mukherjee P, et al. Evaluating pediatric brain tumor cellularity with diffusion-tensor imaging. AJR Am J Roentgenol. 2001;177(2):449–54. doi: 10.2214/ajr.177.2.1770449. [DOI] [PubMed] [Google Scholar]
- 40.Guo AC, Cummings TJ, Dash RC, et al. Lymphomas and high-grade astrocytomas: comparison of water diffusibility and histologic characteristics. Radiology. 2002;224(1):177–83. doi: 10.1148/radiol.2241010637. [DOI] [PubMed] [Google Scholar]
- 41.Kono K, Inoue Y, Nakayama K, et al. The role of diffusion-weighted imaging in patients with brain tumors. AJNR Am J Neuroradiol. 2001;22(6):1081–8. [PMC free article] [PubMed] [Google Scholar]
- 42.Sugahara T, Korogi Y, Kochi M, et al. Usefulness of diffusion-weighted MRI with echo-planar technique in the evaluation of cellularity in gliomas. J Magn Reson Imaging. 1999;9(1):53–60. doi: 10.1002/(sici)1522-2586(199901)9:1<53::aid-jmri7>3.0.co;2-2. [DOI] [PubMed] [Google Scholar]
- 43.Castillo M, Smith JK, Kwock L, et al. Apparent diffusion coefficients in the evaluation of high-grade cerebral gliomas. AJNR Am J Neuroradiol. 2001;22(1):60–4. [PMC free article] [PubMed] [Google Scholar]
- 44.Gupta RK, Sinha U, Cloughesy TF, et al. Inverse correlation between choline magnetic resonance spectroscopy signal intensity and the apparent diffusion coefficient in human glioma. Magn Reson Med. 1999;41(1):2–7. doi: 10.1002/(sici)1522-2594(199901)41:1<2::aid-mrm2>3.0.co;2-y. [DOI] [PubMed] [Google Scholar]
- 45.Bastin ME, Sinha S, Whittle IR, et al. Measurements of water diffusion and T1 values in peritumoural oedematous brain. Neuroreport. 2002;13(10):1335–40. doi: 10.1097/00001756-200207190-00024. [DOI] [PubMed] [Google Scholar]
- 46.Sinha S, Bastin ME, Whittle IR, et al. Diffusion tensor MR imaging of high- grade cerebral gliomas. AJNR Am J Neuroradiol. 2002;23(4):520–7. [PMC free article] [PubMed] [Google Scholar]
- 47.Provenzale JM, McGraw P, Mhatre P, et al. Peritumoral brain regions in gliomas and meningiomas: investigation with isotropic diffusion-weighted MR imaging and diffusion-tensor MR imaging. Radiology. 2004;232(2):451–60. doi: 10.1148/radiol.2322030959. [DOI] [PubMed] [Google Scholar]
- 48.Stadnik TW, Chaskis C, Michotte A, et al. Diffusion-weighted MR imaging of intracerebral masses: comparison with conventional MR imaging and histologic findings. AJNR Am J Neuroradiol. 2001;22(5):969–76. [PMC free article] [PubMed] [Google Scholar]
- 49.Field AS, Alexander AL. Diffusion tensor imaging in cerebral tumor diagnosis and therapy. Top Magn Reson Imaging. 2004;15(5):315–24. doi: 10.1097/00002142-200410000-00004. [DOI] [PubMed] [Google Scholar]
- 50.Brunberg JA, Chenevert TL, McKeever PE, et al. In vivo MR determination of water diffusion coefficients and diffusion anisotropy: correlation with structural alteration in gliomas of the cerebral hemispheres. AJNR Am J Neuroradiol. 1995;16(2):361–71. [PMC free article] [PubMed] [Google Scholar]
- 51.Krabbe K, Gideon P, Wagn P, et al. MR diffusion imaging of human intracranial tumours. Neuroradiology. 1997;39(7):483–9. doi: 10.1007/s002340050450. [DOI] [PubMed] [Google Scholar]
- 52.Lu S, Ahn D, Johnson G, et al. Peritumoral diffusion tensor imaging of high- grade gliomas and metastatic brain tumors. AJNR Am J Neuroradiol. 2003;24(5):937–41. [PMC free article] [PubMed] [Google Scholar]
- 53.Lu S, Ahn D, Johnson G, et al. Diffusion-tensor MR imaging of intracranial neoplasia and associated peritumoral edema: introduction of the tumor infiltration index. Radiology. 2004;232(1):221–8. doi: 10.1148/radiol.2321030653. [DOI] [PubMed] [Google Scholar]
- 54.Inoue T, Ogasawara K, Beppu T, et al. Diffusion tensor imaging for preoperative evaluation of tumor grade in gliomas. Clin Neurol Neurosurg. 2005;107(3):174–80. doi: 10.1016/j.clineuro.2004.06.011. [DOI] [PubMed] [Google Scholar]
- 55.Wieshmann UC, Symms MR, Parker GJ, et al. Diffusion tensor imaging demonstrates deviation of fibres in normal appearing white matter adjacent to a brain tumour. J Neurol Neurosurg Psychiatry. 2000;68(4):501–3. doi: 10.1136/jnnp.68.4.501. [DOI] [PMC free article] [PubMed] [Google Scholar]
- 56.Pierpaoli C, Jezzard P, Basser PJ, et al. Diffusion tensor MR imaging of the human brain. Radiology. 1996;201(3):637–48. doi: 10.1148/radiology.201.3.8939209. [DOI] [PubMed] [Google Scholar]
- 57.Shimony JS, McKinstry RC, Akbudak E, et al. Quantitative diffusion-tensor anisotropy brain MR imaging: normative human data and anatomic analysis. Radiology. 1999;212(3):770–84. doi: 10.1148/radiology.212.3.r99au51770. [DOI] [PubMed] [Google Scholar]
- 58.Field AS, Alexander AL, Wu YC, et al. Diffusion tensor eigenvector directional color imaging patterns in the evaluation of cerebral white matter tracts altered by tumor. J Magn Reson Imaging. 2004;20(4):555–62. doi: 10.1002/jmri.20169. [DOI] [PubMed] [Google Scholar]
- 59.Mardor Y, Roth Y, Ochershvilli A, et al. Pretreatment prediction of brain tumors’ response to radiation therapy using high b-value diffusion-weighted MRI. Neoplasia. 2004;6(2):136–42. doi: 10.1593/neo.03349. [DOI] [PMC free article] [PubMed] [Google Scholar]
- 60.Chenevert TL, Stegman LD, Taylor JM, et al. Diffusion magnetic resonance imaging: an early surrogate marker of therapeutic efficacy in brain tumors. J Natl Cancer Inst. 2000;92(24):2029–36. doi: 10.1093/jnci/92.24.2029. [DOI] [PubMed] [Google Scholar]
- 61.Hall DE, Moffat BA, Stojanovska J, et al. Therapeutic efficacy of DTI-015 using diffusion magnetic resonance imaging as an early surrogate marker. Clin Cancer Res. 2004;10(23):7852–9. doi: 10.1158/1078-0432.CCR-04-1218. [DOI] [PubMed] [Google Scholar]
- 62.Henning EC, Azuma C, Sotak CH, et al. Multispectral tissue characterization in a RIF-1 tumor model: monitoring the ADC and T2 responses to single-dose radiotherapy. Part II. Magn Reson Med. 2007;57(3):513–9. doi: 10.1002/mrm.21178. [DOI] [PubMed] [Google Scholar]
- 63.Kim H, Morgan DE, Buchsbaum DJ, et al. Early therapy evaluation of combined anti-death receptor 5 antibody and gemcitabine in orthotopic pancreatic tumor xenografts by diffusion-weighted magnetic resonance imaging. Cancer Res. 2008;68(20):8369–76. doi: 10.1158/0008-5472.CAN-08-1771. [DOI] [PMC free article] [PubMed] [Google Scholar]
- 64.McConville P, Hambardzumyan D, Moody JB, et al. Magnetic resonance imaging determination of tumor grade and early response to temozolomide in a genetically engineered mouse model of glioma. Clin Cancer Res. 2007;13(10):2897–904. doi: 10.1158/1078-0432.CCR-06-3058. [DOI] [PubMed] [Google Scholar]
- 65.Stegman LD, Rehemtulla A, Hamstra DA, et al. Diffusion MRI detects early events in the response of a glioma model to the yeast cytosine deaminase gene therapy strategy. Gene Ther. 2000;7(12):1005–10. doi: 10.1038/sj.gt.3301199. [DOI] [PubMed] [Google Scholar]
- 66.Galons JP, Altbach MI, Paine-Murrieta GD, et al. Early increases in breast tumor xenograft water mobility in response to paclitaxel therapy detected by non invasive diffusion magnetic resonance imaging. Neoplasia. 1999;1(2):113–7. doi: 10.1038/sj.neo.7900009. [DOI] [PMC free article] [PubMed] [Google Scholar]
- 67.Jennings D, Hatton BN, Guo J, et al. Early response of prostate carcinoma xenografts to docetaxel chemotherapy monitored with diffusion MRI. Neoplasia. 2002;4(3):255–62. doi: 10.1038/sj.neo.7900225. [DOI] [PMC free article] [PubMed] [Google Scholar]
- 68.Kim S, Loevner L, Quon H, et al. Diffusion-weighted magnetic resonance imaging for predicting and detecting early response to chemoradiation therapy of squamous cell carcinomas of the head and neck. Clin Cancer Res. 2009;15(3):986–94. doi: 10.1158/1078-0432.CCR-08-1287. [DOI] [PMC free article] [PubMed] [Google Scholar]
- 69.Lee KC, Bradley DA, Hussain M, et al. A feasibility study evaluating the functional diffusion map as a predictive imaging biomarker for detection of treatment response in a patient with metastatic prostate cancer to the bone. Neoplasia. 2007;9(12):1003–11. doi: 10.1593/neo.07954. [DOI] [PMC free article] [PubMed] [Google Scholar]
- 70.Pickles MD, Gibbs P, Lowry M, et al. Diffusion changes precede size reduction in neoadjuvant treatment of breast cancer. Magn Reson Imaging. 2006;24(7):843–7. doi: 10.1016/j.mri.2005.11.005. [DOI] [PubMed] [Google Scholar]
- 71.Yankeelov TE, Lepage M, Chakravarthy A, et al. Integration of quantitative DCE-MRI and ADC mapping to monitor treatment response in human breast cancer: initial results. Magn Reson Imaging. 2007;25(1):1–13. doi: 10.1016/j.mri.2006.09.006. [DOI] [PMC free article] [PubMed] [Google Scholar]
- 72.Kamel IR, Liapi E, Reyes DK, et al. Unresectable hepatocellular carcinoma: serial early vascular and cellular changes after transarterial chemoembolization as detected with MR imaging. Radiology. 2009;250(2):466–73. doi: 10.1148/radiol.2502072222. [DOI] [PMC free article] [PubMed] [Google Scholar]
- 73.Dudeck O, Zeile M, Pink D, et al. Diffusion-weighted magnetic resonance imaging allows monitoring of anticancer treatment effects in patients with soft- tissue sarcomas. J Magn Reson Imaging. 2008;27(5):1109–13. doi: 10.1002/jmri.21358. [DOI] [PubMed] [Google Scholar]
- 74.Harry VN, Semple SI, Gilbert FJ, et al. Diffusion-weighted magnetic resonance imaging in the early detection of response to chemoradiation in cervical cancer. Gynecol Oncol. 2008;111(2):213–20. doi: 10.1016/j.ygyno.2008.07.048. [DOI] [PubMed] [Google Scholar]
- 75.Schubert MI, Wilke M, Muller-Weihrich S, et al. Diffusion-weighted magnetic resonance imaging of treatment-associated changes in recurrent and residual medulloblastoma: preliminary observations in three children. Acta Radiol. 2006;47(10):1100–4. doi: 10.1080/02841850600990300. [DOI] [PubMed] [Google Scholar]
- 76.Mardor Y, Pfeffer R, Spiegelmann R, et al. Early detection of response to radiation therapy in patients with brain malignancies using conventional and high b-value diffusion-weighted magnetic resonance imaging. J Clin Oncol. 2003;21(6):1094–100. doi: 10.1200/JCO.2003.05.069. [DOI] [PubMed] [Google Scholar]
- 77.Tomura N, Narita K, Izumi J, et al. Diffusion changes in a tumor and peritumoral tissue after stereotactic irradiation for brain tumors: possible prediction of treatment response. J Comput Assist Tomogr. 2006;30(3):496–500. doi: 10.1097/00004728-200605000-00024. [DOI] [PubMed] [Google Scholar]
- 78.Huang CF, Chou HH, Tu HT, et al. Diffusion magnetic resonance imaging as an evaluation of the response of brain metastases treated by stereotactic radiosurgery. Surg Neurol. 2008;69(1):62–8. doi: 10.1016/j.surneu.2007.02.021. discussion 68. [DOI] [PubMed] [Google Scholar]
- 79.Moffat BA, Chenevert TL, Lawrence TS, et al. Functional diffusion map: a noninvasive MRI biomarker for early stratification of clinical brain tumor response. Proc Natl Acad Sci U S A. 2005;102(15):5524–9. doi: 10.1073/pnas.0501532102. [DOI] [PMC free article] [PubMed] [Google Scholar]
- 80.Meyer CR, Boes JL, Kim B, et al. Demonstration of accuracy and clinical versatility of mutual information for automatic multimodality image fusion using affine and thin-plate spline warped geometric deformations. Med Image Anal. 1997;1(3):195–206. doi: 10.1016/s1361-8415(97)85010-4. [DOI] [PubMed] [Google Scholar]
- 81.Meyer C, Chenevert T, Galban C, et al. Parametric Response Mapping: a voxel-based analysis of quantitative diffusion MRI changes for individualized assessment of primary breast cancer response to therapy. Proceedings 17th Scientific Meeting, International Society for Magnetic Resonance in Medicine. April 18-24. 2009:2223. [Google Scholar]
- 82.Galbán CJ, Chenevert TL, Meyer CR, et al. The Parametric Response Map: An Imaging Biomarker for Early Cancer Treatment Outcome. Nature Medicine. 2009;15(5):572–6. doi: 10.1038/nm.1919. [DOI] [PMC free article] [PubMed] [Google Scholar]
- 83.Wai Y, Chu J, Wang C, et al. An integrated diffusion map for the analysis of diffusion properties: a feasibility study in patients with acoustic neuroma. Acad Radiol. 2009;16(4):428–34. doi: 10.1016/j.acra.2008.10.014. [DOI] [PubMed] [Google Scholar]
- 84.Ellingson B, Malkin M, Rand S, et al. Functional diffusion maps applied to FLAIR abnormal areas are valuable for the clinical monitoring of recurrent brain tumors. Proceedings 17th Scientific Meeting, International Society for Magnetic Resonance in Medicine. April 18-24. 2009:285. [Google Scholar]
- 85.Hamstra DA, Galban CJ, Meyer CR, et al. Functional diffusion map as an early imaging biomarker for high-grade glioma: correlation with conventional radiologic response and overall survival. J Clin Oncol. 2008;26(20):3387–94. doi: 10.1200/JCO.2007.15.2363. [DOI] [PMC free article] [PubMed] [Google Scholar]


