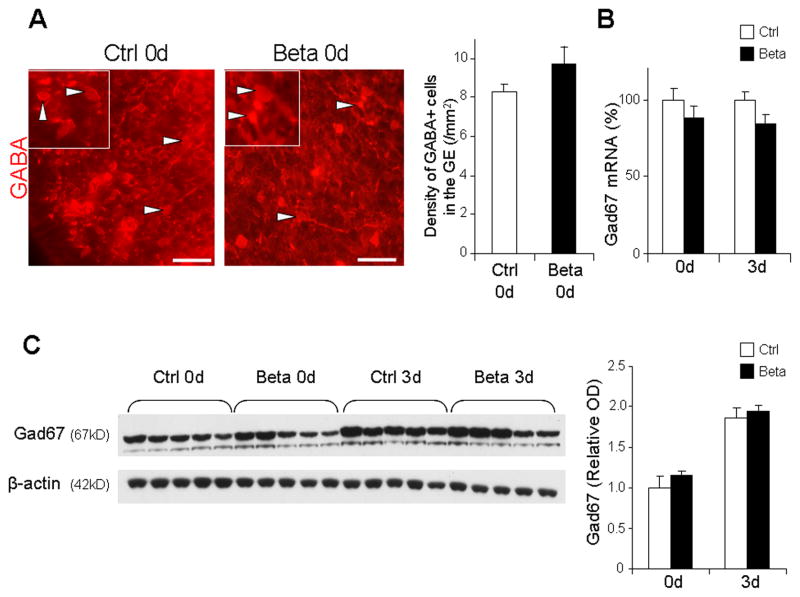
Fig. 3. Betamethasone treatment does not affect the density of GABA+ interneurons.
A. Representative coronal sections from the ganglionic eminence of 0d pups treated with betamethasone (Beta) and untreated control (Ctrl) labeled with GABA antibodies. Inset shows GABA+ cells under high magnification. Bar graphs are mean ± SEM (n=5 each group). The density of GABA+ cells (arrowhead) was similar between the pups treated with betamethasone compared to controls. Scale bar, 25 μm. B. Gad67 mRNA expression in betamethasone treated pups (Beta) and untreated controls (Ctrl) at 0d and 3d. Bar graph shows mean ± SEM (n=5 each group). Note that Gad67 mRNA levels were comparable between groups. C. Representative Western blot analyses of Gad67 in betamethasone treated pups and untreated controls at 0d and 3d. Bar graphs are mean ± SEM (n=5 each group). Protein concentration normalized to β-actin. Gad67 protein levels were similar between the groups.

