

Abstract
A comparison of different data-independent fragmentation methods combined with liquid chromatography (LC) coupled to high resolution Fourier-transform ion cyclotron resonance (FT-ICR) tandem mass spectrometry (MS) is presented for top-down MS of protein mixtures. Proteins composing the 20S and 19S proteasome complex and their post-translational modifications were identified using a 15-Tesla FT-ICR mass spectrometer. The data-independent fragmentation modes with LC timescales allowed for higher duty cycle measurements that better suit on-line LC-FT-ICR-MS. Protein top-down dissociation was effected by funnel-skimmer collisionally activated dissociation (FS-CAD) and CASI (Continuous Accumulation of Selected Ions)-CAD. The N-terminus for 9 out of the 14 20S proteasome proteins were found to be modified, and the α3 protein was found to be phosphorylated; these results are consistent with previous reports. Mass measurement accuracy with the LC-FT-ICR system for the 20–30 kDa 20S proteasome proteins was 1 ppm. The intact mass of the 100 kDa Rpn1 subunit from the 19S proteasome complex regulatory particle was measured with a deviation of 17 ppm. The CASI-CAD technique is a complementary tool for intact protein fragmentation and is an effective addition to the growing inventory of dissociation methods which are compatible with on-line protein separation coupled to FT-ICR MS.
Keywords: Top-down mass spectrometry, Fourier-transform ion cyclotron resonance, Proteasome, Protein LC-MS, Electrospray ionization, Data-independent tandem mass spectrometry
1 Introduction
Protein identification by top-down mass spectrometry (MS) and top-down proteomics are valuable for the analysis of complex samples (e.g., cell lysates) as well as for mixtures of relatively few proteins, such as endogenous protein complexes. Although more established bottom-up methodologies have current advantages, such as well-developed protocols [1], efficient on-line peptide chromatography [2], and mature bioinformatics support [3], measuring proteins in their intact form and with subsequent fragmentation is still unmatched in the extent of information it can yield. Protein top-down MS yields the intact mass(es) of the proteins [4, 5] and the presence of “proteoforms” [6], which cannot be efficiently identified by conventional bottom-up methods. Even if compared to the bottom-up identification of post-translational modifications (PTMs) using sample enrichment techniques, bottom-up methods cannot provide information on the localization of combinatorial modifications as efficiently as the top-down approach.
Identification of a large set of proteins on the liquid chromatography (LC) separation timescale by top-down LC-MS/MS was accomplished by Kelleher’s group in 2007 [7]. Since then, separation techniques and mass spectrometric instrumentation have improved for identifying intact proteins from more complex samples [8, 9]. Significant achievements in the recent times include the incorporation of electron transfer dissociation (ETD) and Orbitrap-based higher energy collisional dissociation (HCD) during on-line protein elution to improve sequence coverage [10, 11].
Currently, in-source (IS) fragmentation (e.g., nozzle-skimmer dissociation, NSD) [12, 13] and collisionally activated dissociation (CAD) are the predominant methods for performing top-down protein identification on the LC timescale, due to shorter data averaging time required and higher efficiency for fragmenting high MW proteins during on-line elution [14, 15]. ETD requires a longer duration to average data from the far larger number of product ions obtained from the sequence independent fragmentation scheme it utilizes. ETD is currently limited to proteins under 20 kDa when eluted from a column [11], although Tysbin has shown impressive ETD-based top-down LC-MS for 150 kDa antibodies [16].
Most high-throughput top-down protein identification platforms use IS fragmentation and CAD. IS fragmentation is performed without precursor ion selection [12] and can be programmed to switch between high and low energies during on-line protein elution [17]. In contrast, CAD can be performed post-isolation of a precursor ion in a data-dependent manner. The CAD product ion data obtained from different precursor charge states of the same protein are merged during post-processing for sequence database searching [18]. In general, fragmenting several precursor ion charge states is preferred [19], as product ions obtained from different charge states can vary, so utilizing different charged precursors can increase sequence coverage [20, 21]. Therefore, a higher duty-cycle MS workflow that utilizes data-independent fragmentation of multiple charge states simultaneously would appear to be an effective means for protein identification by top-down MS.
We have developed a top-down MS method for the examination of endogenous protein complexes that involves nanoLC separation followed by on-line high resolution Fourier transform ion cyclotron resonance (FT-ICR) MS. Two different data-independent fragmentation techniques were employed to dissociate multiple intact protein charge states simultaneously. Funnel-skimmer dissociation (FS-CAD) in the higher pressure region of the atmosphere-vacuum interface is equivalent to the more widely known NSD, and has been successfully used by Agar’s group to fragment proteins up to 669 kDa in infusion experiments [22].
We compare FS-CAD to Continuous Accumulation of Selected Ions (CASI)-CAD for protein identification. CASI, which is performed in the high vacuum region of the mass spectrometer, has been used in the small-molecule field for its ability to selectively enrich molecules in complex matrices, especially during MS-based tissue imaging [23, 24]. Due to the high background when tissue imaging is used to probe for the presence of drugs and its metabolites, the isolation and accumulation of the compound enriches it from the other molecules and yields an accurate mass that often eliminates the need for performing MS/MS for validation [25, 26]. The original method for selectively accumulating ions in an external quadrupole prior to transferring them to the ICR cell was developed by Marshall and coworkers in the late 1990s [27]. They used this method for selectively zooming across an entire m/z range to obtain high resolution data for identifying compounds in crude oil samples [28]. Since then, this technique has been utilized to increase the signal-to-noise ratio by accumulating ions from selectively-scanned regions of the mass spectrum. Tipton et al. have used this ‘zoom-mapping’ approach for on-line top-down protein identification by selecting ions from two sequential 80–100 m/z windows for high-resolution mass measurement of precursor ions followed by a wide-range m/z scan for measuring the fragment ions generated by NSD. This resulted in baseline resolution and identification of proteins up to 72 kDa [15].
Here, we present CASI-CAD for top-down protein identification. This technique involves the simultaneous accumulation and dissociation of 6–7 precursor charge states during an on-line LC-MS analysis. Multiple charge states of each intact protein were isolated within an m/z window (typically m/z 800–1200) in an external quadrupole, transferred to a collision cell for accumulation and fragmentation, and the product ions were transferred downstream to the ICR cell for mass measurement.
Human 19S and 20S proteasomes were used as model complexes to test this top-down MS method. They form an integral part of the ubiquitin-proteasomal system that is responsible for degrading the majority of intracellular proteins [29]. The 20S complex (~700 kDa), also known as the core particle, consists of two alpha and two beta rings, which are stacked to form a hollow barrel-shaped structure (Fig. 1). This complex contains the active sites responsible for proteolysis [30]. In eukaryotes, each alpha ring is made up of 7 different alpha proteins and each beta ring is made up of 7 different beta proteins in eukaryotes. The 19S complex (~900 kDa), also called the regulatory particle, contains more than 19 different subunits ranging from 8 to 106 kDa, controls protein import, and contains ATPase subunits which power the complex for protein degradation [31].
Figure 1.

Schematic of the top-down protein identification strategy using nanoLC FT-ICR MS. The human 20S proteasome complex was separated into its components using a monolithic column followed by intact mass measurement and protein fragmentation using either (A) FS-CAD, (B) CASI-CAD, or (C) selectively enriching the fragments generated by FS-CAD using CASI. The intact protein and product ion masses were then searched against the sequence database for protein identification.
Prokaryotic and eukaryotic 20S complexes have been analyzed previously by both top-down [32, 33] and bottom-up approaches [34], and the N-terminus and the post-translational modifications (PTMs) of the subunits have already been characterized [35, 36]. The intact masses of the human 20S subunits have been deciphered by two-dimensional (2D) gel electrophoretic separation followed by eluting the intact proteins from the gel for further analysis with FT-ICR MS [33]. The 19S complex subunits have also been characterized to some extent by bottom-up methods [37], but the intact masses of these proteins have not yet been measured. In this work, we used FS-CAD (Fig. 1A) and CASI-CAD (Fig. 1B) techniques on a FT-ICR MS to identify proteins in the 20S complex. We have also measured the intact masses of the proteins in the 19S complex, including a 100 kDa protein. In addition to these two dissociation methods, we have explored the use of the CASI principle to enrich for fragment ions after dissociation in the funnel-skimmer region (Fig. 1C).
2 Materials and methods
2.1 Chemicals and sample preparation
LC-MS grade solvents were purchased from the following vendors: water and isopropanol from Baker-VWR (Radnor, PA, USA), and acetonitrile (ACN) from EMD (Billerica, MA, USA). High purity formic acid (FA) and trifluoroacetic acid (TFA) were from Thermo Scientific Pierce (Waltham, MA, USA). Human 20S and 19S proteasome complexes were purchased from Boston Biochem (Cambridge, MA, USA). Prior to loading on the HPLC column, the proteasome samples were denatured by diluting in 95/5/0.1 H2O/ACN/FA. Stock solutions of bovine ubiquitin (Sigma-Aldrich, St. Louis, MO, USA) were prepared at 1 mg/mL in MS-grade water, and were then diluted to 500 fmol/μL in 50/49.9/0.1 H2O/ACN/FA (v/v/v) and used for calibrating the mass spectrometer.
2.2 HPLC and MS
Chromatography was performed using a Dionex Ultimate 3000 Rapid Separation LC system (Thermo Scientific, Waltham, MA, USA), which consists of a binary high-pressure gradient pump and a ternary low-pressure loading pump. The 20S proteasome complex (100 fmol) was injected onto a Dionex PepSwift reversed-phase monolithic trapping column (200 μm × 5 cm) and washed for 10 min with 99.95% H2O/0.05% TFA at 5 μL/min flow rate using the loading pump. This was followed by gradient elution onto the Dionex PepSwift reversed-phase monolithic analytical column (100 μm × 25 cm). Solvent A was 99.9% H2O/0.1% FA and solvent B was 99.9% ACN/0.1% FA. The flow rate was 1 μL/min, and the following gradient was used: isocratic hold at 10% B for 10 min followed by three steps of linear increases to 25% B at 15 min, 50% B at 49 min, and 80% B at 54 min, followed by an isocratic hold at 80% B for 5 min, and finally equilibrated at 10% B for 10 min. Both the analytical and trapping columns were held at 60°C throughout the run to assist in protein separation. For separating the proteins in the 19S complex, solvent B in the gradient pump was changed to 90/10/0.1 ACN/ isopropanol (IPA)/FA, and the gradient program used was the same as above.
The Dionex nanoLC system was connected in-line with the solariX hybrid Qq-15 Tesla FT-ICR mass spectrometer using the CaptiveSpray electrospray source (Bruker Daltonics, Billerica, MA, USA). This source consists of a non-tapered 20 μm i.d. silica tip that produces a stable spray with minimized clogging. The MS source parameters were optimized for the LC flow rate of 1 μL/min: 2.5 L/min drying gas flow at a temperature of 180°C, −1.5 kV capillary voltage. The capillary exit and deflector plate were at 250 V and 230 V, respectively. For intact mass measurement of the 20S subunits, funnel 1 and skimmer 1 were held at 140 V and 30 V, respectively. The skimmer 1 potential was increased to 60 V for measuring the larger MW subunits in the 19S complex to better dissociate the salt/buffer protein adducts. To fragment proteins in the funnel-skimmer region, the skimmer 1 potential was increased to 100 V. The potential of funnel 2, which is downstream to skimmer 1, remained at 6 V in all of the experiments. The data were acquired in the broadband detection mode, using 1 mega-word data points, over the m/z 150–3000 range. The total duration of a MS scan event was 0.63 sec, which includes a transient length of 0.34 sec. The number of scans averaged for one spectrum was set to one.
For performing CASI-CAD fragmentation, the ions between m/z 800–1200 were selected in the quadrupole by setting the Q1 mass to m/z 1000 and using an isolation width of m/z 400. Ions were accumulated for 0.2 sec in the collision cell and an optimized collision energy of 14.5 V was applied to induce fragmentation.
The instrument was calibrated externally by infusing 500 fmol/μL of ubiquitin at a flow rate of 1 μL/min using a syringe pump through the CaptiveSpray source. The most abundant peaks from the 13+ to 6+ charge states of ubiquitin were used for calibration and a mass accuracy of 0.1–0.3 ppm was routinely obtained for the ubiquitin peaks.
2.3 Data analysis
The total ion chromatograms (TICs) obtained from LC-MS and LC-MS/MS runs were smoothed using the Gaussian smoothing algorithm (0.8 sec width for 1 cycle) in DataAnalysis 4.0 (Bruker Daltonics). Mass spectra were obtained by manually integrating the apex of each peak in the TIC. Charge state distributions of the intact proteins and fragment ions from the tandem MS experiments were deconvoluted using the Sophisticated Numerical Annotation Procedure (SNAP) II algorithm within DataAnalysis 4.0, which determines the monoisotopic MH+ for both intact and fragment ions. The mass lists obtained were exported and converted to neutral masses by subtracting the mass of a proton (1.007276 Da). Because both FS-CAD and CASI-CAD are data-independent fragmentation methods, the MS/MS data files do not contain precursor ions; hence, the mass of the protein being fragmented was manually added to each file as the precursor mass. ProSight 2.0 was used to search the human top-down complex database, which is built from UniProt release 2012_06 and can be downloaded in ProSight warehouse format file from the following site: ftp://prosightpc.northwestern.edu/2012_06/Eukaryotes/Homo%20sapiens/
This database contains 1,496,086 basic sequences and supports top-down searches with known N-terminal modifications, PTMs, alternative splice forms, and endogenous cleavage events. The Absolute Mass type of search, which matches the observed precursor mass to the theoretical mass within the specified mass window, followed by comparing the theoretical fragments from all the proteins within the tolerance limit to the observed fragments, was used to search the database. The following parameters were used during the search: precursor mass tolerance of ± 2 Da (to account for mass discrepancies from biological events, e.g., amidation or deamidation, and/or errors during deconvolution), fragment mass tolerance of ± 10 ppm, and N-terminal acetylation and phosphorylation as potential modifications.
3 Results and discussion
3.1 LC-MS of 20S proteasome using nanoLC-FT-ICR MS
The 20S complex (70 ng or 100 fmol total) was loaded onto a reversed-phase monolithic (polymeric (PS-DVB) material [38–40]) column and the protein subunits were eluted between 27–42 min, as illustrated in the TIC (Fig. 2, bottom panel). In the top panel of Fig. 2, a simulated “gel”-view of the same elution window as in the TIC is shown, with the x- and y-axes representing elution time and m/z, respectively. The protein(s) eluting in each peak in the TIC is represented by a set(s) of bands in the gel-view that corresponds to the charge state distribution of the protein. The intact ESI mass spectra of four 20S subunits eluting in the TIC is displayed in Supplemental Fig. 1. A resolving power of 45,000–50,000 was routinely obtained for all of the proteins with the data points averaged from 15–20 seconds peak widths at the apex of the peak on the LC timescale.
Figure 2.

TIC from the LC-MS of the 20S proteasome proteins. All 14 subunits elute within 27–42 min (peaks 1–11, bottom panel). A simulated gel-view of the proteins eluting in each peak is depicted in the top panel for the corresponding elution window shown in the TIC. With the intact and product ion masses, the proteins were identified by database searching and the peaks were labeled with the corresponding protein(s) being eluted (bottom-panel). α and β subunits are labeled in red and green respectively. Peak 7, labeled with an *, was found to contain oxidized form of β2 subunit.
The chromatographic peak full-width at half maximum (FWHM) values were found to be within 15–30 seconds for all protein peaks, except for peaks 1 and 9, which have peak widths of 1 min and comprise proteins approaching 30 kDa. Increasing peak widths with increasing protein size is a general trend, with peak widths in the range of 1–2 min for proteins of 35–50 kDa with PLRP columns [15, 41]. For intact protein analysis, when compared to PLRP and silica based columns, monolithic columns generally give rise to smaller peak widths and shorter retention times [42], so rigorous comparisons can be done to evaluate the efficiency of these columns for intact protein LC-MS analysis. In our hands, the reproducibility of the peak elution time was found to be within ± 20 sec, for both intra- and inter-day runs.
3.2 LC-MS/MS using data-independent fragmentation methods
To identify proteins from the 20S complex, two different data-independent fragmentation methods, FS-CAD and CASI-CAD, were used.
3.2.1 Protein identification using FS-CAD
FS-CAD occurs in the region between the first and second ion funnel and provides higher transfer efficiencies for large, multiply-charged ions (Fig. 3). Protein fragmentation in the funnel-skimmer region was facilitated by increasing the declustering potential voltage of skimmer 1 in the source region. A skimmer 1 voltage of 100 V corresponding to a ΔSF (skimmer 1 – funnel 2 voltage) of 94 V yielded the highest sequence coverage for the proteins measured and was used to fragment the 20S subunits during on-line elution. (A skimmer 1 voltage of 30 V was used for the intact mass measurements.) A product ion mass list generated for each subunit by averaging the data points from each peak in the TIC was used for database searching. The experimental MW, the number of fragment ions matched (both b- and y-ions), the expectation value (e value) obtained from ProSight, and the nature of the N-terminus, as determined from the fragment ion data for all of the proteins in the 20S complex, are tabulated in Table 1. Thirteen out of the 14 20S subunit proteins were identified with product ion mass accuracies within 10 ppm. For the intact protein mass measurements, the errors in the measured mass were much lower, within an average deviation of only 1 ppm during the LC-MS runs (Supplemental Table 1).
Figure 3.

Schematic of Bruker 15-Tesla FT-ICR MS. The declustering voltage of skimmer 1 was increased to facilitate FS-CAD. During CASI-CAD, a window of m/z 800–1200 was chosen by the external quadrupole and all the ions within this range (shown in red) were transferred to the collision cell where it accumulated for a specified time interval and dissociated by CAD.
Table 1.
Human 20S proteasome subunits identified by LC-MS with FS-CAD and CASI-CAD fragmentation techniques. The largest number of ions matched by FS-CAD, CASI-CAD, and FS-CAD with CASI are highlighted in red, green, and blue, respectively.
| Uniprot ID | Protein subunit | Expt. MW (Monoisotopic) | Modification | Number of amino acids | FS-CAD | CASI-CAD | FS-CAD with CASI | |||
|---|---|---|---|---|---|---|---|---|---|---|
| Total b & y ions | e value | Total b & y ions | e value | Total b & y ions | e value | |||||
| P25786 | α1 | 29578.8498 | +Nacetyl Metini | 263 | 14 | 2.4E-04 | 17 | 1.65E-08 | 9 | 747 |
| P25787 | α2 | 25793.2227 | −Metini +Nacetyl Ala1 | 233 | 38 | 4.69E-28 | 48 | 2.62E-38 | 45 | 8.64E-32 |
| P25788 | α3 | 28405.9878 | −Metini +Nacetyl Ser1 +1 PO3− | 254 | 7 | 1.46 | 15 | 1.41E-05 | 17 | 3.97E-07 |
| P25789 | α4 | 29376.1224 | −Metini +Nacetyl Ser1 | 260 | 50 | 4.94E-47 | 32 | 1.37E-19 | 62 | 4.98E-59 |
| P28066 | α5 | 26436.2068 | +Nacetyl Metini | 241 | 53 | 4.01E-48 | 42 | 4.15E-29 | 56 | 1.99E-58 |
| P60900 | α6 | 27292.7554 | −Metini +Nacetyl Ser1 | 245 | 67 | 4.18E-79 | 42 | 1.96E-42 | 62 | 1.88E-57 |
| O14818 | α7 | 27780.5607 | −Metini +Nacetyl Ser1 | 247 | 39 | 9.12E-36 | 18 | 7.29E-10 | 39 | 2.35E-29 |
| P20618 | β1 | 23533.9295 | No modification | 213 | 39 | 9.13E-31 | 27 | 6.01E-16 | 34 | 1.2E-20 |
| P49721 | β2 | 22863.6804 | +Nacetyl Metini | 201 | 28 | 1.25E-20 | 21 | 1.18E-09 | 33 | 1.89E-23 |
| P49720 | β3 | 22845.3970 | −Metini +Nacetyl Ser1 | 204 | 63 | 1.09E-70 | 56 | 1.09E-45 | 71 | 5.67E-68 |
| P28070 | β4 | 24376.1058 | No modification | 219 | 49 | 1.75E-57 | 48 | 1.82E-50 | 57 | 7.87E-63 |
| P28074 | β5 | 22444.0922 | No modification | 204 | 40 | 1.12E-38 | 25 | 3.42E-18 | 39 | 8.09E-33 |
| P28072 | β6 | 21889.7342 | No modification | 205 | 13 | 2.25E-10 | 27 | 8.33E-21 | 19 | 2.14E-12 |
| Q99436 | β7 | 25278.7467 | No modification | 234 | Co-elutes with β5 | - | Co-elutes with β5 | - | Co-elutes with β5 | - |
The FS-CAD mass spectrum of a 29 kDa protein is illustrated in Fig. 4. FS-CAD of this protein yielded a product ion-rich spectrum (Fig. 4A) with several 6–7 amino acid length sequence tags (Fig. 4B). Database searching identified this protein as the α4 subunit of the 20S complex, with an e value of 4.94E-47. (Low e values represent better matches and are less likely to be false positives.) Of the total 135 fragment ions obtained, 50 (32 b-ions and 18 y-ions) were matched (Fig. 4C), representing 48 of the possible 259 distinct inter-residue amide bond cleavages in the α4 protein by FS-CAD. This translates to 19% sequence coverage based on the 37% of the total fragments matched by the search. The relatively low sequence coverage and number of fragment ions matched may be due to the presence of a large number of internal fragments that were not interpreted. Agar’s group found preferential cleavage through proline and aspartic acid channels, and internal fragments which accounted for approximately half of the total fragment ions obtained during FS-CAD [43]. Current top-down MS search engines are limited in their ability to search for internal fragments (formed by two backbone amide bond cleavages in the protein and lack information about either termini). Future improvement in the database searching tools to utilize internal product ions after generating a list of potential protein hits would be very valuable for increasing sequence coverage.
Figure 4.

FS-CAD of the α4 20S proteasome subunit. (A) Full m/z range mass spectrum obtained after FS-CAD, with the inset showing the decharged isotopic distribution of α4 protein. (B) Magnified region of the mass spectrum showing the sequence tag identified from mapping the product ions. (C) Amino acid sequence of the α4 protein with the b- (red) and y- (green) product ions mapped by database searching. The sequence tag obtained by mapping the fragments in (B) is highlighted by the blue box.
3.2.2 Protein identification using CASI-CAD
CASI-CAD, which has not yet been explored extensively for proteins, was performed by choosing an appropriate m/z range in the external quadrupole. All the ions within this range were accumulated for a specified time interval in the collision cell and fragmented by CAD (Fig. 3). For example, for the analysis of bovine ubiquitin, only ions between ca. m/z 800–1200 were selected in the external quadrupole, which predominantly isolates the 10+ to 8+ charge states and the selected ions were then transferred to the collision cell and fragmented by CAD (Supplemental Fig. 2). (The m/z 800–1200 window was chosen to optimize conditions for the analysis of the proteasome subunits (vide infra).)
CASI-CAD is a data-independent method; it eliminates the need for spending instrument time on precursor selection. For top-down LC-MS, this increases the duty cycle of the experiment and results in higher product ion signal-to-noise compared to data-dependent acquisitions because it eliminates the need to separately select, for example, the three most abundant precursor charge states for product ion generation within the timescale of the chromatographic peak.
The ESI charge state distributions for the 20–30 kDa proteins in the 20S proteasome complex lie within m/z 700–2000. To yield a product ion-rich spectrum [44], a m/z 800–1200 window was selected that included the intermediate (and abundant) charge states, and this isolated 6–12 precursors, varying from 38+ to 17+ charges, depending on the protein.
The ion accumulation time in the collision cell was set to 0.2 sec for the CASI-CAD experiments. Increasing the accumulation time to 0.3 sec did not yield higher sequence coverage; the number of product ions exported for database searching, the number of product ions matched, and the product ion intensities were nearly the same as for 0.2 sec (Supplemental Fig. 3 and inset table and Supplemental Fig. 4). Generally, shorter ion accumulation times increased the duty cycle for MS/MS measurements during the LC peak elution time.
The MS/MS data obtained from CASI-CAD experiments were processed and searched with the same parameters as FS-CAD and the results from these identifications are summarized in Table 1. As for the FS-CAD mediated protein identification, CASI-CAD also identified 13 out of the total 14 subunits with product ion mass accuracies of under 10 ppm. An example of CASI-CAD fragmentation of the α4 subunit is displayed in Fig. 5A, showing the fragment ions obtained after dissociating the intact protein ions between m/z 800–1200 that were enriched. A zoomed-in view is displayed in Fig. 5B to show the b9510+ – b9910+ sequence tag. The overall sequence coverage obtained for the α4 subunit is shown in Fig. 5C. The β7 subunit was the only protein not identified by either fragmentation techniques; it co-eluted with the β5 subunit and did not yield any measurable product ions.
Figure 5.

CASI-CAD of α4 20S proteasome subunit. (A) Mass spectrum obtained after CASI-CAD, with the inset showing the decharged isotopic distribution of α4 protein. (B) Zoomed-in mass spectrum showing a sequence tag identified from mapping the product ions. (C) Amino acid sequence of the α4 protein with the b- (red) and y- (green) product ions mapped by database searching. The sequence tag obtained by mapping the fragments in (B) is highlighted in the blue box.
CASI-CAD generated larger numbers of matching fragments for three proteins (α1, α2, and β6 subunits; highlighted in green in Table 1) when compared to FS-CAD (highlighted in red in Table 1). The α1 subunit was found to co-elute with α7 and β6 co-eluted with β4. Similarly, α2 co-eluted with α6 but was identified with 48 product ions by CASI-CAD, whereas FS-CAD led to only 38 identifiable product ions. Moreover, examination of data for those proteins that were identified equally well by both methods indicates that these two methods are complementary. CASI-CAD therefore could be used as an additional tool to enrich for fragment ions from poorly-fragmenting proteins and from co-eluting proteins. Although protein fragmentation by both methods are based on CAD, the internal energy of the multiply charged protein ions at various stages in the mass spectrometer may be different, and so equivalent FS-CAD declustering potentials and CASI-CAD collision energies need to be compared in order to evaluate the relative efficiencies of each technique for generating high sequence coverage.
3.3 N-terminal characterization and PTM analyses
Data from both fragmentation methods showed that the N-terminus of all 7 α-subunits and 2 of the β-subunits were acetylated (Table 1). No protein modifications were identified on 5 of the β-subunits. From its measured intact molecular mass, the α3 subunit appeared to be phosphorylated (Table 1 and Supplemental Table 1). However, its poor fragmentation efficiency in either method did not allow further pinpointing of the phosphorylation site. The UniProt database suggests that Tyr160, Ser242, or Ser249 could be phosphorylated, and therefore, the y102–108 product ions measured for the α3 subunit were not helpful. Targeted studies on the characterization of the 20S proteasome complex using bottom-up [36] and top-down [33] methods have shown only Ser249 to be phosphorylated, but large-scale phosphopeptide profiling by ETD-MS/MS [45] and immunoaffinity-based profiling using tyrosine-specific antibodies [46] have shown Ser242 and Tyr160, respectively, to be phosphorylated as well. This variation could be due to different biological origins of the proteins [47].
MaxEnt decovolution of the α3 protein shows the presence of the unmodified form at 5 times lower abundance than the singly phosphorylated form (Fig. 6). This is consistent with an earlier 2D gel electrophoresis-based proteomics study of the 20S complex showing a much darker-stained 2D gel spot for the singly phosphorylated form of α3 (pSer249) relative to the non-phosphorylated form [33, 48]. The presence of the phosphorylated form of this protein at a higher abundance compared to the unmodified form of this protein and also compared to the other phosphorylated subunits in the proteasome complex has been observed by other groups as well [49] and it has been suggested that this phosphorylation stabilizes the association of the 19S regulatory complex to the 20S catalytic core complex to form the 26S functional proteasome [50].
Figure 6.

MaxEnt deconvoluted zero-charge mass spectrum of the α3 subunit with the singly phosphorylated form present at 5 times greater relative abundance to the non-phosphorylated form.
3.4 FS-CAD followed by CASI ion enrichment
In addition to using FS-CAD and CASI-CAD, we tested also the combination of FS-CAD with CASI to selectively enrich for product ions generated by FS-CAD. This was implemented by fragmenting the intact proteins by FS-CAD followed by accumulating the product ions within a selected m/z-range in the quadrupole before the ICR measurements. When the 20S proteasome subunits eluted from the LC column, skimmer 1 voltage was increased to 100 V to induce FS-CAD and the product ions within the m/z 800–1200 window were enriched in the quadrupole, but the collision energy was not applied, which would otherwise initiate further fragmentation. An ion accumulation time of 0.2 sec in the quadrupole was used for this method. Applying the CASI technique after FS-CAD resulted in selective enrichment of only those fragment ions that were within the m/z 800–1200 range, as opposed to scanning the entire mass window after the FS-CAD.
We found that using FS-CAD/CASI generated more matching product ions than FS-CAD alone. For example, for the α4 subunit, 50 b- and y-ions were measured by FS-CAD, while the FS-CAD/CASI method identified this protein with a total of 62 b- and y-ions (Supplemental Fig. 5). Enriching the fragments by using the CASI technique increases the total number of ions exported for the search and the e values obtained are lower for the CASI enriched data, indicating a more confident identification, with a larger number of fragment ions being matched. Similar improved results were obtained for 7 other proteins in the 20S complex (highlighted in blue in Table 1).
3.5 LC-MS of 19S proteasome subunits
The 19S complex is composed of at least 19 different canonical subunits of theoretical MWs ranging from 8–106 kDa and is relatively more dynamic than the 20S complex. LC-MS of the 19S complex was performed by changing the composition of solvent B to 90/10/0.1 ACN/IPA/FA to aid the recovery of the high-MW 19S subunits. Although IPA is effective at eluting high MW species from the HPLC column, higher amounts of IPA (such as 20%), resulted in higher back pressure and unstable spray, so 10% IPA was used for the 19S protein separations.
With 1 pmol of the 19S complex loaded onto the monolithic column, the intact masses of the 19S subunits were measured, including a 100 kDa subunit (Fig. 7). Rpn1 and Rpn2 are the two subunits in the 19S complex with theoretical MWs exceeding 100 kDa and these have been suggested to act as docking sites for proteins conjugated with ubiquitin for degradation, to coordinate deubiquitination, and to facilitate movement of the unfolded protein to the catalytic core [51]. Intact mass measurement by LC-MS yielded an average MW of 100.2392 kDa, which is 17 ppm from the theoretical value of 100.2409 kDa that was calculated for the Rpn1 subunit with an N-terminal acetylation modification (as identified by bottom-up studies [36]). Although tandem MS data would be required to unambiguously identify the protein, low-ppm mass errors for high mass proteins would be an added benefit and would help to identify homologous proteins.
Figure 7.
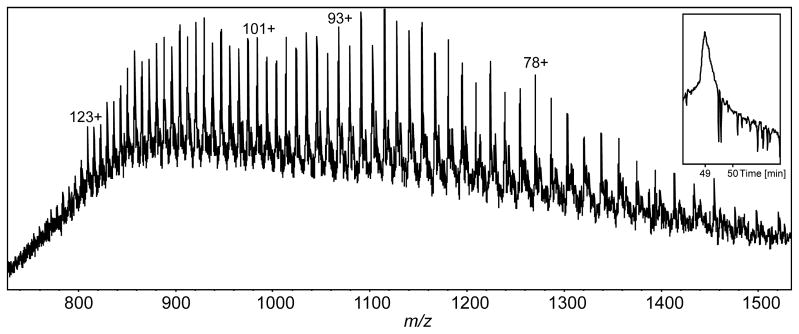
Intact mass spectrum of the 100 kDa Rpn1 h19S proteasome subunit averaged from the LC-MS peak (TIC shown in inset).
4 Concluding remarks
This FS-CAD/CASI-CAD strategy for top-down protein identification strategy utilizing on-line LC-FT-ICR MS can be applied to samples of medium complexity, such as identifying proteins in endogenous protein complexes. Generally, the factors that limit the number of proteins identified by on-line protein identification methods are the peak capacity of the LC column and the duty cycle of the instrument. The latter is especially an important issue for FT-ICR MS. Use of a data-independent fragmentation method reduced the acquisition time of a single scan event to 0.6 sec, which should be beneficial to FT-ICRs (and perhaps Orbitraps) that require 2–4 times as much time to acquire high resolution data [10, 52]. By decreasing the time per scan, high speed and sensitive separation techniques such as capillary electrophoresis with high resolution FT-ICR MS could be possible.
All protein subunits of the 19S and 20S complexes were measured with 1 ppm deviation using the ultra-high resolution of the FT-ICR instrument. This should also be a significant advantage for the analysis of complex cell lysates and the measurement of larger proteins. It becomes more difficult to differentiate biological changes (such as an amidation or deamidation) for larger proteins, so higher resolving power and mass accuracy should also lead to more assignments of larger internal-cleavage product ions. With further development of efficient fragmentation methods compatible with the LC timescale, higher resolution intact protein separation techniques compatible with on-line MS, and increased mass accuracy for high MW proteins, top-down protein identification will become a popular choice for the analysis of samples of higher complexity.
Supplementary Material
Acknowledgments
We thank Dr. Catherine S. Kaddis for carefully reviewing the manuscript and providing helpful suggestions and Dr. Julian P. Whitelegge for kindly giving access to their ProSight server. Support from the US National Institutes of Health (R01 GM103479, S10 RR023045, S10 RR028893) to JAL is acknowledged.
Footnotes
The authors have declared no conflict of interest.
References
- 1.Kocher T, Pichler P, Swart R, Mechtler K. Analysis of protein mixtures from whole-cell extracts by single-run nanoLC-MS/MS using ultralong gradients. Nature Protocols. 2012;7:882–890. doi: 10.1038/nprot.2012.036. [DOI] [PubMed] [Google Scholar]
- 2.Di Palma S, Hennrich ML, Heck AJ, Mohammed S. Recent advances in peptide separation by multidimensional liquid chromatography for proteome analysis. J Proteomics. 2012;75:3791–3813. doi: 10.1016/j.jprot.2012.04.033. [DOI] [PubMed] [Google Scholar]
- 3.Zhang Z. Automated Precursor Ion Exclusion During LC-MS/MS Data Acquisition for Optimal Ion Identification. J Am Soc Mass Spectrom. 2012;23:1400–1407. doi: 10.1007/s13361-012-0401-3. [DOI] [PubMed] [Google Scholar]
- 4.Kelleher NL, Lin HY, Valaskovic GA, Aaserud David J, et al. Top Down versus Bottom Up Protein Characterization by Tandem High-Resolution Mass Spectrometry. J Am Chem Soc. 1999;121:806–812. [Google Scholar]
- 5.Loo JA, Edmonds CG, Smith RD. Primary sequence information from intact proteins by electrospray ionization tandem mass spectrometry. Science. 1990;248:201–204. doi: 10.1126/science.2326633. [DOI] [PubMed] [Google Scholar]
- 6.Smith LM, Kelleher NL. The Consortium for Top Down Proteomics, Proteoform: a single term describing protein complexity. Nature Methods. 2013;10:186–187. doi: 10.1038/nmeth.2369. [DOI] [PMC free article] [PubMed] [Google Scholar]
- 7.Parks BA, Jiang L, Thomas PM, Wenger CD, et al. Top-down proteomics on a chromatographic time scale using linear ion trap Fourier transform hybrid mass spectrometers. Anal Chem. 2007;79:7984–7991. doi: 10.1021/ac070553t. [DOI] [PMC free article] [PubMed] [Google Scholar]
- 8.Wu Q, Yuan H, Zhang L, Zhang Y. Recent advances on multidimensional liquid chromatography-mass spectrometry for proteomics: from qualitative to quantitative analysis--a review. Anal Chim Acta. 2012;731:1–10. doi: 10.1016/j.aca.2012.04.010. [DOI] [PubMed] [Google Scholar]
- 9.Zhou H, Ning Z, Starr AE, Abu-Farha M, Figeys D. Advancements in top-down proteomics. Anal Chem. 2011;84:720–734. doi: 10.1021/ac202882y. [DOI] [PubMed] [Google Scholar]
- 10.Ahlf DR, Compton PD, Tran JC, Early BP, et al. Evaluation of the compact high-field orbitrap for top-down proteomics of human cells. J Proteome Res. 2012;11:4308–4314. doi: 10.1021/pr3004216. [DOI] [PMC free article] [PubMed] [Google Scholar]
- 11.Chi A, Bai DL, Geer LY, Shabanowitz J, Hunt DF. Analysis of intact proteins on a chromatographic time scale by electron transfer dissociation tandem mass spectrometry. Int J Mass Spectrom. 2007;259:197–203. doi: 10.1016/j.ijms.2006.09.030. [DOI] [PMC free article] [PubMed] [Google Scholar]
- 12.Loo JA, Udseth HR, Smith RD. Collisional Effects on the Charge Distribution of Ions from Large Molecules, Formed by Electrospray-ionization Mass Spectrometry. Rapid Commun Mass Spectrom. 1988;2:207–210. [Google Scholar]
- 13.Thevis M, Ogorzalek Loo RR, Loo JA. Mass Spectrometric Characterization of Transferrins and their Fragments Derived by Reduction of Disulfide Bonds. J Am Soc Mass Spectrom. 2003;14:635–647. doi: 10.1016/S1044-0305(03)00199-5. [DOI] [PubMed] [Google Scholar]
- 14.Tran JC, Zamdborg L, Ahlf DR, Lee JE, et al. Mapping intact protein isoforms in discovery mode using top-down proteomics. Nature. 2011;480:254–258. doi: 10.1038/nature10575. [DOI] [PMC free article] [PubMed] [Google Scholar]
- 15.Tipton JD, Tran JC, Catherman AD, Ahlf DR, et al. Nano-LC FTICR tandem mass spectrometry for top-down proteomics: routine baseline unit mass resolution of whole cell lysate proteins up to 72 kDa. Anal Chem. 2012;84:2111–2117. doi: 10.1021/ac202651v. [DOI] [PMC free article] [PubMed] [Google Scholar]
- 16.Tsybin YO, Fornelli L, Stoermer C, Luebeck M, et al. Structural Analysis of Intact Monoclonal Antibodies by Electron Transfer Dissociation Mass Spectrometry. Anal Chem. 2011;83:8919–8927. doi: 10.1021/ac201293m. [DOI] [PubMed] [Google Scholar]
- 17.Vellaichamy A, Tran JC, Catherman AD, Lee JE, et al. Size-sorting combined with improved nanocapillary liquid chromatography-mass spectrometry for identification of intact proteins up to 80 kDa. Anal Chem. 2010;82:1234–1244. doi: 10.1021/ac9021083. [DOI] [PMC free article] [PubMed] [Google Scholar]
- 18.Lee JE, Kellie JF, Tran JC, Tipton JD, et al. A robust two-dimensional separation for top-down tandem mass spectrometry of the low-mass proteome. J Am Soc Mass Spectrom. 2009;20:2183–2191. doi: 10.1016/j.jasms.2009.08.001. [DOI] [PMC free article] [PubMed] [Google Scholar]
- 19.Scherperel G, Reid GE. Emerging methods in proteomics: top-down protein characterization by multistage tandem mass spectrometry. Analyst. 2007;132:500–506. doi: 10.1039/b618499p. [DOI] [PubMed] [Google Scholar]
- 20.Chanthamontri C, Liu J, McLuckey SA. Charge State Dependent Fragmentation of Gaseous alpha-Synuclein Cations via Ion Trap and Beam-Type Collisional Activation. Int J Mass Spectrom. 2009;283:9–16. doi: 10.1016/j.ijms.2008.12.007. [DOI] [PMC free article] [PubMed] [Google Scholar]
- 21.Mekecha TT, Amunugama R, McLuckey SA. Ion trap collision-induced dissociation of human hemoglobin alpha-chain cations. J Am Soc Mass Spectrom. 2006;17:923–931. doi: 10.1016/j.jasms.2006.01.004. [DOI] [PubMed] [Google Scholar]
- 22.Karabacak NM, Li L, Tiwari A, Hayward LJ, et al. Sensitive and specific identification of wild type and variant proteins from 8 to 669 kDa using top-down mass spectrometry. Mol Cell Proteomics. 2009;8:846–856. doi: 10.1074/mcp.M800099-MCP200. [DOI] [PMC free article] [PubMed] [Google Scholar]
- 23.Witt M, Fuchser J, Koch BP. Fragmentation studies of fulvic acids using collision induced dissociation fourier transform ion cyclotron resonance mass spectrometry. Anal Chem. 2009;81:2688–2694. doi: 10.1021/ac802624s. [DOI] [PubMed] [Google Scholar]
- 24.Ye H, Greer T, Li L. Probing neuropeptide signaling at the organ and cellular domains via imaging mass spectrometry. J Proteomics. 2012;75:5014–5026. doi: 10.1016/j.jprot.2012.03.015. [DOI] [PMC free article] [PubMed] [Google Scholar]
- 25.Fucher J, Cornett S, Becker M. High Resolution Molecular Imaging of Pharmaceuticals at Therapeutic Levels. Bruker Daltonik GmbH. 2008 [Google Scholar]
- 26.Zhong W, Yang J, Yang X. Structural determination of an unknown degradation product in posaconazole drug product using CASI technology in a Fourier transform ion cyclotron resonance mass spectrometer. Rapid Commun Mass Spectrom. 2011;25:3650–3655. doi: 10.1002/rcm.5249. [DOI] [PubMed] [Google Scholar]
- 27.Senko MW, Hendrickson CL, Emmett MR, Shi SDH, Marshall AG. External Accumulation of Ions for Enhanced Electrospray Ionization Fourier Transform Ion Cyclotron Resonance Mass Spectrometry. J Am Soc Mass Spectrom. 1997;8:970–976. [Google Scholar]
- 28.Marshall AG, Rodgers RP. Petroleomics: the next grand challenge for chemical analysis. Acc Chem Res. 2004;37:53–59. doi: 10.1021/ar020177t. [DOI] [PubMed] [Google Scholar]
- 29.Wong E, Cuervo AM. Integration of clearance mechanisms: the proteasome and autophagy. Cold Spring Harbor Perspect Biol. 2010;2:a006734. doi: 10.1101/cshperspect.a006734. [DOI] [PMC free article] [PubMed] [Google Scholar]
- 30.Bedford L, Paine S, Sheppard PW, Mayer RJ, Roelofs J. Assembly, structure, and function of the 26S proteasome. Trends Cell Biol. 2010;20:391–401. doi: 10.1016/j.tcb.2010.03.007. [DOI] [PMC free article] [PubMed] [Google Scholar]
- 31.Lander GC, Estrin E, Matyskiela ME, Bashore C, et al. Complete subunit architecture of the proteasome regulatory particle. Nature. 2012;482:186–191. doi: 10.1038/nature10774. [DOI] [PMC free article] [PubMed] [Google Scholar]
- 32.Loo JA, Berhane B, Kaddis CS, Wooding KM, et al. Electrospray ionization mass spectrometry and ion mobility analysis of the 20S proteasome complex. J Am Soc Mass Spectrom. 2005;16:998–1008. doi: 10.1016/j.jasms.2005.02.017. [DOI] [PubMed] [Google Scholar]
- 33.Uttenweiler-Joseph S, Claverol S, Sylvius L, Bousquet-Dubouch MP, et al. Toward a full characterization of the human 20S proteasome subunits and their isoforms by a combination of proteomic approaches. Methods Mol Biol. 2008;484:111–130. doi: 10.1007/978-1-59745-398-1_8. [DOI] [PubMed] [Google Scholar]
- 34.Huang L, Burlingame AL. Comprehensive mass spectrometric analysis of the 20S proteasome complex. Methods Enzymol. 2005;405:187–236. doi: 10.1016/S0076-6879(05)05009-3. [DOI] [PubMed] [Google Scholar]
- 35.Overath T, Kuckelkorn U, Henklein P, Strehl B, et al. Mapping of O-GlcNAc Sites of 20 S Proteasome Subunits and Hsp90 by a Novel Biotin-Cystamine Tag. Mol Cell Proteomics. 2012;11:467–477. doi: 10.1074/mcp.M111.015966. [DOI] [PMC free article] [PubMed] [Google Scholar]
- 36.Wang X, Chen CF, Baker PR, Chen PL, et al. Mass spectrometric characterization of the affinity-purified human 26S proteasome complex. Biochemistry. 2007;46:3553–3565. doi: 10.1021/bi061994u. [DOI] [PubMed] [Google Scholar]
- 37.Bousquet-Dubouch MP, Fabre B, Monsarrat B, Burlet-Schiltz O. Proteomics to study the diversity and dynamics of proteasome complexes: from fundamentals to the clinic. Expert Rev Proteomics. 2011;8:459–481. doi: 10.1586/epr.11.41. [DOI] [PubMed] [Google Scholar]
- 38.van de Meent MH, Eeltink S, de Jong GJ. Potential of poly(styrene-co-divinylbenzene) monolithic columns for the LC-MS analysis of protein digests. Anal Bioanal Chem. 2011;399:1845–1852. doi: 10.1007/s00216-010-4578-7. [DOI] [PMC free article] [PubMed] [Google Scholar]
- 39.Eeltink S, Wouters B, Desmet G, Ursem M, et al. High-resolution separations of protein isoforms with liquid chromatography time-of-flight mass spectrometry using polymer monolithic capillary columns. J Chromatogr A. 2011;1218:5504–5511. doi: 10.1016/j.chroma.2011.06.049. [DOI] [PubMed] [Google Scholar]
- 40.Mohr J, Swart R, Samonig M, Bohm G, Huber CG. High-efficiency nano- and micro-HPLC--high-resolution Orbitrap-MS platform for top-down proteomics. Proteomics. 2010;10:3598–3609. doi: 10.1002/pmic.201000341. [DOI] [PubMed] [Google Scholar]
- 41.Kellie JF, Catherman AD, Durbin KR, Tran JC, et al. Robust analysis of the yeast proteome under 50 kDa by molecular-mass-based fractionation and top-down mass spectrometry. Anal Chem. 2012;84:209–215. doi: 10.1021/ac202384v. [DOI] [PMC free article] [PubMed] [Google Scholar]
- 42.Legido-Quigley C, Marlin N, Smith NW. Comparison of styrene-divinylbenzene-based monoliths and Vydac nano-liquid chromatography columns for protein analysis. J Chromatogr A. 2004;1030:195–200. doi: 10.1016/j.chroma.2004.01.003. [DOI] [PubMed] [Google Scholar]
- 43.Cobb JS, Easterling ML, Agar JN. Structural characterization of intact proteins is enhanced by prevalent fragmentation pathways rarely observed for peptides. J Am Soc Mass Spectrom. 2010;21:949–959. doi: 10.1016/j.jasms.2010.02.009. [DOI] [PMC free article] [PubMed] [Google Scholar]
- 44.Rozman M, Gaskell SJ. Charge state dependent top-down characterisation using electron transfer dissociation. Rapid Commun Mass Spectrom. 2011;26:282–286. doi: 10.1002/rcm.5330. [DOI] [PubMed] [Google Scholar]
- 45.Molina H, Horn DM, Tang N, Mathivanan S, Pandey A. Global proteomic profiling of phosphopeptides using electron transfer dissociation tandem mass spectrometry. Proc Natl Acad Sci USA. 2007;104:2199–2204. doi: 10.1073/pnas.0611217104. [DOI] [PMC free article] [PubMed] [Google Scholar]
- 46.Rush J, Moritz A, Lee KA, Guo A, et al. Immunoaffinity profiling of tyrosine phosphorylation in cancer cells. Nature Biotechnol. 2005;23:94–101. doi: 10.1038/nbt1046. [DOI] [PubMed] [Google Scholar]
- 47.Drews O, Zong C, Ping P. Exploring proteasome complexes by proteomic approaches. Proteomics. 2007;7:1047–1058. doi: 10.1002/pmic.200600574. [DOI] [PubMed] [Google Scholar]
- 48.Claverol S, Burlet-Schiltz O, Girbal-Neuhauser E, Gairin JE, Monsarrat B. Mapping and structural dissection of human 20 S proteasome using proteomic approaches. Mol Cell Proteomics. 2002;1:567–578. doi: 10.1074/mcp.m200030-mcp200. [DOI] [PubMed] [Google Scholar]
- 49.Lu H, Zong C, Wang Y, Young GW, et al. Revealing the dynamics of the 20 S proteasome phosphoproteome: a combined CID and electron transfer dissociation approach. Mol Cell Proteomics. 2008;7:2073–2089. doi: 10.1074/mcp.M800064-MCP200. [DOI] [PMC free article] [PubMed] [Google Scholar]
- 50.Bose S, Stratford FL, Broadfoot KI, Mason GG, Rivett AJ. Phosphorylation of 20S proteasome alpha subunit C8 (alpha7) stabilizes the 26S proteasome and plays a role in the regulation of proteasome complexes by gamma-interferon. Biochem J. 2004;378:177–184. doi: 10.1042/BJ20031122. [DOI] [PMC free article] [PubMed] [Google Scholar]
- 51.Rosenzweig R, Bronner V, Zhang D, Fushman D, Glickman MH. Rpn1 and Rpn2 coordinate ubiquitin processing factors at proteasome. J Biol Chem. 2012;287:14659–14671. doi: 10.1074/jbc.M111.316323. [DOI] [PMC free article] [PubMed] [Google Scholar]
- 52.Michalski A, Damoc E, Lange O, Denisov E, et al. Ultra high resolution linear ion trap Orbitrap mass spectrometer (Orbitrap Elite) facilitates top down LC MS/MS and versatile peptide fragmentation modes. Mol Cell Proteomics. 2011;11:O111 013698. doi: 10.1074/mcp.O111.013698. [DOI] [PMC free article] [PubMed] [Google Scholar]
Associated Data
This section collects any data citations, data availability statements, or supplementary materials included in this article.