

ABSTRACT
To elucidate mechanisms underlying the complex relationships between a host and its microbiota, we used the genetically tractable model Drosophila melanogaster. Consistent with previous studies, the microbiota was simple in composition and diversity. However, analysis of single flies revealed high interfly variability that correlated with differences in feeding. To understand the effects of this simple and variable consortium, we compared the transcriptome of guts from conventionally reared flies to that for their axenically reared counterparts. Our analysis of two wild-type fly lines identified 121 up- and 31 downregulated genes. The majority of these genes were associated with immune responses, tissue homeostasis, gut physiology, and metabolism. By comparing the transcriptomes of young and old flies, we identified temporally responsive genes and showed that the overall impact of microbiota was greater in older flies. In addition, comparison of wild-type gene expression with that of an immune-deficient line revealed that 53% of upregulated genes exerted their effects through the immune deficiency (Imd) pathway. The genes included not only classic immune response genes but also those involved in signaling, gene expression, and metabolism, unveiling new and unexpected connections between immunity and other systems. Given these findings, we further characterized the effects of gut-associated microbes on gut morphology and epithelial architecture. The results showed that the microbiota affected gut morphology through their impacts on epithelial renewal rate, cellular spacing, and the composition of different cell types in the epithelium. Thus, while bacteria in the gut are highly variable, the influence of the microbiota at large has far-reaching effects on host physiology.
IMPORTANCE
The guts of animals are in constant association with microbes, and these interactions are understood to have important roles in animal development and physiology. Yet we know little about the mechanisms underlying the establishment and function of these associations. Here, we used the fruit fly to understand how the microbiota affects host function. Importantly, we found that the microbiota has far-reaching effects on host physiology, ranging from immunity to gut structure. Our results validate the notion that important insights on complex host-microbe relationships can be obtained from the use of a well-established and genetically tractable invertebrate model.
INTRODUCTION
In contrast to the acute tissue invasion commonly associated with pathogenic bacteria, microbiota are in chronic association with the gut, and these persistently associated microbes may impact and interact with the host using very different mechanisms. Surveys of 16S rRNA genes amplified from both laboratory-reared and wild-caught flies continue to identify the diversity of bacteria that may associate with Drosophila melanogaster (1–7). Collectively, these studies indicate that populations of flies associate with a relatively narrow diversity of bacteria (see references and commentary in reference 8). The ability to establish axenic lines and rear flies in the laboratory in the absence of bacteria indicates that when provided a nutritionally adequate diet, these bacteria are not essential to host survival or fecundity (9). However, comparisons between axenic and conventionally reared flies have shown multiple contributions of bacteria to host nutrition and physiology, including impacts on the larval development rate (9–12), adult lipid storage (10, 13), gut stem cell activity (1–7, 12, 14), and mating preference (15).
In this study, we performed a detailed analysis of the microbiota of individual flies that revealed an unexpected variability in the composition and dynamics of gut-associated bacteria. To obtain a broader understanding of the effects of the various gut-associated microbes on D. melanogaster adults, we examined their impact on host gene expression using Affymetrix microarrays with two different wild-type strains. This unbiased approach allowed us to categorize genes in both gut and nongut tissues whose expression was altered by the presence of microbiota. Furthermore, comparison of wild-type gene expression with that of an immune-deficient fly strain allowed us to determine microbiota-responsive genes that exerted their effects through the immune deficiency (Imd) pathway. Overall, our analysis indicated that the microbiota had significant impacts on many host signaling pathways, affecting immune, developmental, and homeostatic responses. Given the effects on these pathways, we further characterized the impacts of gut-associated microbes on gut morphology and epithelial architecture. This analysis demonstrated that microbiota affected adult gut morphology through their impact on epithelial renewal rate, tissue architecture, and cell composition. In addition, the effect of microbiota on the host transcriptome increased with age, suggesting that microbiota exert a different impact on gut physiology at different stages of life, and those genes that are dysregulated with age might contribute to immune senescence.
RESULTS
Diversity, density, and variability of D. melanogaster microbiota.
As an initial step to characterize the impact of microbiota on D. melanogaster, we assessed the diversity of bacteria associated with two wild-type conventionally reared fly strains. Analyses of 16S rRNA clone libraries generated from DNA extracted from dissected midguts of 4- to 7-day-old OregonR and CantonS adults identified two dominant bacterial phylotypes with similarities to Lactobacillus plantarum and Acetobacter pasteurianus. Less frequently identified clones with similarity to a Gluconobacter sp. and Enterococcus faecalis were unique to each library (Fig. 1A). All the bacteria identified were cultivable on mannitol agar or MRS agar. We estimated the mean number of bacteria to be around 1,000 cells per gut (Fig. 1B), with older flies having around 10- to 100-fold more (Fig. 1C) (14). These numbers and low species diversity are similar to those found in previous studies using lab or wild stocks (1, 4–7, 9–12, 16, 17).
FIG 1 .
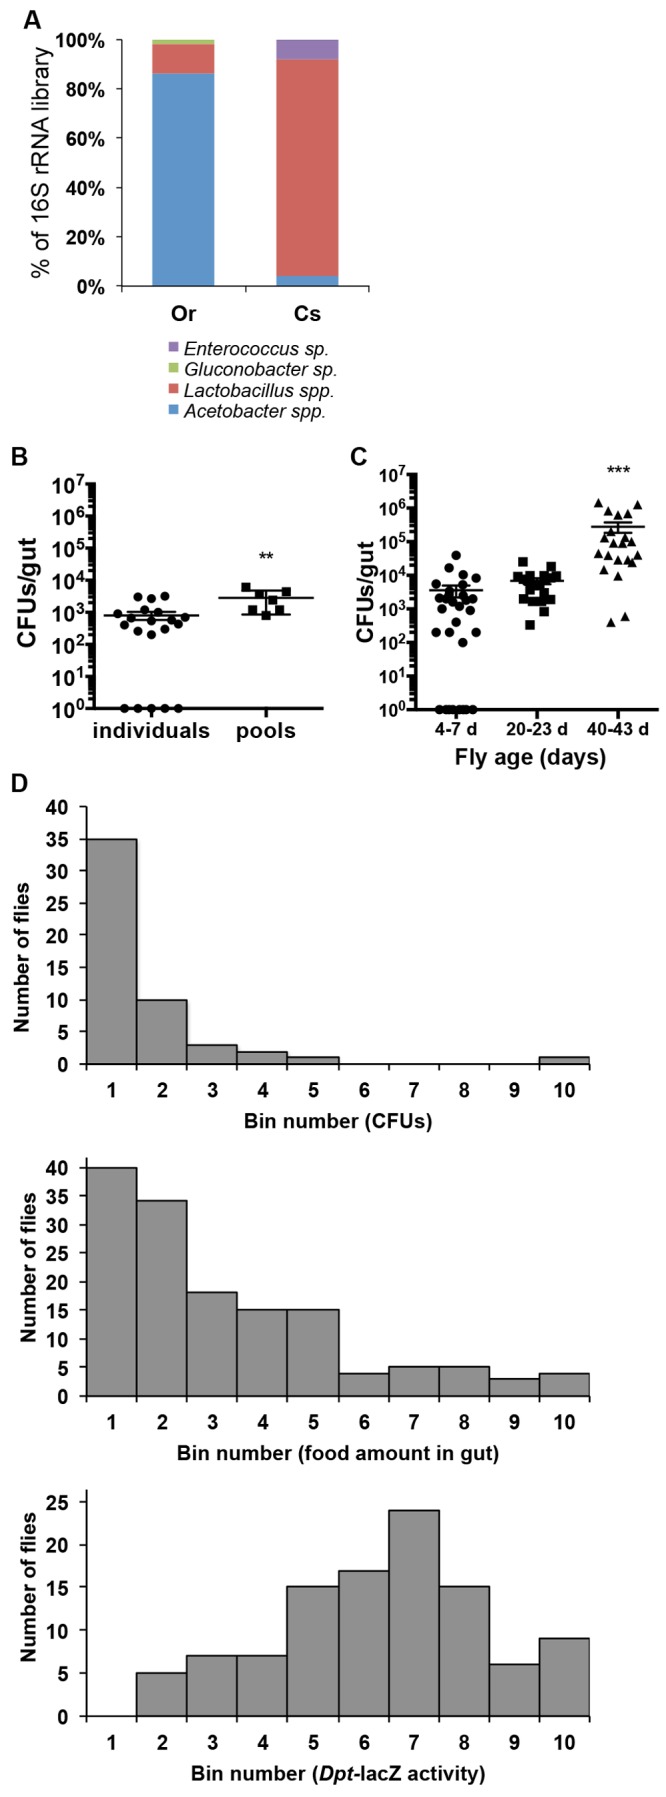
Composition and characteristics of D. melanogaster gut-associated bacteria. (A) Relative frequency of bacterial 16S rRNA clones from libraries constructed from two laboratory-derived wild-type populations (OregonR and CantonS). (B) Variability in CFU isolated from dissected guts of individual or pooled (n = 5 guts; n = 7 replicates) 4- to 7-day-old flies. (C) Counts of culturable bacteria (CFU) isolated from the guts of young (4 to 7 days [d] old), mid-age (20 to 25 days old), and old (40 to 43 days old) flies. Total culturable bacteria from individual guts are shown. The means ± SEM for three biological replicates (n = 10 flies each) are shown. Mean counts for the guts of old flies are significantly higher (P = 0.0002) than counts in guts of young and mid-aged flies. Data shown are from analysis of OregonR flies; similar results were obtained with CantonS. (D) Frequency distributions of bacterial cells (CFUs) (top; n = 52), food intake (middle; n = 143), and expression of the antimicrobial peptide gene diptericin reporter (Dpt-lacZ, bottom; n = 105) in the guts of individual flies. Bin numbers for each panel represent percentage deciles calculated based on the maximum measured parameter. For example, bin 1 represent 0 to 10%, Bin 2 represents 11 to 20%, and so on. The top-panel bin percentages were calculated from a maximal CFU of 48,000 per gut. Middle and bottom panel bin percentages were calculated from maximal OD values (see Materials and Methods for more details).
To further characterize the association of gut microbes with D. melanogaster, we explored individual variation in bacterial counts and species composition of the microbiota and how these parameters were affected by time and different rearing conditions. Because all members of the microbiota readily grew on standard microbiological media and were identifiable by colony morphology, we used culture-dependent techniques to assess these parameters. We first noticed that shifting flies onto a sterile diet, which was achieved by autoclaving the fly medium after the normal cooking protocol (see Materials and Methods), reduced the diversity of bacteria recovered from dissected fly guts, since the diversity of bacteria was restricted to L. plantarum, A. pasteurianus, and occasionally Lactobacillus brevis (data not shown). In previous studies, cohorts of flies were dissected and their guts were pooled for bacterial enumeration by plating on solid medium to estimate the number of bacterial cells per gut. We opted instead to examine bacterial counts in individual guts from young flies (4 to 7 days old) (Fig. 1B) or old flies (40 to 43 days old [Fig. 1C] or 30 to 35 days old [see Fig. S1A in the supplemental material]) cohoused in vials. Unexpectedly, this analysis of individual flies revealed high interfly variability, with as much as a 5-fold difference in counts, ranging from undetectable levels (below 100 cells per gut) up to 107 cells per gut in old flies even when they were reared in the same vial under identical conditions (Fig. 1C; see also Fig. S1A). This finding prompted us to explore this variability in greater detail by subsampling cohorts of flies over time. As we and others have previously reported (6, 10, 13, 14, 16), bacterial counts increase over time and are higher in older flies (Fig. 1C). However, even among older flies, the variability of counts and composition between individual flies persisted (see Fig. S1A and S1B). This variability was observed both in conventionally reared flies and in conventionalized lines (axenic flies reassociated with members of the microbiota). Further examination of conditions that impacted counts of bacteria in the gut (see Fig. S1C) showed that husbandry practices, such as the simple act of flipping flies to new medium, can reduce the load of individuals in a cohort to below detectable levels (see Fig. S1D1, decrease in counts between day 0 and day 4). In addition, the amount of time cohorts of flies spent in the vial after pupation did not reduce this variability (see Fig. S1D2), suggesting that factors other than the initial time of exposure to bacteria, which could seed the microbiota, influence this parameter. Furthermore, starvation of flies, which was done by transitioning flies from standard medium to water agar, rapidly reduced bacterial counts, even though flies were provided a carbohydrate source (10% sucrose; see Fig. S1E). Importantly, comparisons of counts between wild-type flies and mutants of the Imd pathway (RelishE20 and imd1) indicate that while there was a tendency of higher numbers of bacteria in immune-deficient flies, individual flies exhibited the same variability in microbiota density as wild-type flies (see Fig. S1A). This observed variability appeared to be mostly an adult trait, since the density of microbes cultured from larval guts was more consistent across individuals, even when comparing genotypes and mutant lines (see Fig. S1F). Of note, in many of our experiments, A. pasteurianus appeared to be more sensitive to these effects, since numbers dropped more rapidly following starvation and did not rebound as flies were shifted back onto normal diet (see Fig. S1E). This was further exemplified in the greater occurrence of experimental cohorts no longer being associated with A. pasteurianus even when derived from parents (both conventionally reared and reassociated gnotobiotic lines) that had significant numbers of this strain across their life span (see Fig. S1B and S1D2).
To further examine factors that might contribute to the observed variability in the density of gut-associated bacteria, we considered that differences in the last times flies had eaten could be a factor. Consequently, we compared the density of culturable bacteria to the quantity of food in individual guts by switching flies onto medium into which dye has been incorporated. This analysis demonstrated that the frequency distribution of bacterial counts of individual flies mirrored the distribution of the quantity of food in fly guts (Fig. 1D). We observed that the majority of flies within a population had low bacterial counts (between 0 and 5,000 cells per gut), which was correlated with a low concentration of food in the gut (Fig. 1D, top and middle panels). In addition, cross sections of guts and false sectioning with confocal microscopy indicated that bacteria in the gut were maintained within the lumen and associated with the food bolus within the endoperitrophic space (delimited by the peritrophic matrix; see Fig. S1G in the supplemental material)). The presence of many dead bacteria in examined cross sections (see Fig. S1G) suggests that a high percentage of ingested bacteria are not living in the gut environment.
Altogether, these data confirm that D. melanogaster associates with a few species of bacteria in the laboratory and that rearing conditions have significant impacts on the composition and density of these bacteria. Given the high interfly variability we observed, an important question was whether these microbes have common and consistent impacts on the host. We initially examined this by looking at the frequency distribution of the activity of the Imd pathway in individual guts, since we and others have shown that gut-associated microbes induce a basal level of expression of the Imd pathway in the gut of adult flies and since this pathway is the main immune signaling pathway in the midgut (4, 14, 18). In contrast to the skewed distribution of bacterial density and quantity of food (either flies with little to none or flies with high concentrations), the activity of the Imd pathway, as measured by the expression level of the antimicrobial peptide diptericin, was approximately 70% of the highest expression in the guts of most flies, and we observed no flies with no induction of the Imd pathway (Fig. 1D, bottom panel). These results suggest that despite a discontinuous exposure to food and variability in microbiota composition and density across the population, the immune response is rather consistent. This also means that the intermittent nature of association between the fly and its microbiota can lead to significant changes in host gene expression.
D. melanogaster microbiota have a significant impact on host gene expression.
We next sought to determine the genes specifically altered in the gut by the presence of the microbiota. We investigated transcriptome variations in dissected guts (crop to hindgut, minus the Malpighian tubules) of both conventionally and axenically reared adults. Transcriptome data were generated using Affymetrix GeneChip Drosophila Genome 2.0 Array for 4- to 6-day-old flies from two wild-type backgrounds, CantonS and OregonR. Since the generation of axenic fly lines eliminates both gut- and substrate-associated microbes (and their associated compounds), our analysis monitored the overall influence of the microbial environment of D. melanogaster. Our analysis identified 152 genes whose expression varied significantly (P < 0.05) in response to microbiota by at least a 1.3-fold change relative to expression in the guts of axenic flies. We chose a lower threshold than the typical 2.0-fold level because we expected the impact of microbiota on the basal level of expression (i.e., noninfected) to be lower and because known regulators of host-microbiota interactions were regulated inside that range. However, the difference in expression of these genes was significant, with a statistical confidence P value of <0.05 for each of the three microarray repeats, and a subset was confirmed independently by reverse transcription-quantitative PCR (RT-qPCR) (see Fig. S2A in the supplemental material) and in individual guts through the use of two transgene reporters (Diptericin-lacZ and Upd3-GFP; see Fig. S2B and S2C). The 152 genes encode 121 upregulated and 31 downregulated transcripts (summary in Fig. 2; see also Table S1 for the complete data set). Comparison of our data with a microarray data set of the gut response following ingestion of a Gram-negative bacterial pathogen, Erwinia carotovora (GIRGS) (19), and whole flies following septic injury with Micrococcus luteus and Escherichia coli (DIRGS) (20) identified 15 genes that were regulated under all conditions (13 upregulated and 2 downregulated, indicated in Table S1), including most genes with immune function, while 84 upregulated and 16 downregulated genes were altered in the gut by both microbiota and infectious bacteria (GIRGS; see Table S1). An additional 17 upregulated and 4 downregulated genes were altered in the gut by microbiota and in whole flies following septic injury (20). Using a global classification of gene ontology (GO), nearly three-quarters (74%) of gut microbiota-responsive genes were assigned to 6 functional categories: gene expression, gut structure, immune response, metabolism, signaling, and stress response (Fig. 2B). Genes involved in metabolism, gut structure, and the immune response were enriched among upregulated genes, while genes encoding factors involved in metabolism, especially transporters, were downregulated by the presence of microbiota. Based on this microarray analysis, we conclude that the presence of bacteria in the Drosophila environment triggers a higher level of signaling associated with immune response (notably, the Imd pathway, antimicrobial peptides, lysozymes, and PGRP-SC1), stem cell proliferation (Upd3, Socs36e, and Pvf1) and differentiation (multiple Notch pathway components), and higher-oxidative-stress genes, lipid metabolism, and endopeptidase activity (a representative list is shown in Fig. 2C). Our analysis also identified a number of previously unknown genes that are altered by the presence of microbiota; 29% of all upregulated and 16% of all downregulated genes are of as-yet-unknown function. Of note, among these unknown upregulated genes, 20 of these genes are enriched in the gut compared to levels in other fly tissues, with six being particularly enriched in the posterior midgut. Perhaps most strikingly, 15 of the 35 upregulated unknown genes (43%), including the two genes most upregulated by microbiota in our microarrays (CG42807 and CG32368; Fig. 2C), are annotated to encode small peptides that are potentially novel immune effectors of the gut response (see Table S1). Among the unknown downregulated genes, an enrichment for lipid metabolism was found, due mainly to two genes, CG16904 and CG30008, that code for proteins with similarities to enzymes involved in the synthesis of long-chain fatty acids.
FIG 2 .

Impact of microbiota on host gene expression in the gut. (A) Venn diagram depicting the core set of genes whose expression was altered in the gut of wild-type flies by microbiota. Two laboratory-derived wild-type populations were compared (OregonR and CantonS). The number of altered genes specific to each strain is indicated, and highlighted pathways and genes of the core response are listed. (B) Proportion of upregulated (top) and downregulated (bottom) genes in each of six gene ontology categories or unknowns. The total gene number in each category is indicated in its respective section. (C) Highlight of core genes altered in the gut of young flies by microbiota. Across the different gene ontology categories, our microarray showed that microbiota were important basal inducers of immune and homeostatic pathways in the gut. Fold changes in expression for each wild-type condition tested (OregonR young, CantonS young, and CantonS old) are shown. In addition, genes whose expression was impacted in young immune-deficient (RelishE20) flies (“*” denotes Imd-regulated genes; “$” indicates Imd-altered genes) or displayed abnormal regulation with aging (#) are indicated. CR, conventionally reared; AX, axenically reared. (D) Distribution of the core set of upregulated (blue) and downregulated (red) genes in different regions of the gut. Classification for the gut regions was made based on their enrichment per the classification given elsewhere (21). The number of genes enriched in the crop, regions 1 to 5 of the midgut (R1 to R5), or the hindgut (HG) are shown (the scheme of gut regions is depicted below). (E) The proportion of microbiota-induced genes in each gene ontology category per region (see panel D) is shown. (F) Distribution of the core set of microbiota-induced genes based on their fold change in OregonR (black) and CantonS (gray) flies.
To gain more insight into the core set of microbiota-responsive genes, we compared our data set to a transcriptome analysis of gut regions (21) performed at the same time using the conventionally reared OregonR lines established for this study. This comparison allowed us to map the expression of microbiota-regulated genes based on their enrichment in different regions of the gut (Fig. 2D). Microbiota-regulated genes were represented in each region. While genes downregulated by microbiota were evenly distributed across the different gut regions, the highest number of microbiota-upregulated genes mapped to regions 1 and 5, the most anterior and posterior portions of the midgut, respectively. Comparison of the GO categories enriched in these two regions suggested that different functions were upregulated in these distinct compartments in response to microbiota. For example, 60% of immune and 50% of stress-responsive genes were enriched in R1 (anterior midgut), whereas most genes categorized as metabolic, signaling, or gene expression were enriched in R5 (posterior midgut) (Fig. 2E).
While our comparison identified a core set of microbiota-regulated genes conserved between the two wild-type strains, there were also noticeable differences. For example, among the core set of microbiota-regulated genes, the fold induction level was overall higher in young OregonR flies than in young CantonS flies; in OregonR flies, 67% of core genes were upregulated 2- to 10-fold, whereas only 29% of CantonS genes were upregulated to this level (Fig. 2E). Furthermore, outside of the core set, there were additional genes altered by microbiota that were specific to each strain (Fig. 2A; see also Tables S2 to S4 in the supplemental material), and in total, a larger number of genes were regulated by microbiota in young OregonR flies (285 upregulated and 195 downregulated) than in their young CantonS counterparts (169 upregulated and 57 downregulated).
The impact of D. melanogaster microbiota on host gene expression increased with age and was mostly local.
Old flies have altered gut morphology (14, 22–26) and contain higher numbers of bacteria in their gut (Fig. 1C) (14, 16). This prompted us to analyze how aging altered the gut response to microbiota by analyzing transcriptome variations in both young and old CantonS flies. A higher number of genes were affected by the presence of microbiota in old (220 upregulated and 177 downregulated) versus young (169 upregulated and 57 downregulated) flies, with the age effect being especially marked for downregulated genes (Fig. 3; see also Tables S3 and S4 in the supplemental material). However, when comparing all wild-type flies, we observed that a number of “old” microbiota-regulated genes were also regulated in young OregonR flies but generally at lower levels (68 upregulated and 79 downregulated; see Table S5). Across the three wild-type conditions (OregonR young, CantonS young, and CantonS old), 365 upregulated and 265 downregulated genes were altered by microbiota, and of the core set from young flies, 105 of the 121 upregulated genes and 22 of the 35 downregulated genes were similarly affected in CantonS old flies. However, a significant number of genes were specifically altered in older flies (see Tables S3 and S4). Furthermore, while the expression of many immune and stress-responsive genes increased with aging, in agreement with earlier reports (14, 16, 24, 26), there were subsets of genes that did not follow this trend. Of note, PGRP-SC1, AttD (but not AttA, AttB, or AttC), dro3, Hsp67, GSTD5, and multiple Turandot genes that were upregulated in young flies were no longer affected in old flies (Fig. 2C [indicated by column “aging”]; see also Tables S3 and S4). This suggests that the effect of microbiota on host gene expression increases with age, possibly as a consequence of the increased bacterial load found in old flies. Interestingly, the specific expression of a subset of gut microbiota-induced genes is lost upon aging, suggesting changes in the response of the host tissue to microbiota.
FIG 3 .
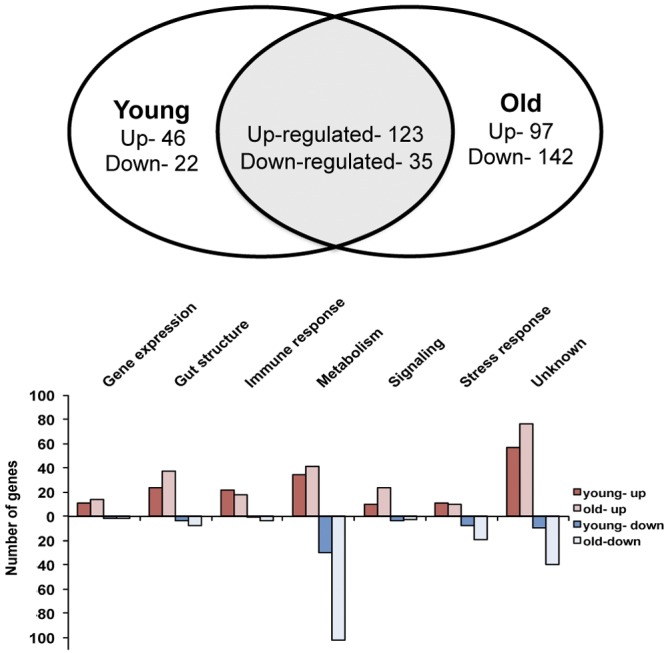
Impact of microbiota on host gene expression increases as flies age and is mainly local. Venn diagram and GO category proportions depicting the impact of microbiota on host gene expression as flies age. Genes that were up- or downregulated in the guts of young (4 to 7 days old) and old (35 to 40 days old) CantonS flies were compared to identify genes specific to young or old flies, as well as genes whose expression was affected by microbiota at both ages.
Finally, we monitored the systemic effect of microbiota on gene expression by comparing nongut tissue (all remaining tissues after removal of the gut) from conventional 4- to 6-day-old CantonS flies to that of their axenic counterparts. In contrast to the gut response, the effect of microbiota on gene expression in host carcass tissue was minimal (see Table S6). A total of 53 genes were upregulated and 14 genes downregulated, of which 21 upregulated and 6 downregulated genes were specifically altered in carcass tissue alone. This included PGRP-SC2, which has amidase activity like that of PGRP-SC1 and is suggested to be responsive to microbiota (27). This analysis indicates that microbiota likely exert most of their impact locally, directly on the gut, but are also able to impact the expression of genes in nongut tissues.
The Imd pathway is a master regulator of the gut response to microbiota.
In Drosophila, two major signaling pathways, immune deficiency (Imd) and Toll, regulate the antimicrobial response to microbes (21). These pathways are activated by pattern recognition receptors through the sensing of specific microbial cell wall components. In the case of bacteria, the lysine-type peptidoglycan of Gram-positive cocci activates the Toll pathway, whereas meso-diaminopimelic acid (DAP)-type peptidoglycan, common to Gram-negative and Gram-positive bacilli, activates the Imd pathway. While both pathways are important for the systemic (body cavity) response to microbes, to date only the Imd pathway has been shown to have a role in the gut (19). Along these lines, the most consistent members of the microbiota (Lactobacillus and Acetobacter spp.) both contain DAP-type peptidoglycan. Prior work has established that the microbiota induces the basal level of expression of the Imd pathway in guts of flies (4, 14, 18). In this regard, a previous microarray study showed that a significant number of the genes altered in the gut following the ingestion of a nonlethal pathogen were regulated by the Imd pathway (19). To determine the contribution of the Imd pathway to upregulated microbiota-responsive genes, we examined the effect of a mutation in Relish, the Imd pathway NF-kappaB transcription factor, on gene expression in the guts of young flies reared with microbiota compared to that for axenic flies (see Table S2 in the supplemental material)). We then identified microbiota-upregulated genes whose expression was altered in comparison to that in guts of young OregonR flies. The expression of 151 of 285 total upregulated genes was altered in the guts of RelishE20 flies (Table 1; see also Table S2, representative genes [indicated in column “imd”] shown Fig. 2C). These included genes from all gene ontology categories. Not surprisingly, the expression of the majority of immune response genes (67%) was altered in Relish flies. However, the extent of the impact of Relish on the expression of genes related to the gene ontology categories “gene expression” (83%) and “signaling pathways” (73%) was not anticipated. Altogether, these data indicate that a single transcription factor, Relish, impacted the expression of more than 50% of the microbiota-induced genes in the gut. The impacts of Relish on interactions between the host and microbiota have noticeable effects on gut-associated microbes, since we observed both a shift in the composition of 16S rRNA genes (Fig. 4A) and higher counts of bacteria in the guts of flies (Fig. 4B), in agreement with findings in our previous study (14). This was supported by an overall increase in 16S rRNA genes in all regions of the gut, as indicated by RT-qPCR (Fig. 4C). Furthermore, we observed that Imd-deficient flies exhibited a loss in the increasing gradient of bacteria from the anterior to posterior midgut, which was observed in wild-type flies by both RT-qPCR of 16S rRNA genes and live staining of bacteria along the gut (Fig. 4C and D). This gradient was inversely correlated with the normal expression of the Imd pathway, as measured by RT-qPCR (Fig. 4C). These data suggest that gut-associated bacteria are important for inducing the basal expression of many genes through the Imd pathway and that this induction of the Imd pathway in turn affects gut-associated microbes by impacting their composition, density, and localization within the gut. These bidirectional interactions between the immune response and microbiota and their effect on host gene expression suggest a critical role of the Imd pathway in defining the interaction between the host and the microbiome.
TABLE 1 .
Percentage of genes in the gut of OregonR flies that are induced by microbiota and affected by Relish
| GO category | Rel dependent (%)a | Rel altered (%)b | Total (%) |
|---|---|---|---|
| Gene expression | 22 | 61 | 83 |
| Gut structure | 13 | 28 | 41 |
| Immune response | 33 | 33 | 67 |
| Metabolism | 30 | 24 | 54 |
| Signaling | 38 | 35 | 73 |
| Stress response | 14 | 9 | 23 |
| Unknown | 22 | 30 | 51 |
| Total | 24 | 29 | 53 |
Induced by microbiota in OregonR (OrR) flies; not induced (≤1.0-fold) in Relish (Rel) mutant flies.
Genes expressed in OrR flies at an at least 1.5× higher level than in Rel flies (>1.0-fold).
FIG 4 .
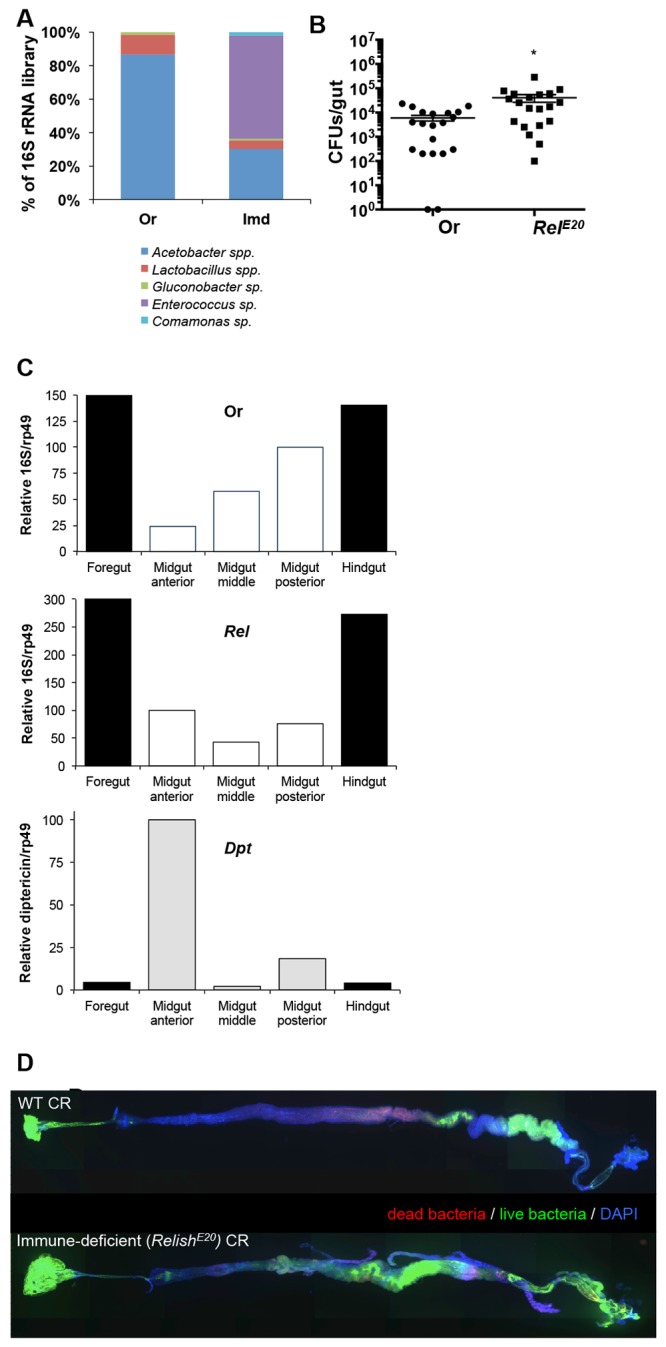
Impact of the Imd pathway on gut microbiota composition, density, and localization. (A) Relative frequency of bacterial 16S rRNA clones from libraries constructed from Imd-deficient flies (RelishE20) compared to laboratory-derived wild-type flies (OregonR). (B) Density of culturable bacteria in the guts of individual wild-type (OregonR) and Imd-deficient (RelishE20) flies. (C) Density of bacteria in the guts of OregonR (top) and RelishE20 flies (middle), compared to immune pathway activity in different regions of the gut of wild-type (OregonR) flies as measured by RT-qPCR. The ratio of total 16S rRNA is shown relative to a host housekeeping gene (Rpl32) in each gut region. The antimicrobial peptide diptericin gene (Dpt) was used as a readout of immune pathway activity (bottom) in the same regions of the guts of wild-type flies (OregonR). (D) Representative images of the localization of bacteria in the guts from wild-type (OregonR) and immune-deficient (RelE20) flies. Dyes from the Live/Dead BacLight bacterial viability kit (Syto 9 [green] and propidium iodide [red]) were fed to adult female flies to visualize the location of bacteria in the gut. Guts were dissected after 2 h of feeding, fixed, and stained with DAPI to mark the gut prior to imaging. Composite gut images were stitched together from overlapping single 10× three-channel (DAPI, GFP, and red fluorescent protein [RFP]) image tiles of the gut using the Axioplot imager and MosaiX program (Zeiss). The stitched composite image was then processed to correct for shading differences across the individual tiles.
Microbiota altered gut morphology through changes in intestinal homeostasis and cell lineage.
In addition to the gut immune response, our microarray analysis identified many genes involved with cell proliferation and differentiation as being upregulated by microbiota (Fig. 2C; see also Table S1 in the supplemental material). Consistent with these data, we had previously demonstrated that microbiota stimulated a basal level of epithelium renewal, an effect that correlated with higher levels of JAK/STAT and epidermal growth factor receptor (EGFR) pathway activation (14). These observations prompted us to further explore the impact of microbiota on stem cell proliferation and gut morphology. In agreement with our previous results, the mitotic activity in the intestines of flies reared with microbiota was higher than that in axenically reared flies (Fig. 5A), indicating microbiota stimulates basal stem cell proliferation. Interestingly, this effect was more pronounced in the posterior midgut of conventionally reared flies, as indicated by both a higher mitotic index (PH3-positive cells) (Fig. 5A) and greater expansion of a GFP signal expressed by progenitor cells (esg-Gal4>UAS-GFP flies) and recently differentiated enterocytes in this region (Fig. 5D). This increased level of stem cell proliferation did not result in changes in the total number of enterocytes in the gut, since we observed no difference between axenic and conventionally reared flies (Fig. 5B). However, comparing a variety of markers of cell identity between guts from axenic and conventionally reared flies, we did observe that the presence of microbiota altered the proportions of different cell types in the gut (Fig. 5C). Specifically, we observed significant decreases in enteroblasts [Su(H)GBEGal4>UAS-GFP cells] and increases in enteroendocrine cells (Prospero-positive cells) in the guts of axenic flies compared to findings for their conventionally reared counterparts (Fig. 5C and D and 5E and F).
FIG 5 .

Impact of microbiota on cell identity of the gut. (A) The mitotic activity of the guts of conventionally reared flies is significantly higher than that of axenically reared flies, as measured by immunostaining with anti-Ph3 antibody. The impacts of microbiota on mitotic activity are more pronounced in the posterior region of the gut. Mean values from four experiments (n = 10 guts each) ± SE are shown; anterior, P = 0.04; middle, P = 0.39; posterior, P = 0.0019. Results from OregonR are shown; similar results were obtained with CantonS. (B) There is no significant difference in the number of midgut enterocytes in axenic and conventionally reared flies (mean values from 10 guts each ± SE; P = 0.4995). (C to F) Composition of cell types (eb, enteroblasts; ee, enteroendocrine cells) is altered in the guts of axenic versus conventionally reared flies. Quantitative measurements (C) of the ratio of cell types per region are shown. The expression of cell identity markers (D to F) in the guts of axenic or conventionally reared flies was compared. Expression of green fluorescent protein (GFP) under the control of progenitor cell (D) (stem cell and enteroblast; esg-Gal4TS; UAS-nlsGFP) or enteroblast (E) [Su(H)GBE-Gal4; UAS-mcd8GFP] reporter genes was monitored. (C and F) Enteroendocrine cells were quantified using anti-Prospero antibody. Representative images of GFP or anti-Prospero antibody signal from the guts of 4- to 7-day-old flies are shown. Guts were stained with DAPI and examined by fluorescence microscopy at magnification ×20, and images were taken of the anterior (R2) and posterior (R5) regions of the gut. Quantitative measurements were made by counting the number of GFP+ or anti-Prospero cells and total number of DAPI-positive cells per field of 10 individual guts and replicated at least three times (for panel D, anterior, P < 0.0001; posterior, P = 0.0003; for panel E, anterior, P = 0.106; posterior, P = 0.005; for panel F, anterior, P = 0.0002; posterior, P = 0.0017).
In addition to these changes in cell lineage in the gut, we observed that cell density was altered in the guts of axenically reared flies. In general, the organization of enterocytes in flies reared in the absence of bacteria appeared more regular (Fig. 6A). The distance between adjacent nuclei in flies lacking gut microbiota was on average twice that for conventionally reared flies (Fig. 6B), a phenomenon observed across multiple wild-type and transgenic lines. This impact on cell spacing occurred in both the anterior and posterior midgut and increased the total midgut length of axenically reared flies (Fig. 6C and D). Guts from axenically reared flies were on average 2 mm longer (approximately a 40% increase in total length) than the guts of flies reared with a microbiota (Fig. 6C). Importantly, this effect on gut length was not due to differences in the number of enterocytes of the gut, since there was not a significant difference in gut counts between axenic and conventionally reared flies (Fig. 5B). This effect of microbiota on gut length was restricted to the midgut, since there was no difference in the length of the hindgut when axenically reared flies were compared to their conventionally reared counterparts (Fig. 6C). This suggests that the midgut tissue was especially reactive to the microbiota and in particular the posterior midgut region (Fig. 6D).
FIG 6 .
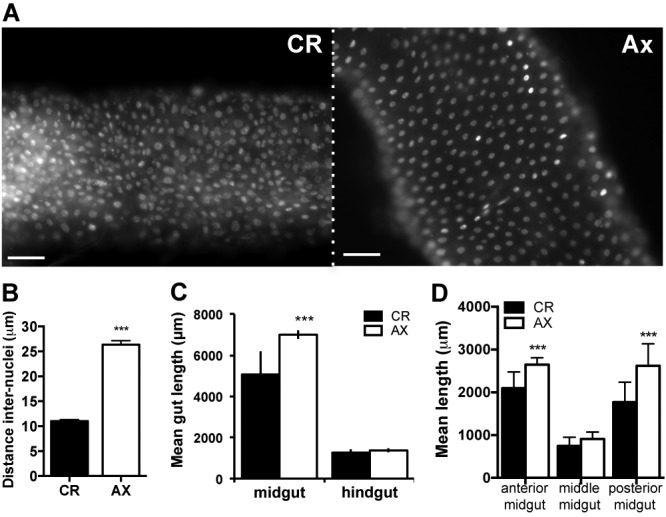
Microbiota alter gut morphology. (A) Nuclear staining (DAPI) of guts from axenically reared (Ax) flies reveals a decrease in cell density compared to that of the guts of conventionally reared (CR) flies. Representative images of the posterior midgut (R5) were taken at magnification ×20. Scale bars = 50 µm. (B) Quantification of the mean distance between the nearest adjacent nuclei (distance, internuclei [DIN]) in guts from AX and CR flies. The mean DIN for each condition was calculated from the average measure for individual guts (20 random measures per gut using DAPI-stained images as for panel B), and then the mean ± SE for 70 guts per condition were compared; P < 0.0001. (C) Mean length ± SE of the midgut and hindgut of Ax and CR flies. Lengths were measured from images of DAPI-stained guts from the midline of the proventriculous to the pyloric valve (midgut) and then from the pyloric valve to the beginning of the rectal ampulla (hindgut). Values are from four experiments (n = 6 to 10 guts each). For midgut, P < 0.0001; for hindgut, no significant difference. (D) The impact of the microbiota on the mean length for different midgut regions was assessed by measuring the length of the anterior (R1-R2), middle (R3), and posterior (R4-R5) midguts of both Ax and CR flies from images of DAPI-stained guts. Mean values for each region from three experiments (n = 5 guts each) ± SE are shown; anterior, P = 0.0018; middle, P = 0.09; posterior, P = 0.002. For simplification, data obtained from measures of guts of axenic and conventionally reared OregonR flies are shown; however, similar values were obtained from the guts of CantonS, esg-Gal4>UAS-mCD8-GFP, Su(H)GBE-Gal4>UAS-mCD8-GFP, and prospero-Gal4>UAS-mCD8-GFP flies.
Collectively, our data indicate that microbiota influence both the cell composition and morphology of the gut. This effect correlates with our transcriptome analysis identifying many genes involved in pathways important for stem cell proliferation, differentiation, and morphogenesis induced by microbiota.
DISCUSSION
In the present study, we have demonstrated that the microbiota of Drosophila melanogaster significantly alters gene expression, morphology, tissue architecture, and cellular identity in the gut. Consistent with the low diversity reported in previous studies (1, 4–6), our laboratory-reared flies were associated with two to three species of bacteria, with Lactobacillus plantarum being the most common and consistent species associated with flies across both wild-type and immune-deficient genotypes. Analysis of gut regions revealed a dependence on bacterial density as a function of gut geography, such that bacteria density was higher in the most proximal (crop) and distal (posterior midgut and hindgut) compartments. One interpretation of this finding is that upon ingestion, most bacteria are killed or digested in the anterior midgut, a region of the gut corresponding to high antimicrobial peptide production (21, 28, 29), but that surviving cells increase in numbers as they pass into the posterior gut. This increase in numbers in the posterior gut could be due to the expression of the regionalized transcription factor Caudal, which blocks the expression of antimicrobial peptides in the posterior midgut (4), or it could be a factor of the reduced flow rate of food through the gut in this region, given the increased folding of the gut within the abdominal cavity (21).
In addition to geographic variation, we and others have shown that bacterial density increases as flies age (14, 16), a finding also confirmed by this study. Accordingly, most gut immune genes are induced with aging, suggesting that increased bacterial density triggers a higher immune response. Contrary to most immune genes, we identified a number of immune and metabolic genes that are dysregulated in older flies. These genes are potentially markers of immune senescence and could explain how microbiota titers increase despite a general increased immune and stress response. These results are largely in agreement with those of a recent study examining the impact of microbiota on the gut transcriptome of aging flies (30). However, while we observed many of the same immune genes deregulated in the guts of old flies, there were distinct differences. Specifically, in both wild-type lines we examined, the expression of PGRP-SC1 but not PGRP-SC2 was increased by the presence of microbiota in the guts of young flies, a phenomenon that was lost in older flies. In contrast, we identified PGRP-SC2 as a gene upregulated in nongut carcass tissue of young flies when reared in the presence of microbiota. Further studies are needed to understand these differences, but one explanation may be the particular nutrient content of the two diets, since there are significant differences in both sugar (6.0 versus 0.8%) and yeast (1.8 versus 8%) levels between the findings of Guo et al. (30) and this study, respectively.
Given that microbiota are basal inducers of host immune responses (4, 14; this study), we evaluated the impact of microbiota on gene regulation in flies deficient for the Imd pathway, one of the major immune signaling pathways in the gut. Though the overall distribution of regulated genes was similar to that for wild-type flies, the overall response was dampened relative to the wild-type one, since in every category fewer genes were regulated. As expected, the largest reduction in regulated genes was in well-established targets of the Imd pathway, including antimicrobial peptides and Imd pathway components. Our analysis also revealed an unexpected impact of the Imd pathway on non-classically categorized immune response genes, particularly aspects of metabolism, gene expression, and signaling. This suggests the possibility of yet-to-be-uncovered functions of the Imd pathway and connections between different signaling pathways. In return, our data suggest that the basal immune response impacts gut-associated microbes by controlling density and restricting composition.
In addition to the immune response, we measured significant changes in the expression of genes known to be involved in developmental and homeostatic pathways (e.g., JAK-STAT, EGFR, and Notch pathways). In assessing the downstream consequences of these pathways, we observed that the presence of the microbiota was associated with changes in gut morphology. In particular, we noted that midguts were on average 40% longer in flies reared without microbiota. To investigate the mechanism responsible for the change in gut length we counted the number of enterocytes in adult midguts and found no significant difference between axenic and conventionally reared flies. This shows that the increased gut length is not due to an increase in cell number and instead suggests an explanation based on increased cell size or altered cell shape, which is supported by the larger internuclear distance in axenically reared flies. In this regard, activation of several signaling pathways has been shown to impact cell size and shape (31, 32), and we observed significant differences in activation of those signaling pathways between axenic and conventionally reared flies, including EGFR and insulin signaling. We do not believe that the lower rate of cell proliferation in the gut of axenic flies contributed to increased gut length, since this did not alter the number of cells in the gut. Instead, differences in mitotic activity are likely to reflect the lower damage and stress responses in the guts of axenically reared flies. We also observed changes in the composition of cell types in the gut of axenically reared flies, which could also contribute to changes in gut length. This compositional difference appeared to be due to a reduced number of differentiating progenitor cells (enteroblasts) and an increased number of enteroendocine cells in the gut of flies reared without microbiota. In this regard, one of the signaling pathways most affected by microbiota was the Notch pathway, which is implicated in multiple aspects of cell fate decisions and notably in terminal differentiation of intestinal stem cells in adult flies (33, 34). The specific microbial components and host mechanisms responsible for these changes will be the focus of future studies. Furthermore, whether these phenotypes are established at the larval or adult stage remains to be determined. Another question is whether the impact of microbiota is due to direct effects on the epithelium or they are mediated indirectly through their effects on other tissues. Along this line, a recent article demonstrated that conditions of nutrient scarcity in the larval stage, achieved by decreasing the amount of dietary yeast (levels below 2%), reduced branching of the adult tracheal system, which oxygenates the gut (35). It is therefore possible that effects observed in adult axenic flies are due to the loss of specific interactions between diet and microbiota at the developmental stage, which leads to alterations in trachea and gut physiology.
One surprising finding of this study was the variability in bacterial density between individual flies. Specifically, we observed significant interfly variability in bacterial counts despite similar age and rearing conditions. For example, counts of individual flies reared in the same tube varied by as much as 5-fold. Strikingly, we frequently observed flies with no detectable levels of culturable bacteria, with our methodology having a limit of detection of <100 cells per gut. The source of this variability is not fully understood but is consistent with the notion that maintenance of the D. melanogaster microbiota requires frequent replenishment (6). In agreement, we noted that the simple act of transferring flies to new sterile medium generally resulted in a drop in the bacterial load. We also observed a correlation between bacterial counts and the amount of food in the gut, suggesting that the inoculum level of the food, time since last feeding, and feeding preferences of individual flies also contribute to variability in microbiota composition and density. This is further supported by our data showing that larvae, which feed constantly, have more consistent counts of bacteria than those observed in adult flies. To date, no study has demonstrated growth of microbes in the gut, and it is not known whether the Drosophila gut provides a stable ecological niche for most bacteria. The requirement for regular replenishment of the microbiota and the role of food as a major source of these microbes has important impacts on the dynamics of this association. In this vein, the lowest bacterial density measured in a given cohort over time was related to the starting density, suggesting that the initial bacterial load of a given cohort of flies may determine the long-term bacterial density, including that for their progeny. To add to the complexity of this phenomenon, different bacterial species may be lost at different rates. For example, both in starvation experiments and across generations of gnotobiotic lines, we observed that Acetobacter pasteurianus was more susceptible to being lost from the population, and when lost, it was slower to reestablish itself in the community. Furthermore, the full diversity of the microbiota within the ecosystem (vial or fruit) may be greater than what is observed at a single time point or within a subsample of flies.
Despite this variability, we found robust and consistent effects on the fly immune response and gut structure of individuals, highlighting a complex relationship between host physiology and its associated bacterial consortia. This would indicate that it is not the presence of bacteria in the gut that is the critical factor but rather the overall microbial environment in which the fly develops and lives, an environment that in both the gut and substrate encompasses live and dead bacteria, as well as microbial products and elicitors (i.e., peptidoglycan). As such, the impact of microbiota on host gene expression and gut structure could be due to such products inducing a constant response. Another explanation for the robust outcomes could be the existence of a threshold effect that occurs with relatively few microorganisms, after which large differences in bacterial density make little or no difference and the persistence of physiological changes does not require constant association. Nevertheless, we cannot exclude that some of the effects we observed were due to indirect effects of microbiota on the host, such as modification of the food substrate (predigestion of nutrients, alterations in pH, etc.), nor can we conclude that there is not individual variability in gene expression due to the variability of microbiota. In this regard, our experimental design involved studying two genotypes, carrying out three microarray replicates, confirming a subset of the regulated genes by RT-qPCR, and examining expression of an immune (Diptericin) and stress/homeostatic (Upd3) gene in individual guts, and we found the results to be consistent and reproducible. The genes altered by the presence of microbiota were broadly distributed and included representatives of the immune response and metabolic and developmental pathways, as well as a large number of genes of unknown function. Of the core response shared between the two wild-type fly lines, the great majority of altered genes were induced. Of note, the largest category of downregulated genes was associated with metabolism, transporters being particularly represented among them. One explanation is that microbiota may be contributing to the metabolic process of the host, either directly in the gut or by preprocessing food prior to host ingestion. Such a function could require less host energy when microbiota are present. Alternatively, the microbiota may itself be a food source, requiring less host metabolic input. Whatever the explanation, the presence of microbiota has significant impacts on gene regulation in the gut, and its effect is rather local, as supported by the relative paucity of genes altered in nongut tissue.
In summary, this study demonstrates an intricate interdependence between immunity, development, and attributes of the microbiota in D. melanogaster. Specifically, we have demonstrated that despite extensive interfly variability in the density and composition of bacteria in the gut, the microbiota has robust and consistent effects on gut physiology, as measured by gene expression, and on gut development, as measured by morphology, epithelium architecture, and cellular identity. For many of the genes we identified, the effects of microbiota persist despite differences in fly genetic background, age, or even immune status, as well as gut microbiota composition. In fact, our results argue that the conceptual notion of the term microbiota, which is usually defined in the context of composition and density, does not provide a full accounting for its effects on the host. Instead, our results highlight a complex interaction between Drosophila and its microbiota that affects host immunity, metabolism, and development such that the emergent host-microbe holobiont (36) demonstrates properties not reducible to either the fly or its associated microbiota.
MATERIALS AND METHODS
Drosophila stocks and rearing. (i) Fly stocks.
OregonR and CantonS served as wild-type strains. The impact of the Imd pathway on gut microbiota composition and host gene expression was characterized using the RelE20 Imd mutant, which is described elsewhere (37). The RelE20 mutation also affects a nearby gene, CG18466, which is inferred by sequence similarity to be involved in carbohydrate metabolism. Of note, expression of CG18466 was not altered by microbiota or any of our treatments. Additional impacts of the Imd pathway were analyzed using a b,pr, imd1 mutant, described by Lemaitre et al. (38). The esg-Gal4>UAS-mCD8-GFP, Su(H)GBE-Gal4>UAS-mCD8-GFP, and prospero-Gal4>UAS-mCD8-GFP transgenic strains were used for determining the composition of cells in the gut and are described elsewhere (39–41). Immune and homeostatic/stress activity of individual guts was determined using the fly line DD1, which carries a Diptericin-lacZ reporter (yw, P[Dpt - lacZ ry+], P[Drs - GFP w+]) (42), or upd3-Gal4>UAS-GFP flies (43), respectively.
(ii) General rearing.
All stocks were reared on autoclaved medium in glass tubes without the addition of live yeast at 25°C. Per liter of water, 58.8 g inactivated yeast (Biospringer Springaline BA95/0), 58.8 g maize flour (Westhove Farigel maize H1), 7.5 g agar, and 58 ml of a 1:1 mix of grape and multifruit juice (approximately 8.2 g of sugar) were combined with water, heated to boiling, and then mixed at 80°C for 30 min, and 4.85 ml of 99% propionic acid and 30 ml of a 10% solution of methylparaben in 85% ethanol were added when the mixture had cooled to 65°C.
(iii) Deriving axenic and gnotobiotic lines.
To obtain axenic fly stocks, embryos laid over a 10-h period on grape juice plates were collected from 4- to 6-day-old females. Embryos were rinsed in 1× phosphate-buffered saline (PBS), and any hatched larvae or loose agar pieces were removed with sterile forceps. All proceeding steps were performed in a sterile hood. Embryos were rinsed in 70% ethanol and placed in a 3% solution of sodium hypochlorite for 10 min. The bleach solution was discarded and embryos were rinsed three times in sterile double-distilled water. Embryos were transferred by pipette into sterile tubes in a small amount of 100% ethanol and maintained at 25°C. Subsequent generations were maintained in parallel to their conventionally reared counterparts by transferring adults to new sterile tubes in a biosafety hood. The axenic state of flies was routinely assessed by both culturing and PCR using 16S rRNA primers.
Gnotobiotic lines were established by contaminating axenic lines with bacterial strains initially isolated from the guts of conventionally reared wild-type flies. Representative isolates, maintained as freezer stocks (20% dimethyl sulfoxide [DMSO]), of the three most commonly recovered strains from flies in our laboratory, of Lactobacillus plantarum, Lactobacillus brevis, and Acetobacter pasteurianus, were used individually or in combination. Isolates were grown overnight in 20 ml of MRSA broth in a shaking incubator at 29°C. Cultures were spun down for 20 min at 4,000 rpm at 4°C, and the pellet was rinsed once and then resuspended in 5 ml of 1× PBS. Cell counts were determined for each culture with a Petroff-Hauser counting chamber, and each culture was adjusted to a concentration of 2 × 10⁶ CFU/ml. Cultures were applied to the surface of sterile medium in a 50-µl total volume with 1.0 × 10⁵ cells of each strain per tube. The culture was allowed to soak into the medium for 30 min before either axenic embryos or flies were added, depending on which life stage (larvae or adult) was desired for the initial reassociation with microbiota.
(iv) Preparation and staging of flies for microarray analysis.
Ten tubes per genotype (Or, Cs, and Rel) and condition (axenic and conventionally reared) were established in August 2010 and maintained at 25°C as described above. With each generation, efforts were taken to reduce possible rearing effects by synchronizing when cohorts of flies were transferred and by controlling for larval/adult crowding. For each repeat, 60 females were randomly selected ,and their guts were dissected on dry ice in sterile 1× PBS and then placed in TRIzol reagent (Invitrogen) on ice. Each replicate was dissected at the same time of day (12:30 to 14:30 Central European Time [CET]), and all genotypes and conditions per repeat were dissected within 2 h of the starting time. After each sample was completed, the guts were homogenized with a bead beater and placed at −20° C until further processed. For young samples, 2- to 4-day-old flies were first transferred onto new medium for 2 days, and then female flies from across the ten tubes were pooled and randomly selected for dissection. The remaining young flies were maintained in their respective tubes and flipped every 3 days thereafter for comparative “old” cohorts. Young gut and carcass microarray samples were dissected on 6 October 2010, 13 October 2010, and 20 October 2010. Old gut and carcass microarray samples were dissected on 10 November 2010, 17 November 2010, and 24 November 2010.
Analysis of bacteria. (i) Culture dependent.
Quantification of culturable gut-associated bacteria was determined from individual replicates of dissected guts (crop to hindgut, minus the Malpighian tubules) from either single flies or pools of five individuals from the same rearing tube. Flies were surface sterilized in 95% ethanol for 1 min, and dissected guts were placed in 1 ml of 1× PBS in a 1.5-ml screw-top microcentrifuge tube containing glass beads. Samples were homogenized using a Precellys 24 instrument (Bertin Technologies, France), and then five 1/10 serial dilutions were made and plated on both Man, Rogosa, and Sharpe (MRS) and mannitol agar and incubated at 25°C. Colonies were counted after 48 and 96 h. Colonies were grouped based on classic morphological features (color, shape, margins, elevation, and texture), and two isolates of each designated morphology were purified for individual colonies. Representative isolates were identified by PCR amplification and sequencing of the 16S rRNA gene, using primers 27F, 559F, 907R, and 1492R. Subsequent quantification was based on designated morphological features with periodic validation by 16S rRNA amplification and sequencing.
(ii) Culture independent.
Adult female flies were surface sterilized for 1 min in 95% ethanol prior to dissection. Pools of 10 dissected guts, with the Malphigian tubules removed, were placed in 1 ml of 1× PBS in a 1.5-ml screw-top microcentrifuge tube containing glass beads and homogenized as described above. Samples were placed in a −20°C freezer until further processing, and total microbial DNA was extracted using a previously described protocol (44). Bacterial 16S rRNA was amplified using the primers 27F and 1492R, and clone libraries were constructed using the TOPO TA cloning kit (pCR4-TOPO vector and One Shot TOP10 chemically competent E. coli cells; Invitrogen) according to the manufacturer’s instructions. Clone inserts were PCR amplified using the vector primers T7 and M13R and then sequenced from AMPure XP (Agencourt)-cleaned reactions using the primers 27F, 559F, 907R, and 1391R using the BigDye kit on an ABI Prism 3730 (Applied Biosystems) sequencing machine. Overlapping regions from the forward and reverse reads of 16S rRNA sequences were compiled using the Codon Code Aligner software program (Codon Code Corporation, Dedham, MA). Sequences were analyzed using the RDP pipeline (http://rdp.cme.msu.edu/) and sequences matching the intracellular symbiont Wolbachia sp. (detected in Relish and CantonS libraries) were removed from the analysis.
Tissue collection and preparation. (i) Microarray.
RNA pools from 60 guts of 4- to 6-day-old females or 35- to 40-day-old females were isolated by TRIzol extraction, purified using RNA cleanup purification kits (Macherey-Nagel), and DNase treated. RNA was quantified by using a NanoDrop ND-1000 spectrophotometer, and RNA quality was controlled on Agilent 2100 Bioanalyzer chips. For each sample, 1 mg of total RNA was amplified and labeled using the GeneChip IVT labeling kit according to the protocol provided by the supplier. Affymetrix Drosophila Genome 2.0 arrays were hybridized with 30 mg of labeled cRNA, washed, stained, and scanned according to the protocol described in the Affymetrix manual. Three independent repeats were performed for each time point, and gene expression profiles from conventionally reared flies were normalized to their axenic counterparts. Statistical analyses were performed using the R and Bioconductor statistical software packages.
(ii) Live imaging and immunostaining.
For live imaging, guts were dissected in 1× PBS and immediately mounted in the antifading agent Citifluor AF1 (Citifluor Ltd.). For immunofluorescence, guts were dissected in PBS, fixed for 20 min in 0.1% Tween 20-PBS (PBT) with 4% paraformaldehyde, rinsed in PBT, and then incubated with primary antibodies (1:500 anti-PH3 [Millipore], 1:500 anti-Prospero [DSHB], and 1:1,000 anti-GFP [Roche]) in PBT plus 1% bovine serum albumin. Primary antibodies were revealed with Alexa 488 or Alexa 594-coupled anti-mouse antibodies (Invitrogen), and nuclei were stained with 4′,6-diamidino-2-phenylindole (DAPI) (Sigma). Guts were then scanned with an Axioplot imager (Zeiss) and recomposed using the software program MosaiX (Zeiss).
(iii) Morphological analysis.
Measurements were determined using dissected guts fixed as described above and stained with DAPI. Individual guts (n = 20 to 40) were visualized and captured using an Axioplot imager (Zeiss). Full guts were scanned at magnification ×10 and then recomposed with MosaiX (Zeiss). Images from representative fields (one anterior [R2] and one posterior [R5] midgut) of the same guts were captured at magnification ×20, and full projections were counted. Measurements to the nearest micrometer were obtained using the measure functions within AxioVision software (Zeiss). Length was measured by tracing from the middle of the proventriculus along the midgut to the midgut-hindgut junction (indicated by the branching of the Malphigian tubules). Total counts of enterocytes in the guts of axenic and conventionally reared flies were estimated by counting the total number of large nucleus-DAPI-positive cells in ×10 composite images from OregonR guts (n = 10 for each condition) and verified in CantonS and esg-Gal4>UAS-mCD8-GFP (n = 2 for each condition) guts. Counts of midgut cell populations were made on the basis of values obtained from counting the different cell populations in the projected ×20 z-stack images and then determining their ratios over the total number of cells in the field. The distinction between cell types was based on GFP or antibody staining [progenitors expressing GFP under the control of the esg-Gal4 driver, enteroblasts expressing GFP under the control of the Su(H)Gal4 driver, and enteroendocrine cells positive for anti-Prospero antibody (DHSB) and the level of polyploidy (nuclear size)]. Cell density was determined by measuring the distance from the nucleus of a given cell to the nucleus of its nearest neighboring cell, or distance, internuclei (DIN). The values for 20 cells in a single field per gut of 20 guts were measured for each region (R2 and R5). The same position in the gut was recorded each time, and the average distance for each genotype [OregonR, CantonS, esg-Gal4>UAS-mCD8-GFP, Su(H)GBE-Gal4>UAS-mCD8-GFP, and prospero-Gal4>UAS-mCD8-GFP] and condition (axenic or conventionally reared) were plotted. For simplification, data for OregonR cells are presented, since similar results were obtained across genotypes.
(iv) Quantification of food in the gut.
Adult flies (4 to 7 days old) that had been starved for 2 h were placed on food dyed with eriauglaucine (2.5% [wt/vol]). Individual dissected guts were placed in 1× PBS, crushed with a pestle, and gently spun to remove tissue debris, and the optical density (OD) of samples was measured in 96-well plates at 405 nm. The 0 percentage was based on the OD measurements of flies fed on blue food and then starved for 4 h, which cleared the food from the gut. This value was subtracted from all values as the baseline. The 100% value was determined based on the OD level of guts that were visibly full of blue food when dissected. All OD measurements were calculated as a percentage of the full gut (100% fed) average value, and values were grouped by 10% intervals (0 to 10%, 11 to 20%, etc.), and the frequency of flies within each group (bin) was plotted.
(v) Quantification of the antimicrobial peptide diptericin in individual guts.
The quantification of diptericin expression in individual guts was done using transgenic Dpt-lacZ flies and titrating LacZ activity. The 0% value was obtained based on the average for guts from axenic DD flies. The 100% value was set as the maximum value for all samples per transgene. Three different Dpt-LacZ transgenes were assayed. Individual guts were dissected and crushed in Z buffer (60 mM Na2HPO4, 60 mM NaH2PO4, 10 mM KCl, 1 mM MgSO4, and 50 mM β-mercaptoethanol [adjusting the pH to 8 with NaOH] with o-nitrophenyl-β-d-galactopyranoside [ONPG]). β-Galactosidase activity in each sample was determined by measuring the OD at 420 nm. The measurements from individual flies were grouped by 10% intervals, and the frequency of flies within each group was plotted.
(vi) RT-qPCR.
Total gut RNA was extracted from 30 dissected midguts with TRIzol reagent (Invitrogen). Template RNA (1 µg) was used to generate cDNA by reverse transcription, followed by analysis by quantitative PCR (qPCR) using a LightCycler 2.0 instrument and the SYBR green I kit (Roche). Expression values were normalized to RpL32. Primers used to monitor mRNA quantification are available upon request.
(vii) Statistical analysis.
Mean mitosis per gut (PH3 counts), mean relative gene expression, mean length, and mean CFUs and their corresponding standard errors were determined using the GraphPad Prism software program. Significance was determined by analysis of variance (ANOVA) or standard t tests using the analysis feature of GraphPad Prism.
Accession numbers.
Sequences determined in this work were submitted to GenBank under accession numbers KJ746604 through KJ746613. Raw data and processed files from the microarray analysis have been deposited in ArrayExpress (accession number E-MTAB-2447).
SUPPLEMENTAL MATERIAL
Aspects that contribute to high interfly variability of D. melanogaster gut-associated bacteria. (A) Counts of bacteria (CFUs) isolated from individual guts of aged (35 to 40 days old) conventionalized flies (CV). Three replicates of 25 female flies were established per genotype. Young (2 to 4 days old) axenically reared (AX) flies were placed in vials of sterile food, to which 105 cells (each) of L. plantarum (Lp), L. brevis (Lb), and A. pasteurianus (Ap) had been added and allowed to dry. Vials were flipped every 3 days until sampling, when individual guts were dissected and plated for bacterial enumeration. Two wild-type lines (OregonR and CantonS) and two immune-deficient lines (RelishE20 and Imd1) were assayed. (B) Profiles of the composition and proportion of microbiota members in individual conventionalized flies from panel A. Five randomly selected individuals of OregonR from each reassociation cohort are shown. The proportion of each species isolated from individual guts is shown. (C) Experimental designs of assays to test impact of aging and transmission of microbiota to F1. For F0 (D1), cohorts of 25 2-day-old female flies were collected, 5 of which were dissected for time 0 bacterial counts. The remaining 20 flies were housed together in vials and flipped onto new media every 4 days. At each sample time point, 5 females per replicate were removed, dissected, and plated to analyze individual CFU counts per gut. For F1 (D2), the vial that housed flies on days 12 to 16 was kept to examine the progeny. Emerging F1 flies were collected at different time points (12, 24, 48, and 72 h) posteclosion and transfered to new vials. Cohorts of flies were transferred to new vials every 4 days, and flies were dissected at 30 to 35 days old to enumerate bacterial density and composition. (D1) CFU counts from individual guts of F0 conventionally reared flies over time. Individual flies were dissected and plated to determine the composition and density of the microbiota. (D2) The length of time that cohorts of flies spent posteclosion (12, 24, 48, or 72 h) in the vials they emerged from did not impact counts of bacteria in individual guts. (E) Effect of starvation of culturable bacterial counts from the gut of individual flies. Shifting flies onto water agar led to significant decreases in culturable bacteria after 2 h, and counts continued to decline through 8 h. Culturable bacterium counts stabilize when flies are returned to sterile medium. (F) The high interfly variability observed in female adult flies is not observed in larvae. (G) Representative histological section of live (green)/dead (red) staining of D. melanogaster gut microbiota. Due to the nonspecific green signal from dead yeast in the food, DAPI staining was included. Due to its staining of all DNA, we were able to reveal both host enterocyte nuclei within the epithelium (large blue nuclei) as well dead (purple) and living (blue/green) bacterial cells. Scale bar = 20 µm. Download
Confirmation of microarray by RT-qPCR and transgene expression. (A) Expression levels of selected genes in guts of axenic (OrX) and conventionally reared (OrNX) flies. RT-qPCR was performed with total RNA extracts from three biological replicates of 30 guts of 4- to 7-day-old flies. This experiment confirmed that the expression of antimicrobial peptide genes (Dpt, AttB, and AttD), amidase PGRPs (PGRP-SC1 and PGRP-LB); components of the JAK-STAT (upd3 and sosc36E), EGFR (Vein, Keren, and Argos), JNK (Puc), and Notch pathways, as well as the antioxidant (GstD5) and insulin receptor (InR), were reduced in the absence of microbiota. In contrast, the level of prospero was higher in the gut of axenic flies. (B and C) Representative images of Diptericin-lacZ (B) or Upd3-GFP (C) expression in the guts of conventionally or axenically reared flies. Scale bars = 500 µm. Bright-field (B) or two-channel (GFP and DAPI) (C) images were acquired at magnification 10× using an Axioplot imager (Zeiss). The full gut images were recomposed from the overlapping tile images using the program MosaiX (Zeiss). The stitched composite image was then processed to correct for shading differences across the individual tiles. Download
Expression profile of the core set of genes altered by microbiota in the gut of Drosophila; genes showing a fold change (upregulated by ≥1.3; downregulated by ≤1.3) in the guts of both OregonR and CantonS young flies (4 to 6 days old); fold changes for each wild type are indicated; fold changes for CantonS old flies (35 to 40 days old) are shown for comparison; in the ‘‘DIRG’’ column, ‘‘+’’ indicates genes previously identified as upregulated in whole flies upon septic injury with a mixture of E. coli and Micrococcus luteus (20); the column ‘‘GIRG” shows genes that were also upregulated in the gut upon ingestion of Ecc15 (19).
Impact of the immune deficiency pathway on expression of genes altered by microbiota; complete list of genes showing a fold change (upregulated by ≥1.3, downregulated by ≤1.3) in the guts of OregonR young flies (4 to 6 days old) and the impact of the Imd pathway (guts from 4- to 6-day-old RelishE20 flies) on their expression
Impact of aging on genes upregulated by microbiota; genes upregulated by microbiota (≥1.3-fold) specifically in the guts of young (4 to 6 days old) or old (35 to 40 days old) flies and those shared between both young and old CantonS flies; fold changes for each gene at both ages are indicated
Impact of aging on genes downregulated by microbiota; genes downregulated by microbiota (≤1.3-fold) specifically in the guts of young (4 to 6 days old) or old (35 to 40 days old) flies and those shared between both young and old CantonS flies; fold changes for each gene at both ages are indicated
Microbiota-altered genes shared between young OregonR and old CantonS flies; genes that were regulated by microbiota in the guts of young OregonR (4 to 6 days old) and old CantonS (35 to 40 days old) flies but were not altered in CantonS young flies; fold changes for young OregonR and old CantonS flies, as well as young CantonS flies, are shown for comparison
Microbiota-altered genes in nongut tissues; genes that were regulated by microbiota and their fold changes in nongut tissues of young (4 to 6 days old) CantonS flies; genes are listed in order of expression level; bolded genes were specifically altered in nongut tissues, while other genes were altered in both gut and nongut tissues; in the ‘‘DIRG’’ column, ‘‘+’’ indicates genes previously identified as upregulated in whole flies upon septic injury with a mixture of E. coli and M. luteus (20); the column ‘‘GIRG” shows genes that were also upregulated in the gut upon ingestion of Ecc15 (19).
ACKNOWLEDGMENTS
This work was supported by a Human Frontiers Long-Term Postdoctoral Fellowship (to N.A. Broderick), a European Research Council Advanced Investigators Grant, and the Swiss National Science Foundation (3100A0-12079/1).
We thank J. P. Boquete, B. Lecrinier, and D. Brandelise for technical assistance and members of the Lemaitre lab for valuable feedback.
Footnotes
Citation Broderick NA, Buchon N, Lemaitre B. 2014. Microbiota-induced changes in Drosophila melanogaster host gene expression and gut morphology. mBio 5(3):e01117-14. doi:10.1128/mBio.01117-14.
REFERENCES
- 1. Cox CR, Gilmore MS. 2007. Native microbial colonization of Drosophila melanogaster and its use as a model of Enterococcus faecalis pathogenesis. Infect. Immun. 75:1565–1576. 10.1128/IAI.01496-06 [DOI] [PMC free article] [PubMed] [Google Scholar]
- 2. Chandler JA, Lang JM, Bhatnagar S, Eisen JA, Kopp A. 2011. Bacterial communities of diverse Drosophila species: ecological context of a host-microbe model system. PLoS Genet. 7:e1002272. 10.1371/journal.pgen.1002272 [DOI] [PMC free article] [PubMed] [Google Scholar]
- 3. Corby-Harris V, Pontaroli AC, Shimkets LJ, Bennetzen JL, Habel KE, Promislow DE. 2007. Geographical distribution and diversity of bacteria associated with natural populations of Drosophila melanogaster. Appl. Environ. Microbiol. 73:3470–3479. 10.1128/AEM.02120-06 [DOI] [PMC free article] [PubMed] [Google Scholar]
- 4. Ryu JH, Kim SH, Lee HY, Bai JY, Nam YD, Bae JW, Lee DG, Shin SC, Ha EM, Lee WJ. 2008. Innate immune homeostasis by the homeobox gene caudal and commensal-gut mutualism in Drosophila. Science 319:777–782. 10.1126/science.1149357 [DOI] [PubMed] [Google Scholar]
- 5. Wong CN, Ng P, Douglas AE. 2011. Low-diversity bacterial community in the gut of the fruitfly Drosophila melanogaster. Environ. Microbiol. 13:1889–1900. 10.1111/j.1462-2920.2011.02511.x [DOI] [PMC free article] [PubMed] [Google Scholar]
- 6. Blum JE, Fischer CN, Miles J, Handelsman J. 2013. Frequent replenishment sustains the beneficial microbiome of Drosophila melanogaster. mBio 4(6):e00860–13. 10.1128/mBio.00860-13 [DOI] [PMC free article] [PubMed] [Google Scholar]
- 7. Staubach F, Baines JF, Künzel S, Bik EM, Petrov DA. 2013. Host species and environmental effects on bacterial communities associated with Drosophila in the laboratory and in the natural environment. PLoS One 8:e70749. 10.1371/journal.pone.0070749 [DOI] [PMC free article] [PubMed] [Google Scholar]
- 8. Broderick NA, Lemaitre B. 2012. Gut-associated microbes of Drosophila melanogaster. Gut Microbes 3:307–321. 10.4161/gmic.19896 [DOI] [PMC free article] [PubMed] [Google Scholar]
- 9. Bakula M. 1969. The persistence of a microbial flora during postembryogenesis of Drosophila melanogaster. J. Invertebr. Pathol. 14:365–374. 10.1016/0022-2011(69)90163-3 [DOI] [PubMed] [Google Scholar]
- 10. Ridley EV, Wong AC, Westmiller S, Douglas AE. 2012. Impact of the resident microbiota on the nutritional phenotype of Drosophila melanogaster. PLoS One 7:e36765. 10.1371/journal.pone.0036765 [DOI] [PMC free article] [PubMed] [Google Scholar]
- 11. Storelli G, Defaye A, Erkosar B, Hols P, Royet J, Leulier F. 2011. Lactobacillus plantarum promotes Drosophila systemic growth by modulating hormonal signals through TOR-dependent nutrient sensing. Cell Metab. 14:403–414. 10.1016/j.cmet.2011.07.012 [DOI] [PubMed] [Google Scholar]
- 12. Shin SC, Kim SH, You H, Kim B, Kim AC, Lee KA, Yoon JH, Ryu JH, Lee WJ. 2011. Drosophila microbiome modulates host developmental and metabolic homeostasis via insulin signaling. Science 334:670–674. 10.1126/science.1212782 [DOI] [PubMed] [Google Scholar]
- 13. Newell PD, Douglas AE. 15 November 2013. Among-species interactions determine the impact of gut microbiota on nutrient allocation in Drosophila melanogaster. Appl. Environ. Microbiol. 10.1128/AEM.02742-13 [DOI] [PMC free article] [PubMed] [Google Scholar]
- 14. Buchon N, Broderick NA, Chakrabarti S, Lemaitre B. 2009. Invasive and indigenous microbiota impact intestinal stem cell activity through multiple pathways in Drosophila. Genes Dev. 23:2333–2344. 10.1101/gad.1827009 [DOI] [PMC free article] [PubMed] [Google Scholar]
- 15. Sharon G, Segal D, Ringo JM, Hefetz A, Zilber-Rosenberg I, Rosenberg E. 2010. Commensal bacteria play a role in mating preference of Drosophila melanogaster. Proc. Natl. Acad. Sci. U. S. A. 107:20051–20056. 10.1073/pnas.1009906107 [DOI] [PMC free article] [PubMed] [Google Scholar]
- 16. Ren C, Webster P, Finkel SE, Tower J. 2007. Increased internal and external bacterial load during Drosophila aging without life-span trade-off. Cell Metab. 6:144–152. 10.1016/j.cmet.2007.06.006 [DOI] [PubMed] [Google Scholar]
- 17. Wong AC-N, Chaston JM, Douglas AE. 2013. The inconstant gut microbiota of Drosophila species revealed by 16S rRNA gene analysis. ISME J. 7:1922–1932. 10.1038/ismej.2013.86 [DOI] [PMC free article] [PubMed] [Google Scholar]
- 18. Lhocine N, Ribeiro PS, Buchon N, Wepf A, Wilson R, Tenev T, Lemaitre B, Gstaiger M, Meier P, Leulier F. 2008. PIMS modulates immune tolerance by negatively regulating Drosophila innate immune signaling. Cell Host Microbe 4:147–158. 10.1016/j.chom.2008.07.004 [DOI] [PubMed] [Google Scholar]
- 19. Buchon N, Broderick NA, Poidevin M, Pradervand S, Lemaitre B. 2009. Drosophila intestinal response to bacterial infection: activation of host defense and stem cell proliferation. Cell Host Microbe 5:200–211. 10.1016/j.chom.2009.01.003 [DOI] [PubMed] [Google Scholar]
- 20. de Gregorio E, Spellman PT, Rubin GM, Lemaitre B. 2001. Genome-wide analysis of the Drosophila immune response by using oligonucleotide microarrays. Proc. Natl. Acad. Sci. U. S. A. 98:12590–12595. 10.1073/pnas.221458698 [DOI] [PMC free article] [PubMed] [Google Scholar]
- 21. Buchon N, Osman D, David FPA, Boquete J-P, Deplancke B, Lemaitre B. 2013. Morphological and molecular characterization of adult midgut compartmentalization in Drosophila. Cell Rep. 3:1725–1738. 10.1016/j.celrep.2013.04.001 [DOI] [PubMed] [Google Scholar]
- 22. Miquel J, Bensch KG, Philpott DE, Atlan H. 1972. Natural aging and radiation-induced life shortening in Drosophila melanogaster. Mech. Ageing Dev. 1:71–97. 10.1016/0047-6374(72)90054-1 [DOI] [Google Scholar]
- 23. Gartner LP. 1973. Ultrastructural examination of ageing and radiation-induced life-span shortening in adult Drosophila melanogaster. Int. J. Radiat. Biol. Relat. Stud. Phys. Chem. Med. 23:23–39. 10.1080/09553007314550031 [DOI] [PubMed] [Google Scholar]
- 24. Biteau B, Hochmuth CE, Jasper H. 2008. JNK activity in somatic stem cells causes loss of tissue homeostasis in the aging Drosophila gut. Cell Stem Cell 3:442–455. 10.1016/j.stem.2008.07.024 [DOI] [PMC free article] [PubMed] [Google Scholar]
- 25. Biteau B, Karpac J, Supoyo S, Degennaro M, Lehmann R, Jasper H. 2010. Lifespan extension by preserving proliferative homeostasis in Drosophila. PLoS Genet. 6:e1001159. 10.1371/journal.pgen.1001159 [DOI] [PMC free article] [PubMed] [Google Scholar]
- 26. Choi NH, Kim JG, Yang DJ, Kim YS, Yoo MA. 2008. Age-related changes in Drosophila midgut are associated with PVF2, a PDGF/VEGF-like growth factor. Aging Cell 7:318–334. 10.1111/j.1474-9726.2008.00380.x [DOI] [PMC free article] [PubMed] [Google Scholar]
- 27. Paredes JC, Welchman DP, Poidevin M, Lemaitre B. 2011. Negative regulation by amidase PGRPs shapes the Drosophila antibacterial response and protects the fly from innocuous infection. Infect. Immun. 35:770–779. 10.1016/j.immuni.2011.09.018 [DOI] [PubMed] [Google Scholar]
- 28. Tzou P, Ohresser S, Ferrandon D, Capovilla M, Reichhart JM, Lemaitre B, Hoffmann JA, Imler JL. 2000. Tissue-specific inducible expression of antimicrobial peptide genes in Drosophila surface epithelia. Immunity 13:737–748. 10.1016/S1074-7613(00)00072-8 [DOI] [PubMed] [Google Scholar]
- 29. Marianes A, Spradling AC, Brand A. 2013. Physiological and stem cell compartmentalization within the Drosophila midgut. eLife 2:e00886. 10.7554/eLife.00886.001 [DOI] [PMC free article] [PubMed] [Google Scholar]
- 30. Guo L, Karpac J, Tran SL, Jasper H. 2014. PGRP-SC2 promotes gut immune homeostasis to limit commensal dysbiosis and extend lifespan. Cell 156:109––122. 10.1016/j.cell.2013.12.018 [DOI] [PMC free article] [PubMed] [Google Scholar]
- 31. Edgar BA. 2006. How flies get their size: genetics meets physiology. Nat. Rev. Genet. 7:907–916. 10.1038/nrg1989 [DOI] [PubMed] [Google Scholar]
- 32. Buchon N, Broderick NA, Kuraishi T, Lemaitre B. 2010. Drosophila EGFR pathway coordinates stem cell proliferation and gut remodeling following infection. BMC Biol. 8:152. 10.1186/1741-7007-8-152 [DOI] [PMC free article] [PubMed] [Google Scholar]
- 33. Perdigoto CN, Schweisguth F, Bardin AJ. 2011. Distinct levels of Notch activity for commitment and terminal differentiation of stem cells in the adult fly intestine. Development 138:4585–4595. 10.1242/dev.065292 [DOI] [PubMed] [Google Scholar]
- 34. Perdigoto CN, Bardin AJ. 2013. Sending the right signal: Notch and stem cells. Biochim. Biophys. Acta 1830:2307–2322. 10.1016/j.bbagen.2012.08.009 [DOI] [PubMed] [Google Scholar]
- 35. Linneweber GA, Jacobson J, Busch KE, Hudry B, Christov CP, Dormann D, Yuan M, Otani T, Knust E, de Bono M, Miguel-Aliaga I. 2014. Neuronal control of metabolism through nutrient-dependent modulation of tracheal branching. Cell 156:69–83. 10.1016/j.cell.2013.12.008 [DOI] [PMC free article] [PubMed] [Google Scholar]
- 36. Zilber-Rosenberg I, Rosenberg E. 2008. Role of microorganisms in the evolution of animals and plants: the hologenome theory of evolution. FEMS Microbiol. Rev. 32:723–735. 10.1111/j.1574-6976.2008.00123.x [DOI] [PubMed] [Google Scholar]
- 37. Hedengren M, Dushay MS, Ando I, Ekengren S, Wihlborg M, Hultmark D. 1999. Relish, a central factor in the control of humoral but not cellular immunity in Drosophila. Mol. Cell 4:827–837 [DOI] [PubMed] [Google Scholar]
- 38. Lemaitre B, Kromer-Metzger E, Michaut L, Nicolas E, Meister M, Georgel P, Reichhart JM, Hoffmann JA. 1995. A recessive mutation, immune deficiency (imd), defines two distinct control pathways in the Drosophila host defense. Proc. Natl. Acad. Sci. U. S. A. 92:9465–9469. 10.1073/pnas.92.21.9465 [DOI] [PMC free article] [PubMed] [Google Scholar]
- 39. Zeng X, Chauhan C, Hou SX. 2010. Characterization of midgut stem cell- and enteroblast-specific Gal4 lines in Drosophila. Genesis 48:607–611. 10.1002/dvg.20661 [DOI] [PMC free article] [PubMed] [Google Scholar]
- 40. Micchelli CA, Perrimon N. 2006. Evidence that stem cells reside in the adult Drosophila midgut epithelium. Nature 439:475–479. 10.1038/nature04371 [DOI] [PubMed] [Google Scholar]
- 41. Ohshiro T, Yagami T, Zhang C, Matsuzaki F. 2000. Role of cortical tumour-suppressor proteins in asymmetric division of Drosophila neuroblast. Nature 408:593–596. 10.1038/35046087 [DOI] [PubMed] [Google Scholar]
- 42. Romeo Y, Lemaitre B. 2008. Drosophila immunity: methods for monitoring the activity of Toll and Imd signaling pathways. Methods Mol. Biol. 415:379–394. 10.1007/978-1-59745-570-1_22 [DOI] [PubMed] [Google Scholar]
- 43. Agaisse H, Petersen UM, Boutros M, Mathey-Prevot B, Perrimon N. 2003. Signaling role of hemocytes in Drosophila JAK/STAT-dependent response to septic injury. Dev. Cell 5:441–450. 10.1016/S1534-5807(03)00244-2 [DOI] [PubMed] [Google Scholar]
- 44. Broderick NA, Raffa KF, Goodman RM, Handelsman J. 2004. Census of the bacterial community of the gypsy moth larval midgut by using culturing and culture-independent methods. Appl. Environ. Microbiol. 70:293–300. 10.1128/AEM.70.1.293-300.2004 [DOI] [PMC free article] [PubMed] [Google Scholar]
Associated Data
This section collects any data citations, data availability statements, or supplementary materials included in this article.
Supplementary Materials
Aspects that contribute to high interfly variability of D. melanogaster gut-associated bacteria. (A) Counts of bacteria (CFUs) isolated from individual guts of aged (35 to 40 days old) conventionalized flies (CV). Three replicates of 25 female flies were established per genotype. Young (2 to 4 days old) axenically reared (AX) flies were placed in vials of sterile food, to which 105 cells (each) of L. plantarum (Lp), L. brevis (Lb), and A. pasteurianus (Ap) had been added and allowed to dry. Vials were flipped every 3 days until sampling, when individual guts were dissected and plated for bacterial enumeration. Two wild-type lines (OregonR and CantonS) and two immune-deficient lines (RelishE20 and Imd1) were assayed. (B) Profiles of the composition and proportion of microbiota members in individual conventionalized flies from panel A. Five randomly selected individuals of OregonR from each reassociation cohort are shown. The proportion of each species isolated from individual guts is shown. (C) Experimental designs of assays to test impact of aging and transmission of microbiota to F1. For F0 (D1), cohorts of 25 2-day-old female flies were collected, 5 of which were dissected for time 0 bacterial counts. The remaining 20 flies were housed together in vials and flipped onto new media every 4 days. At each sample time point, 5 females per replicate were removed, dissected, and plated to analyze individual CFU counts per gut. For F1 (D2), the vial that housed flies on days 12 to 16 was kept to examine the progeny. Emerging F1 flies were collected at different time points (12, 24, 48, and 72 h) posteclosion and transfered to new vials. Cohorts of flies were transferred to new vials every 4 days, and flies were dissected at 30 to 35 days old to enumerate bacterial density and composition. (D1) CFU counts from individual guts of F0 conventionally reared flies over time. Individual flies were dissected and plated to determine the composition and density of the microbiota. (D2) The length of time that cohorts of flies spent posteclosion (12, 24, 48, or 72 h) in the vials they emerged from did not impact counts of bacteria in individual guts. (E) Effect of starvation of culturable bacterial counts from the gut of individual flies. Shifting flies onto water agar led to significant decreases in culturable bacteria after 2 h, and counts continued to decline through 8 h. Culturable bacterium counts stabilize when flies are returned to sterile medium. (F) The high interfly variability observed in female adult flies is not observed in larvae. (G) Representative histological section of live (green)/dead (red) staining of D. melanogaster gut microbiota. Due to the nonspecific green signal from dead yeast in the food, DAPI staining was included. Due to its staining of all DNA, we were able to reveal both host enterocyte nuclei within the epithelium (large blue nuclei) as well dead (purple) and living (blue/green) bacterial cells. Scale bar = 20 µm. Download
Confirmation of microarray by RT-qPCR and transgene expression. (A) Expression levels of selected genes in guts of axenic (OrX) and conventionally reared (OrNX) flies. RT-qPCR was performed with total RNA extracts from three biological replicates of 30 guts of 4- to 7-day-old flies. This experiment confirmed that the expression of antimicrobial peptide genes (Dpt, AttB, and AttD), amidase PGRPs (PGRP-SC1 and PGRP-LB); components of the JAK-STAT (upd3 and sosc36E), EGFR (Vein, Keren, and Argos), JNK (Puc), and Notch pathways, as well as the antioxidant (GstD5) and insulin receptor (InR), were reduced in the absence of microbiota. In contrast, the level of prospero was higher in the gut of axenic flies. (B and C) Representative images of Diptericin-lacZ (B) or Upd3-GFP (C) expression in the guts of conventionally or axenically reared flies. Scale bars = 500 µm. Bright-field (B) or two-channel (GFP and DAPI) (C) images were acquired at magnification 10× using an Axioplot imager (Zeiss). The full gut images were recomposed from the overlapping tile images using the program MosaiX (Zeiss). The stitched composite image was then processed to correct for shading differences across the individual tiles. Download
Expression profile of the core set of genes altered by microbiota in the gut of Drosophila; genes showing a fold change (upregulated by ≥1.3; downregulated by ≤1.3) in the guts of both OregonR and CantonS young flies (4 to 6 days old); fold changes for each wild type are indicated; fold changes for CantonS old flies (35 to 40 days old) are shown for comparison; in the ‘‘DIRG’’ column, ‘‘+’’ indicates genes previously identified as upregulated in whole flies upon septic injury with a mixture of E. coli and Micrococcus luteus (20); the column ‘‘GIRG” shows genes that were also upregulated in the gut upon ingestion of Ecc15 (19).
Impact of the immune deficiency pathway on expression of genes altered by microbiota; complete list of genes showing a fold change (upregulated by ≥1.3, downregulated by ≤1.3) in the guts of OregonR young flies (4 to 6 days old) and the impact of the Imd pathway (guts from 4- to 6-day-old RelishE20 flies) on their expression
Impact of aging on genes upregulated by microbiota; genes upregulated by microbiota (≥1.3-fold) specifically in the guts of young (4 to 6 days old) or old (35 to 40 days old) flies and those shared between both young and old CantonS flies; fold changes for each gene at both ages are indicated
Impact of aging on genes downregulated by microbiota; genes downregulated by microbiota (≤1.3-fold) specifically in the guts of young (4 to 6 days old) or old (35 to 40 days old) flies and those shared between both young and old CantonS flies; fold changes for each gene at both ages are indicated
Microbiota-altered genes shared between young OregonR and old CantonS flies; genes that were regulated by microbiota in the guts of young OregonR (4 to 6 days old) and old CantonS (35 to 40 days old) flies but were not altered in CantonS young flies; fold changes for young OregonR and old CantonS flies, as well as young CantonS flies, are shown for comparison
Microbiota-altered genes in nongut tissues; genes that were regulated by microbiota and their fold changes in nongut tissues of young (4 to 6 days old) CantonS flies; genes are listed in order of expression level; bolded genes were specifically altered in nongut tissues, while other genes were altered in both gut and nongut tissues; in the ‘‘DIRG’’ column, ‘‘+’’ indicates genes previously identified as upregulated in whole flies upon septic injury with a mixture of E. coli and M. luteus (20); the column ‘‘GIRG” shows genes that were also upregulated in the gut upon ingestion of Ecc15 (19).