

Abstract
Quantitative NMR-based metabolite profiling is challenged by the deleterious effects of abundant proteins in the intact blood plasma/serum, which underscores the need for alternative approaches. Protein removal by ultrafiltration using low molecular weight cutoff filters thus represents an important step. However, protein precipitation, an alternative and simple approach for protein removal, lacks detailed quantitative assessment for use in NMR based metabolomics. In this study, we have comprehensively evaluated the performance of protein precipitation using methanol, acetonitrile, perchloric acid, and trichloroacetic acid and ultrafiltration approaches using 1D and 2D NMR, based on the identification and absolute quantitation of 44 human blood metabolites, including a few identified for the first time in the NMR spectra of human serum. We also investigated the use of a “smart isotope tag,” 15N-cholamine for further resolution enhancement, which resulted in the detection of a number of additional metabolites. 1H NMR of both protein precipitated and ultrafiltered serum detected all 44 metabolites with comparable reproducibility (average CV, 3.7% for precipitation; 3.6% for filtration). However, nearly half of the quantified metabolites in ultrafiltered serum exhibited 10–74% lower concentrations; specifically, tryptophan, benzoate, and 2-oxoisocaproate showed much lower concentrations compared to protein precipitated serum. These results indicate that protein precipitation using methanol offers a reliable approach for routine NMR-based metabolomics of human blood serum/plasma and should be considered as an alternative to ultrafiltration. Importantly, protein precipitation, which is commonly used by mass spectrometry (MS), promises avenues for direct comparison and correlation of metabolite data obtained from the two analytical platforms to exploit their combined strength in the metabolomics of blood.
Metabolomics has experienced tremendous growth over the past decade, with currently more than 1500 papers published annually that range from methods development to applications in many areas. The promise of improving early disease diagnosis and understanding the molecular basis of diseases, the effects of drugs, toxins, and environments and etc. have provided a strong driving force in the field.1−6 Nuclear magnetic resonance (NMR) spectroscopy and mass spectrometry (MS) are the two most widely used analytical platforms for metabolic profiling of biological specimens including blood, urine, bile, cerebrospinal fluid, and biopsied or surgical tissue, as well as cells. Specifically, owing to its potential clinical utility combined with the minimal invasiveness for diagnosing and managing human diseases, the study of blood serum/plasma has been a focus of many studies in metabolomics.
However, two major challenges faced in many metabolomics studies are first, the data for the same or similar samples are often not directly comparable between NMR and MS. The inability to compare and correlate data from the two commonly used analytical platforms is a major bottleneck for biomarker discovery as well as for exploiting the combined strength of the two analytical platforms for objectives such as unknown metabolite identification. A major difference in NMR and MS-based metabolic profiling of serum/plasma stems from the general approach used for each platform to alleviate the interference of copious proteins (60–80 g/L) invariably present in blood.7 Prior to analysis by MS, proteins are generally removed by precipitation using an organic solvent such as methanol, acetonitrile, or a mixture of solvents.7−14 However, for NMR analysis, protein interference is often alleviated by suppressing their signals based on their short T2 relaxation times using the Carr–Purcell–Meiboom–Gill (CPMG) experiment.15 The limitation of this approach is that many metabolites that bind to serum/plasma proteins make them either invisible or significantly attenuated in the resulting NMR spectra. The attenuation of a number of metabolites such as lactate, histidine, tyrosine, and phenylalanine has thus been described earlier using NMR of intact blood serum/plasma.16−18 Second, there is an increased interest and need for more reliable methodologies and, in particular, absolute quantitation based approaches. To avoid the deleterious effects of the attenuation of metabolite concentrations, the vast majority of the NMR studies of intact blood serum/plasma have been based on comparison of the relative peak intensities between different groups of samples. Toward this goal, the removal of proteins from serum/plasma by ultrafiltration using low molecular weight cutoff filters represents an important step, which greatly alleviates the peak attenuation problem and offers an avenue for absolute metabolite quantitation.19−21 An alternative and a more simple approach, protein precipitation, which is widely used in MS, has also been explored and compared qualitatively with ultrafiltration.22,23 However, a comprehensive evaluation of protein precipitation and ultrafiltration approaches with regard to the absolute quantitation of metabolites using NMR is currently lacking.
In this study, we have comprehensively evaluated the performance of protein precipitation and ultrafiltration approaches using 1D and 2D NMR, based on exhaustive identification and absolute quantitation of human blood metabolites. The results indicate that while the numbers of metabolite detected by both protein precipitation and ultrafiltration are similar, the latter method exhibits a significant attenuation for nearly half of the quantified metabolites. We also evaluated the two methods using a “smart isotope tag,” 15N-cholamine.24 The obtained results, combined with the fact that MS extensively uses protein precipitation, suggest that protein precipitation for NMR-based metabolomics may provide good quantitative capabilities as well as avenues for effective comparison and correlation of data derived from the two complementary analytical methods.
Materials and Methods
Methanol, acetonitrile, perchloric acid (PCA), trichloroacetic acid (TCA), hydrochloric acid (HCl), sodium hydroxide (NaOH), (2-bromoethyl) trimethylammonium bromide, dimethylformamide (DMF), 3-(trimethylsilyl)propionic acid-2,2,3,3-d4 sodium salt (TSP) were all obtained from Sigma-Aldrich (St. Louis, MO). 4-(4,6-Dimethoxy[1,3,5]triazin-2-yl)-4-methylmorpholinium chloride (DMTMM) was obtained from Acros Organic (Pittsburgh, PA), while 15N-phthalimide potassium and deuterium oxide were obtained from Cambridge Isotope Laboratories (Andover, MA). All chemicals were used without further purification. Pooled human serum sample was obtained from Innovative Research, Inc. (Novi, MI). Deionized (DI) water was purified using an in-house Synergy Ultrapure Water System from Millipore (Billerica, MA). Centrifugal filters (3-kDa cutoff; Amicon Microcon, YM-3) were purchased from Sigma-Aldrich.
Standard compounds used for spiking and confirming the peak assignments were 1-methylhistidine, 2-hydroxybutyrate, 2-hydroxyisocaproate, 2-hydroxyisovalerate, 2-oxocaproate, 3-methylbutyrate, 3-methylhistidine, 3-methyl-2-oxobutanoate, arginine, benzoate, betaine, carnitine, citrulline, dimethylglycine, pyridoxine, pyroglutamate, ornithine, sarcosine, serine and succinate (all from Sigma-Aldrich).
Sample Preparations for NMR
A total of 20 aliquots (300 μL each) from the same pooled serum sample were used in this study, along with two blank samples used to test for any contaminants from the filter membrane (see Table 1). All experiments comparing the results of ultracentrifugation, precipitation, and intact serum used identical experimental conditions for NMR spectroscopy and were performed in duplicate.
Table 1. Pooled Human Serum and Blank Samples Used in the Study.
| method | NMR experiment | number |
|---|---|---|
| ultrafiltration-serum | 1H 1D NMR (filtrate dried) | 2 |
| 1H 1D NMR (filtrate not dried) | 2 | |
| 15N-cholamine tagging and 2D NMR | 2 | |
| methanol precipitation | 1H 1D NMR | 2 |
| 15N-cholamine tagging and 2D NMR | 2 | |
| multiple (3-fold) methanol precipitation | 1H 1D NMR | 2 |
| intact serum | 1H 1D NMR | 2 |
| acetonitrile precipitation | 1H 1D NMR | 2 |
| perchloric acid precipitation | 1H 1D NMR | 2 |
| trichloroacetic acid precipitation | 1H 1D NMR | 2 |
| ultrafiltration-blank | 1H 1D NMR | 2 |
Ultrafiltration
The centrifugal filters were washed with water and centrifuged thrice with 300 mL of water at 11 000 rpm for 20 min each time. Six 300 μL serum samples were transferred to filter tubes and centrifuged for 20 min at 11 000 rpm. Filtrate from two samples were measured and mixed separately with a 100 μL solution of phosphate buffer (100 mM) in D2O containing 66.17 μM TSP. The solutions were then made up to 550 μL with the phosphate buffer in D2O and transferred to 5 mm NMR tubes. Filtrate from four samples were dried, two of these used for 1H 1D NMR and the other two for detecting carboxyl containing metabolites after smart isotope tagging with 15N-cholamine, as described below and in ref (24). In addition, two blank samples were prepared via ultrafiltration in an identical manner to the nondried serum samples.
Protein Precipitation Using Methanol
Four 300 μL serum samples were mixed with methanol in a 1:2 ratio (v/v), vortexed, and incubated at −20 °C for 20 min. The mixtures were centrifuged at 11 000 rpm for 30 min to pellet proteins. Supernatants were decanted to fresh vials and dried. Two were used for 1H 1D NMR and the other two samples were used for detecting carboxyl class of metabolites after tagging with 15N-cholamine.24 In addition, two serum samples were processed with methanol precipitation as described above, the metabolite extraction was repeated three times using a methanol and water mixture (2:1), pooled the supernatants, and then dried.
Protein Precipitation Using Acetonitrile
Two 300 μL serum samples were mixed with acetonitrile in a 1:2 ratio (v/v), vortexed, and incubated at −20 °C for 20 min. The mixtures were centrifuged at 11 000 rpm for 30 min to pellet proteins. Supernatants were decanted to fresh vials and dried.
Protein Precipitation Using Perchloric Acid
Two 300 μL serum samples were cooled in an ice bath and mixed with perchloric acid (30 μL; 4 M),22 vortexed, and kept aside for 10 min, then centrifuged at 11 000 rpm for 30 min to pellet proteins. Supernatants were decanted to fresh vials and dried. The residue was washed thrice using 500 μL of deionized water each time and dried.25
Protein Precipitation Using Trichloroacetic Acid
Two 300 μL serum samples were cooled in an ice bath and mixed with ice-cold trichloroacetic acid (10 μL; 10%), vortexed, and kept aside for 10 min, then centrifuged at 11 000 rpm for 30 min to pellet proteins. Supernatants were decanted to fresh vials and dried. The residue was washed thrice using 500 μL of deionized water each time and dried.25
The dried samples from each protein removal method were mixed with 100 μL solution of phosphate buffer (100 mM) in D2O containing 66.17 μM TSP, made up to 550 μL with phosphate buffer in D2O and transferred to 5 mm NMR tubes.
Solutions of Intact Serum
Two 300 μL serum samples were made up to 550 μL with phosphate buffer in D2O and transferred to 5 mm NMR tubes for direct analysis.
Metabolite Tagging with the “Smart Isotope Tag” 15N-Cholamine
Carboxyl group containing metabolites in both the ultrafiltered and protein precipitated serum samples were tagged with 15N-cholamine. 15N-Cholamine was synthesized using a two-step reaction following the protocol described in the Supporting Information and in greater detail in a recent publication from our laboratory.24 Briefly, 15N-cholamine (3 mg, 30 μmol) was added to 250 μL of sample in an Eppendorf tube and the pH adjusted to 7.0 with 1 M HCl or NaOH. DMTMM (15 mg) was then added to initiate the reaction.26 The mixtures were stirred at room temperature for 4 h to complete the reaction. To maintain amide protonation, the pH was adjusted to 5.0 by adding 1 N HCl or 1 N NaOH, a 10 μL D2O solution containing 0.2 mM TSP was added and the resulting solutions were transferred to a 3 mm tube for NMR detection of the isotope labeled metabolites.
NMR Spectroscopy
All NMR experiments were performed at 298 K on a Bruker Avance III 800 MHz spectrometer equipped with a cryoprobe and Z-gradients suitable for inverse detection. The one-pulse sequence or nuclear Overhauser effect spectroscopy (NOESY) and CPMG (Carr–Purcell–Meiboom–Gill) pulse sequences with water suppression using presaturation were used for 1H 1D NMR experiments. The quantitative comparison between samples was made using CPMG. Homonuclear two-dimensional (2D) experiments such as 1H–1H double quantum filtered correlation spectroscopy (DQF-COSY) and 1H–1H total correlation spectroscopy (TOCSY) experiments were performed for both ultrafiltered and protein precipitated serum samples using methanol to aid in peak assignment. The 2D experiments were performed with suppression of residual water signal by presaturation during the relaxation delay. For DQF-COSY and TOCSY, sweep widths of 9600 Hz were used in both dimensions; 512 or 400 free induction decays (FIDs) were obtained with t1 increments for DQF-COSY or TOCSY, respectively, each with 2048 complex data points. The number of transients used was 16 and the relaxation delays were 2.0 s for DQF-COSY and 1.5 s for TOCSY. Sensitivity-enhanced 1H–15N 2D HSQC experiments for isotope labeled samples employed an INEPT transfer delay of 6 ms corresponding to the 1JNH coupling of 90 Hz. Spectral widths for the 1H and 15N dimensions were approximately 8 kHz and 3 kHz, respectively. A total of 128 FIDs of 1 024 data points each were collected in the indirect dimension with 16 or 128 transients per increment. Nitrogen decoupling during the direct acquisition dimension was achieved with the Globally Optimized Alternating-Phase Rectangular Pulses (GARP) sequence. The resulting 2D data were zero-filled to 2 048 in the t2 and 1 024 points in the t1 dimension after forward linear prediction to 256 or 512 points. For all 2D spectra, a 45° or 90° shifted squared sine-bell window function was applied to both dimensions before Fourier transformation. Chemical shifts were referenced to the TSP signal for 1H 1D or 2D spectra or the derivatized formic acid signal (1H, 8.05 ppm; 15N, 123.93 ppm) in HSQC spectra for isotope labeled samples. Bruker Topspin versions 3.0 or 3.1 software packages were used for NMR data acquisition, processing, and analyses.
Peak Assignment and Metabolite Quantitation
Chenomx NMR Suite Professional Software package (version 5.1; Chenomx Inc., Edmonton, Alberta, Canada) was used for quantitation of metabolites using CPMG 1D NMR spectra. The software allows fitting spectral lines using the standard metabolite library for 800 MHz 1H NMR spectra. Since the Chenomx software often provides multiple library hits for many metabolite peaks, the correct and exhaustive peak assignments were made based on the combination of expected number of peaks, multiplet patterns, assignments of 2D DQF-COSY and TOCSY spectra, and spiking with authentic standard compounds. Peak fitting with reference to the internal TSP signal enabled determination of absolute concentrations for all identified metabolites.
Results and Discussion
1H NMR spectra of both ultrafiltered and protein precipitated serum provided well resolved peaks and allowed the detection of significantly higher numbers of metabolites compared to the spectra of intact serum. A total of 44 metabolites were identified in the 1D spectra of both ultrafiltered and protein precipitated serum. Figure 1 shows a typical 1H CPMG spectrum of protein precipitated serum along with annotations for the 44 identified metabolites in the expanded regions. Qualitatively, identical spectra were obtained for ultrafiltered as well as protein precipitated serum using methanol, both obtained under identical conditions, after drying the solvent and reconstituting in D2O buffer. Both approaches detected all 44 metabolites with comparable reproducibility (average CV, 3.7% for precipitation; 3.6% for filtration). Quantitatively, however, many metabolite peaks were significantly attenuated in intensity in the ultrafiltered serum compared to protein precipitated serum (see Figures 2 and 3, for example). Chenomx software, which is known to provide excellent concentration accuracies, was used to obtain absolute metabolite concentrations and the results are shown in Table 2. Spiking experiments using authentic compounds were used to confirm the identity of peaks wherever there was overlap such as for arginine and serine (see Figure S1 in the Supporting Information). As seen in Table 2, nearly half of the quantified metabolites exhibited lower concentrations in ultrafiltered serum by 10 to 74%, with metabolites such as tryptophan, benzoate, and 2-oxoisocaproate showing nearly 3- to 4-fold lower concentrations compared to protein precipitated serum. Two metabolites, citrate and glycerol, showed significantly higher concentrations and lactate had marginally higher concentration in ultrafiltered serum (Table 2). Investigations of blank samples for ultrafiltration revealed that the filter membrane contributed to glycerol and lactate apart from methanol and an unidentified peak as predominant contaminants (see Figure S2 in the Supporting Information). The undesirable contribution of glycerol associated with the membrane in the centrifugal filters has been reported earlier.21
Figure 1.

(a) Typical 800 MHz (cryo-probe) 1D CPMG 1H NMR spectrum of a pooled human serum after protein precipitation using methanol with expanded regions and (b–h) annotations for the 44 metabolites.
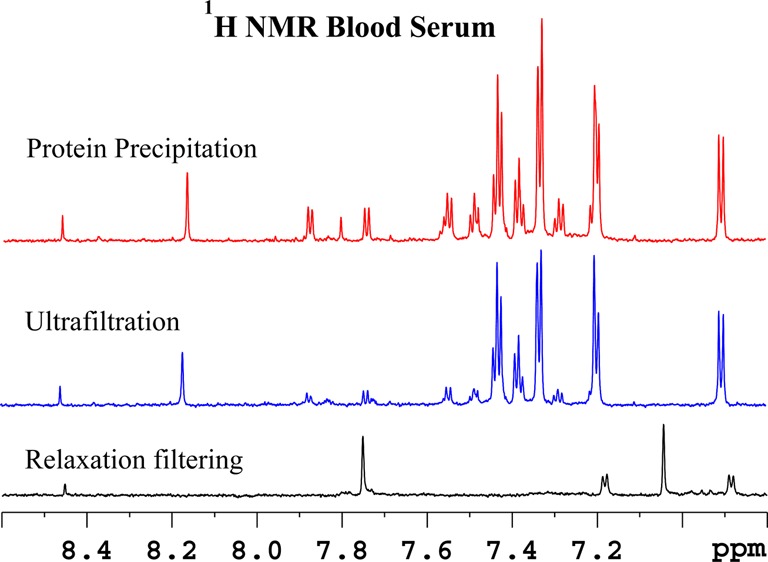
Figure 2.
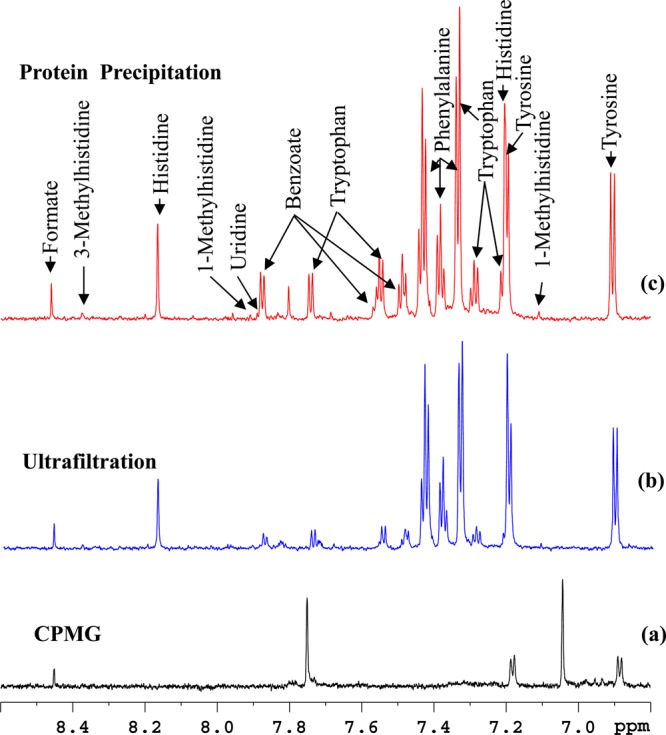
Comparison of the aromatic region of 800 MHz, cryo-probe 1H NMR spectra of the same pooled human serum sample obtained by suppressing protein signals (a) by T2 filtering using the CPMG pulse sequence, (b) by ultrafiltration using a 3 kDa molecular weight cutoff filter, and (c) by protein precipitation using methanol (1:2). Most of the metabolite signals in the displayed region are missing or significantly attenuated in the T2 filtered spectrum and many including tryptophan, benzoate, and formate were significantly attenuated in ultrafiltered serum compared to the protein precipitated serum.
Figure 3.
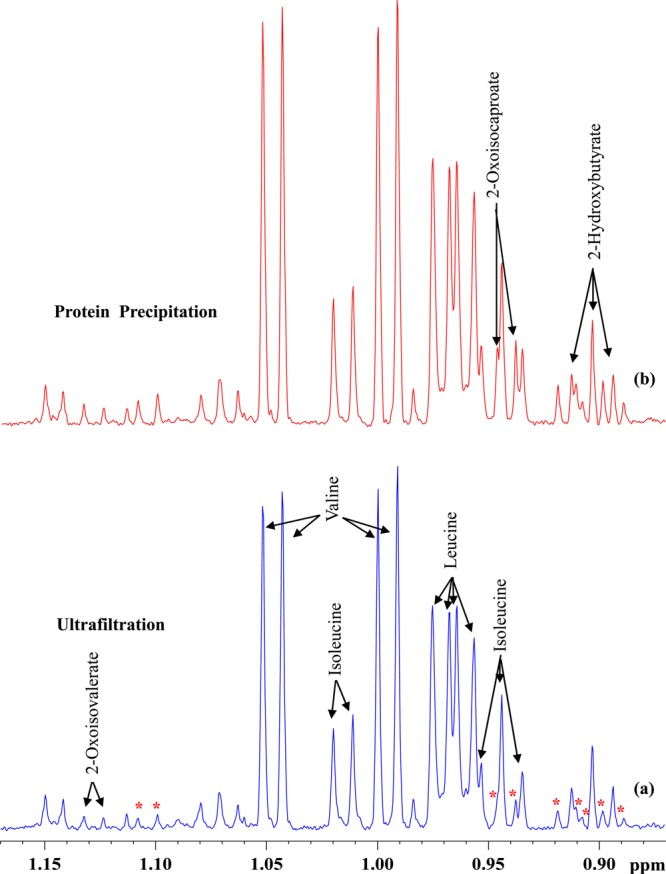
Comparison of a portion of 800 MHz, cryo-probe 1H NMR spectra of the same pooled human serum sample obtained by suppressing protein signals (a) by ultrafiltration using 3 kDa cutoff filter and (b) by protein precipitation using methanol (1:2). Note the peaks marked with asterisks are attenuated significantly in part a compared to part b. Of these, the identity for one metabolite (2-oxoisocaproate) was established in this study and the others are unidentified.
Table 2. Metabolite Concentrations from Pooled Human Serum Determined by 1D 1H NMR after Protein Removal by Protein Precipitation or Ultrafiltrationa.
| metabolite | protein precipitation | ultrafiltration | fold change between protein precipitation and ultrafiltrationb |
|---|---|---|---|
| 1-methylhistidine | 4.6 ± 0.2 (4.6) | 4.9 ± 0.4 (8.9) | 0.94 |
| 2-hydroxybutyrate | 31.9 ± 0.6 (2.1) | 31.5 ± 2.1 (6.9) | 1.01 |
| 2-hydroxyisovalerate | 13.0 ± 0.3 (2.7) | 9.8 ± 1.8 (1.8) | 1.32 |
| 2-oxoisocaproate | 16.3 ± 0.2 (1.8) | 5.0 ± 0.2 (3.6) | 3.26 |
| 2-oxoisovalerate | 3.0 ± 0.1 (3.4) | 3.2 ± 0.2 (7.9) | 0.94 |
| 3-hydroxybutyrate | 91.7 ± 3.2 (3.6) | 91.5 ± 0.9 (1.0) | 1.00 |
| 3-methylhistidine | 4.8 ± 0.1 (1.3) | 4.7 ± 0.4 (9.8) | 1.02 |
| acetate | 244.5 ± 20.1 (8.2) | 149.6 ± 2.5 (4.2) | 1.63 |
| alanine | 349.1 ± 23.0 (6.6) | 331.4 ± 2.4 (0.7) | 1.05 |
| arginine | 125.2 ± 0.3 (0.3) | 105.7 ± 2.8 (2.7) | 1.18 |
| asparagine | 51.5 ± 4.0 (7.8) | 51.0 ± 0.2 (0.4) | 1.01 |
| aspartate | 41.3 ± 1.9 (4.7) | 40.2 ± 1.4 (3.6) | 1.03 |
| benzoate | 36.2 ± 2.1 (5.8) | 9.6 ± 0.5 (5.7) | 3.77 |
| betaine | 48.4 ± 1.6 (3.3) | 47.1 ± 2.8 (6.1) | 1.03 |
| carnitine | 34.0 ± 2.9 (8.6) | 31.6 ± 0.2 (0.6) | 1.08 |
| choline | 129.5 ± 0.5 (0.5) | 104.5 ± 1.2 (1.2) | 1.24 |
| citrate | 26.7 ± 1.5 (5.8) | 44.0 ± 0.4 (0.8) | 0.61 |
| creatine | 31.4 ± 2.1 (6.9) | 28.3 ± 0.2 (0.6) | 1.11 |
| creatinine | 79.7 ± 5.9 (7.4) | 76.1 ± 0.2 (0.2) | 1.05 |
| formate | 23.7 ± 0.9 (4.0) | 18.9 ± 1.8 (9.6) | 1.25 |
| glucose | 4713.1 ± 219.6 (4.7) | 4251.8 ± 106.5 (2.5) | 1.11 |
| glutamate | 334.7 ± 5.4 (1.6) | 338.4 ± 0.7 (0.2) | 0.99 |
| glutamine | 204.0 ± 9.9 (4.9) | 202.2 ± 10.6 (5.3) | 1.01 |
| glycerol | 205.8 ± 5.9 (2.9) | 286.8 ± 8.3 (2.9) | 0.72 |
| glycine | 458.7 ± 19.9 (4.3) | 411.0 ± 11.0 (2.7) | 1.12 |
| histidine | 75.0 ± 2.4 (3.3) | 80.9 ± 6.3 (7.8) | 0.93 |
| isoleucine | 62.6 ± 2.9 (4.7) | 54.2 ± 1.1 (2.0) | 1.15 |
| lactate | 3242.2 ± 169.2 (5.2) | 3365.2 ± 341.8 (10.2) | 0.96 |
| leucine | 137.8 ± 1.6 (1.2) | 125.7 ± 4.9 (3.9) | 1.10 |
| lysine | 140.3 ± 5.1 (3.7) | 123.0 ± 7.5 (6.2) | 1.14 |
| mannose | 61.6 ± 0.4 (0.7) | 56.3 ± 1.4 (2.6) | 1.09 |
| methionine | 29.2 ± 1.7 (6.0) | 26.0 ± 0.5 (2.1) | 1.12 |
| dimethylglycine | 3.0 ± 0.1 (2.9) | 3.2 ± 0.2 (5.7) | 0.95 |
| ornithine | 36.8 ± 1.2 (3.5) | 35.6 ± 2.5 (7.1) | 1.03 |
| phenylalanine | 145.2 ± 1.4 (1.0) | 125.7 ± 4.1 (3.3) | 1.15 |
| proline | 227.6 ± 1.5 (0.7) | 215.4 ± 1.4 (0.7) | 1.06 |
| pyroglutamate | 192.8 ± 5.3 (2.8) | 215.2 ± 2.9 (1.4) | 0.90 |
| sarcosine | 2.1 ± 0.03 (1.3) | 1.5 ± 0.09 (6.1) | 1.40 |
| serine | 126.4 ± 2.1 (1.7) | 116.1 ± 0.4 (0.3) | 1.09 |
| threonine | 197.6 ± 7.2 (3.7) | 173.2 ± 3.2 (1.9) | 1.14 |
| tryptophan | 63.2 ± 2.4 (3.8) | 23.2 ± 0.2 (0.8) | 2.73 |
| tyrosine | 77.9 ± 3.7 (4.8) | 69.8 ± 1.1 (1.6) | 1.11 |
| uridine | 3.8 ± 0.07 (2.0) | 2.9 ± 0.2 (6.1) | 1.30 |
| valine | 174.0 ± 4.6 (2.7) | 153.2 ± 3.2 (2.1) | 1.14 |
Measured values are in micromolar with CV indicated in parentheses.
Values >1 indicates higher and <1 lower in protein precipitation method compared to ultrafiltration.
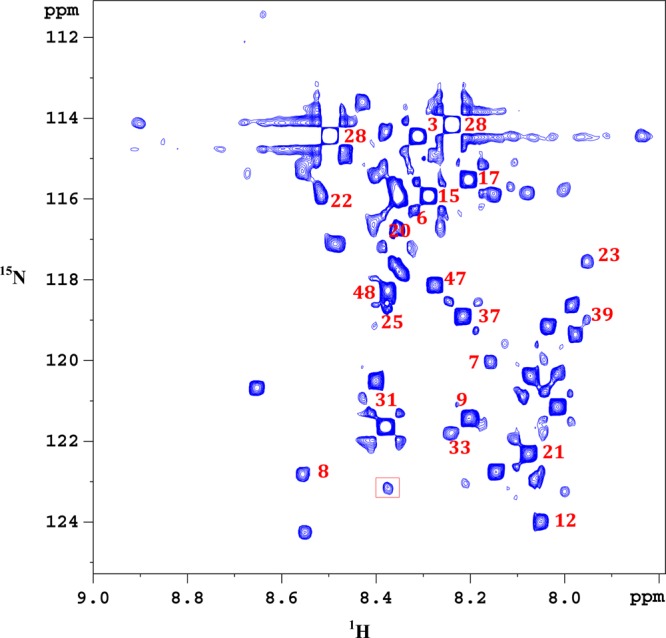
Considering the fact that isotope enhanced NMR enables access to additional low concentration metabolites,24,26 carboxyl group containing metabolites in both protein precipitated and ultrafiltered serum were tagged using the 15N-cholamine smart tag,24 and the 1H–15N 2D HSQC spectra were evaluated. Figures 4 and 5 show typical spectra showing 2D NMR peaks for 15N-labeled carboxyl group containing metabolites in the protein precipitated and ultrafiltered serum, respectively. For easy visualization, the vertical scales for the 2D spectra in Figures 4 and 5 are matched based on metabolite peaks, whose concentrations were comparable in protein precipitated and ultrafiltered serum as shown in Table 2. Clearly, in accordance with the results for 1D NMR spectra, 15 additional peaks were observed in protein precipitated serum as indicated by square boxes (Figure 4). However, only one additional peak was observed in the ultrafiltered serum (indicated by square box in Figure 5). These additional peaks were either completely missing or too weak in intensity in one of the spectra. Except for tryptophan (peak no. 46 in Figure 4), the identity for all other additional peaks is yet to be ascertained. Toward this end, over 25 carboxyl metabolites have so far been identified after the development of the 15N-cholamine tag, many of which are labeled in Figures 4 and 5. The chemical shift library for smart tagged standards is currently being enhanced to increase the pool of identified metabolites in the blood.
Figure 4.
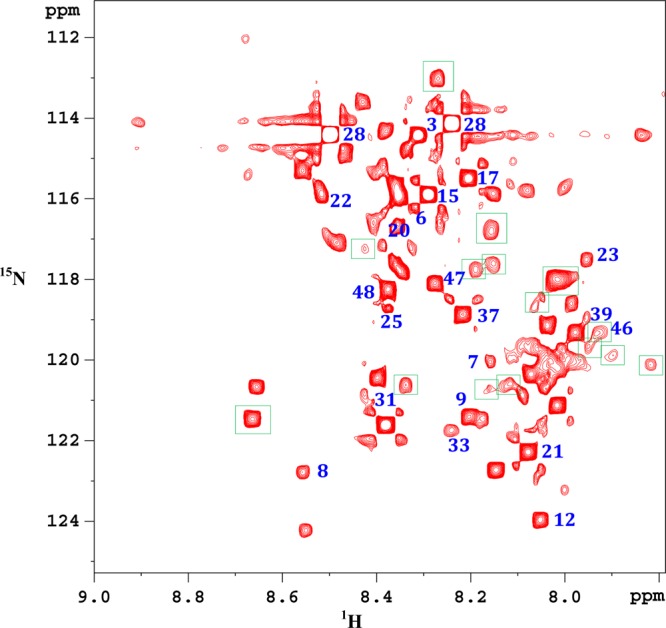
Portion of the 1H–15N HSQC 800 MHz cryo-probe spectrum of a pooled human serum metabolites extracted by protein precipitation using methanol and carboxyl group containing metabolites tagged with 15N-cholamine. Peaks enclosed within square boxes are missing in the ultrafiltered serum (see Figure 5). Identified metabolites: 3, alanine; 6, asparagine; 7, aspartic acid; 8, betaine; 9, citric acid; 12, formic acid; 15, glutamic acid; 17, glycine; 20, histidine; 21, 3-hydroxybutyric acid; 22, 4-hydroxyproline; 23, 2-hydroxyisobutyric acid; 25, isoleucine; 28, lactic acid; 31, maleic acid; 33, malonic acid; 39, propionic acid; 46, tryptophan; 48, valine.
Figure 5.
Portion of the 1H–15N HSQC 800 MHz cryo-probe spectrum of the same pooled human serum shown in Figure 4. Proteins are removed by ultrafiltration using a 3 kDa molecular weight cutoff filter and carboxyl group containing metabolites tagged with 15N-cholamine. The peak enclosed within the square box is missing in the protein precipitated serum (see Figure 4). Identified metabolites: 3, alanine; 6, asparagine; 7, aspartic acid; 8, betaine; 9, citric acid; 12, formic acid; 15, glutamic acid; 17, glycine; 20, histidine; 21, 3-hydroxybutyric acid; 22, 4-hydroxyproline; 23, 2-hydroxyisobutyric acid; 25, isoleucine; 28, lactic acid; 31, maleic acid; 33, malonic acid; 39, propionic acid; 48, valine.
Investigation of protein precipitation using other solvents indicated that methanol was the best choice. Precipitation using acetonitrile retains residual macromolecular signals which interfere in metabolite quantitation using the 1D ZGPR or NOESY pulse sequence (see Figure S3 in the Supporting Information), apart from attenuating many metabolites such as lactate, lysine, asparagine, and aspartate by 18–21% compared to precipitation using methanol. Protein precipitation using PCA and TCA deleteriously affected the integrity of serum metabolite profile/spectra and are therefore unsuitable for serum metabolite profiling (see Figure S3 in the Supporting Information), as similarly observed in earlier studies using NMR spectroscopy22 or mass spectrometry.27 Thus, the small residual macromolecules (∼2%) that remain after protein precipitation using methanol, in this study, necessitated the use of CPMG sequence to suppress the macromolecular signals for metabolite quantitation (see Figure S4 in the Supporting Information). We have demonstrated that use of the CPMG experiment, while provides a neat baseline compared to one pulse or 1D NOESY, only marginally affects the quantitative accuracy. As described previously28,29 and also depicted in Figure S5 in the Supporting Information, qualitatively, virtually identical spectra are obtained for CPMG and ZGPR sequences. A comparison of metabolite concentrations in the two experiments showed an underestimation in the CPMG experiment by an average of 4.6%; however, the flat baselines obtained with the CPMG made quantitation much easier for the smaller signals. Further, a marginal improvement in metabolite recovery (average concentration 3.9%) could be observed when multiple extractions were performed using methanol solvent. However, a downside of multiple extraction is that it increases the residual macromolecular concentration (see Figure S6 in the Supporting Information), which apart from distorting the baseline, contributes to attenuation of the reference compound, TSP, which is detrimental to accurate quantitation if not corrected suitably. For example, in our case, the apparent TSP concentration decreased by an average 3.8% in multiple extractions compared to single extraction, using methanol.
A vast majority of NMR-based metabolomics studies focused on blood utilize intact blood serum or plasma without the need for sample preparation or separation, an important characteristic that has drawn prominence for NMR-based metabolomics. Such analysis necessitates selective suppression of the abundant protein signals using relaxation editing NMR pulse sequences such as CPMG that exploit the shorter T2 relaxation times for protons in proteins. Although, protein signals are suppressed effectively, metabolites that bind to proteins also experience shorter T2 relaxation times and hence get suppressed completely or partially in the resulting NMR spectra.16−18 Therefore, intact serum/plasma NMR spectra erroneously represent concentrations for many metabolites that bind or interact with proteins and such spectra, while useful for comparative studies, are not useful for the determination of absolute metabolite concentrations or comparing NMR data with that obtained by mass spectrometry.
In the interest of obtaining reliable metabolite concentrations in blood using NMR, a number of explorations for alleviating protein interference have been made. Two approaches, protein precipitation using organic solvents and ultrafiltration, have been explored.22,23 However, a quantitative evaluation of these two approaches was not discussed. The quantitative evaluation made in this study clearly indicates that protein precipitation using methanol is an excellent approach for accurate quantitation of blood metabolites. Also, evidence from this study indicates that concentration levels for many metabolites that potentially associate with macromolecules or with the filter membrane are reduced (though not fully) in ultrafiltration process, leading to their underestimation by 10 to 74% (Table 2).
Considering that metabolite quantitation in blood is quite challenging, sample preparation has been the subject of many investigations for analysis using MS. Concomitantly, protein precipitation, which is extensively used in MS, has evolved in the last several years and optimized protocols are now available for routine analysis of blood metabolites.7−14,27 Protein precipitation disrupts protein binding and thus provides access to the measurement of total metabolite concentration more quantitatively. The other approach, ultrafiltration, which has also been investigated for MS applications in detail, shows a significant loss of hydrophobic metabolites due to the strong protein binding or adsorption to the membrane. As a result, far fewer (on the order of 40%) metabolites were detected in blood using ultrafiltration when compared to protein precipitation.14,30,31 The isotope tagged spectra in this study also show evidence of the reduced number of metabolites observed when using ultrafiltration.
As a result of the advancing metabolomics technologies, the detection of increasingly high numbers of metabolites is being reported and there is increased interest to exploit the combined strength of NMR and MS methods for unknown metabolite identification, biomarker discovery, and the direct comparison of vast amounts of metabolomics literature generated using the two powerful methods (see ref (24) and references therein). Therefore, combined with the inferences of this study that protein precipitation for NMR analysis offers reliable quantitative data, incorporation of serum/plasma protein precipitation for both NMR and MS detection opens avenues to exploit their combined strength in the metabolomics field.
In conclusion, the comprehensive analysis of blood serum metabolites by NMR using two different sample preparation methods was quantitatively evaluated based on the identification and quantitation of aqueous metabolites. Absolute concentrations for 44 metabolites were determined in both ultrafiltered and protein precipitated serum. Analysis by ultrafiltration causes attenuation in NMR peak intensity for nearly 50% of the identified metabolites when compared to the results obtained by protein precipitation using methanol. These results indicate that serum/plasma protein precipitation using methanol provides accurate results for metabolite concentrations and hence is potentially well suited for routine NMR based metabolomics studies. Further, considering the fact that protein precipitation is widely used in the MS analysis of blood serum/plasma, incorporation of protein precipitation for NMR provides a common approach for reliable metabolite quantitation as well as exploiting the combined strength of NMR and MS in metabolomics studies.
Acknowledgments
We acknowledge financial support from the NIH (National Institute of General Medical Sciences Grant 2R01GM085291).
Supporting Information Available
Additional information as noted in text. This material is available free of charge via the Internet at http://pubs.acs.org.
The authors declare the following competing financial interest(s): Daniel Raftery reports holding equity and an executive position at Matrix Bio, Inc.
Funding Statement
National Institutes of Health, United States
Supplementary Material
References
- Fan T. W.; Lane A. N. J. Biomol. NMR 2011, 493–4267–280. [DOI] [PMC free article] [PubMed] [Google Scholar]; Erratum in J. Biomol. NMR 2011, 49(3–4), 325. [Google Scholar]
- Nagana Gowda G. A.; Raftery D. Curr. Metabolomics 2013, 13227–240. [DOI] [PMC free article] [PubMed] [Google Scholar]
- Shah S. H.; Kraus W. E.; Newgard C. B. Circulation 2012, 12691110–1120. [DOI] [PMC free article] [PubMed] [Google Scholar]
- Gebregiworgis T.; Powers R. Comb. Chem. High Throughput Screen. 2012, 158595–610. [DOI] [PMC free article] [PubMed] [Google Scholar]
- Ellinger J. J.; Chylla R. A.; Ulrich E. L.; Markley J. L. Curr. Metabolomics 2013, 1128–40. [DOI] [PMC free article] [PubMed] [Google Scholar]
- Powers R. Expert Opin. Drug Discovery 2009, 4101077–1098. [DOI] [PMC free article] [PubMed] [Google Scholar]
- Vuckovic D. Anal. Bioanal. Chem. 2012, 40361523–1548. [DOI] [PubMed] [Google Scholar]
- Dunn W. B.; Broadhurst D.; Begley P.; Zelena E.; Francis-McIntyre S.; Anderson N.; Brown M.; Knowles J. D.; Halsall A.; Haselden J. N.; Nicholls A. W.; Wilson I. D.; Kell D. B.; Goodacre R. Nat. Protoc. 2011, 671060–1083. [DOI] [PubMed] [Google Scholar]
- Ivanisevic J.; Zhu Z. J.; Plate L.; Tautenhahn R.; Chen S.; O’Brien P. J.; Johnson C. H.; Marletta M. A.; Patti G. J.; Siuzdak G. Anal. Chem. 2013, 85146876–6884. [DOI] [PMC free article] [PubMed] [Google Scholar]
- Bruce S. J.; Tavazzi I.; Parisod V.; Rezzi S.; Kochhar S.; Guy P. A. Anal. Chem. 2009, 8193285–3296. [DOI] [PubMed] [Google Scholar]
- Jiye A.; Trygg J.; Gullberg J.; Johansson A. I.; Jonsson P.; Antti H.; Marklund S. L.; Moritz T. Anal. Chem. 2005, 77248086–8094. [DOI] [PubMed] [Google Scholar]
- Zelena E.; Dunn W. B.; Broadhurst D.; Francis-McIntyre S.; Carroll K. M.; Begley P.; O’Hagan S.; Knowles J. D.; Halsall A.; Wilson I. D.; Kell D. B. Anal. Chem. 2009, 8141357–1364. [DOI] [PubMed] [Google Scholar]
- Whiley L.; Godzien J.; Ruperez F. J.; Legido-Quigley C.; Barbas C. Anal. Chem. 2012, 84145992–5999. [DOI] [PubMed] [Google Scholar]
- Tulipani S.; Llorach R.; Urpi-Sarda M.; Andres-Lacueva C. Anal. Chem. 2013, 851341–348. [DOI] [PubMed] [Google Scholar]
- Beckonert O.; Keun H. C.; Ebbels T. M.; Bundy J.; Holmes E.; Lindon J. C.; Nicholson J. K. Nat. Protoc. 2007, 2112692–2703. [DOI] [PubMed] [Google Scholar]
- Nicholson J. K.; Gartland K. P. NMR Biomed. 1989, 2277–82. [DOI] [PubMed] [Google Scholar]
- Chatham J. C.; Forder J. R. Biochim. Biophys. Acta 1999, 14261177–184. [DOI] [PubMed] [Google Scholar]
- Bell J. D.; Brown J. C. C.; Kubal G.; Sadler P. J. FEBS Lett. 1988, 235, 81–86. [DOI] [PubMed] [Google Scholar]
- Wevers R. A.; Engelke U.; Heerschap A. Clin. Chem. 1994, 407 Pt 11245–1250. [PubMed] [Google Scholar]
- Mercier P.; Lewis M. J.; Chang D.; Baker D.; Wishart D. S. J. Biomol. NMR 2011, 493–4307–323. [DOI] [PubMed] [Google Scholar]
- Psychogios N.; Hau D. D.; Peng J.; Guo A. C.; Mandal R.; Bouatra S.; Sinelnikov I.; Krishnamurthy R.; Eisner R.; Gautam B.; Young N.; Xia J.; Knox C.; Dong E.; Huang P.; Hollander Z.; Pedersen T. L.; Smith S. R.; Bamforth F.; Greiner R.; McManus B.; Newman J. W.; Goodfriend T.; Wishart D. S. PLoS One 2011, 62e16957. [DOI] [PMC free article] [PubMed] [Google Scholar]
- Daykin C. A.; Foxall P. J.; Connor S. C.; Lindon J. C.; Nicholson J. K. Anal. Biochem. 2002, 3042220–230. [DOI] [PubMed] [Google Scholar]
- Tiziani S.; Emwas A. H.; Lodi A.; Ludwig C.; Bunce C. M.; Viant M. R.; Günther U. L. Anal. Biochem. 2008, 377116–23. [DOI] [PubMed] [Google Scholar]
- Tayyari F.; Nagana Gowda G. A.; Gu H.; Raftery D. Anal. Chem. 2013, 85188715–8721. [DOI] [PMC free article] [PubMed] [Google Scholar]
- Fan T. W. In The Handbook of Metabolomics, Methods in Pharmacology and Toxicology; Fan T. W., Higashi R. M., Lane A. N., Eds.; Springer: New York, 2012; pp 7–27. [Google Scholar]
- Ye T.; Mo H.; Shanaiah N.; Nagana Gowda G. A.; Zhang S.; Raftery D. Anal. Chem. 2009, 81124882–4888. [DOI] [PMC free article] [PubMed] [Google Scholar]
- Want E. J.; O’Maille G.; Smith C. A.; Brandon T. R.; Uritboonthai W.; Qin C.; Trauger S. A.; Siuzdak G. Anal. Chem. 2006, 783743–752. [DOI] [PubMed] [Google Scholar]
- Wei S.; Zhang J.; Liu L.; Ye T.; Nagana Gowda G. A.; Tayyari F.; Raftery D. Anal. Chem. 2011, 83207616–7623. [DOI] [PMC free article] [PubMed] [Google Scholar]
- Nagana Gowda G. A.; Tayyari F.; Ye T.; Suryani Y.; Wei S.; Shanaiah N.; Raftery D. Anal. Chem. 2010, 82218983–8990. [DOI] [PMC free article] [PubMed] [Google Scholar]
- Vuckovic D.; de Lannoy I.; Gien B.; Shirey R. E.; Sidisky L. M.; Dutta S.; Pawliszyn J. Angew. Chem., Int. Ed. 2011, 50, 5344–5348. [DOI] [PubMed] [Google Scholar]
- Vuckovic D.; Pawliszyn J. Anal. Chem. 2011, 8361944–1954. [DOI] [PubMed] [Google Scholar]
Associated Data
This section collects any data citations, data availability statements, or supplementary materials included in this article.