Abstract
Coherent anti-Stokes Raman scattering (CARS) microscopy is emerging as a powerful method for imaging materials and biological systems, partly because of its noninvasiveness and selective chemical sensitivity. However, its full potential for species-selective imaging is limited by a restricted spectral bandwidth. Recent increases in bandwidth are promising but still are not sufficient for the level of robust component discrimination that would be needed in a chemically complex milieu found, for example, in intracellular and extracellular environments. We demonstrate a truly broadband CARS imaging instrument that we use to acquire hyper-spectral images with vibrational spectra over a bandwidth of 2500 cm−1 with a resolution of 13 cm−1.
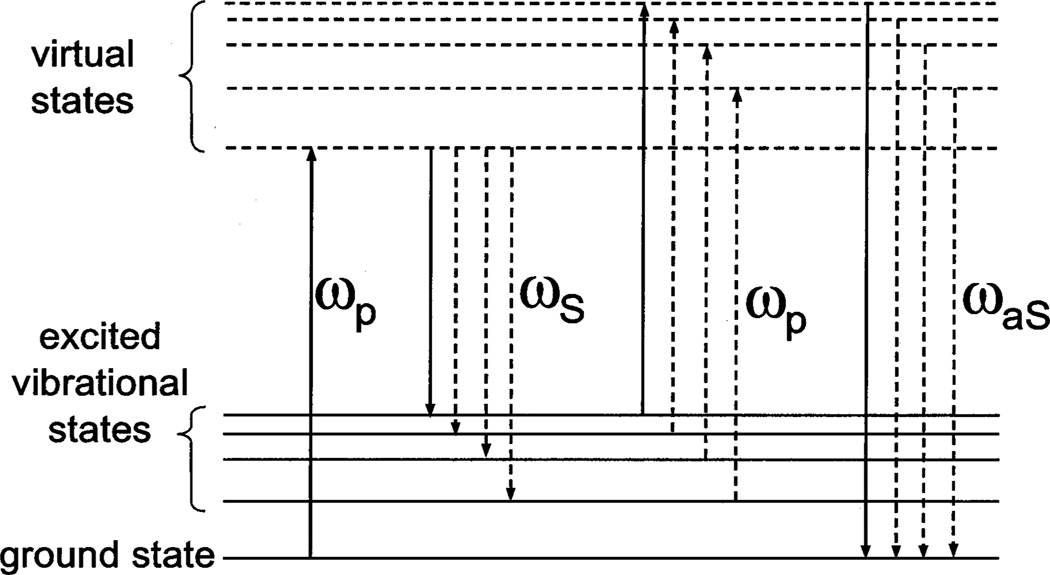
Coherent anti-Stokes Raman scattering (CARS) is a nonlinear scattering process in which pulsed light of at least two frequencies is mixed within a sample. Pump light at frequency ωp and Stokes light at ωS overlap temporally and spatially to produce anti-Stokes light at frequency ωaS = 2ωp – ωS. The anti-Stokes signal is proportional to the third-order polarizability, χ(3), which has nonresonant and resonant components, with the latter (the component of interest) being related to the Raman-scattering cross section at frequency (ωp −ωS). Figure 1 provides a diagram of the resonant process.
Figure 1.
Energy-level diagram for a single-frequency CARS process (solid vertical arrows) and for broadband CARS (solid and dashed vertical arrows).
Because the frequency difference (ωp − ωS) can be tuned to specific vibrational resonances within a sample, CARS microscopy is emerging as a powerful, noninvasive method for imaging biological and material specimens. CARS microscopy was first demonstrated in 1982,1 but Zumbusch et al. first used CARS microscopy in a collinear beam geometry.2 In the work using collinear beams, pump and Stokes pulses of approximately 50-cm−1 bandwidth were used to probe single vibrational resonances associated with an aromatic CH stretch (for imaging polystyrene beads in one sample) and an aliphatic CH stretch (for imaging cell membranes in another sample). Since then CARS microscopy has been imbued with the ability to discriminately image two distinct chemical species simultaneously by using Stokes light with a slightly increased bandwidth of 200 cm−1.3,4
The ability to acquire vibrational spectra over a significantly larger bandwidth would allow CARS to be used for identifying a larger number of chemically distinct species. Beyond this, however, truly broadband CARS could be used to identify and track slight changes in complex systems. Vibrational spectroscopy coupled with multivariate analysis techniques has already been shown to have sufficient capacity for reliable discrimination of subtly different cell types.5 However, such discriminatory power requires access to vibrational spectra over a broad band, and therefore this type of work has been performed with spontaneous Raman scattering up to now. CARS is a desirable alternative to spontaneous Raman scattering because CARS has a significantly larger scattering cross section and is less sensitive to intrinsic fluorescence. Furthermore, CARS, like two-photon microscopy, can be performed at light levels that are nontoxic even to rapidly dividing cells.6 Thus, broadband CARS has notable potential for facilitating noninvasive studies of biological and other complex systems at a level of detail that would be otherwise difficult to achieve. For example, broadband CARS imaging could be used to track such things as the time course of cellular differentiation and metabolic state in response to imposed stimuli, and possibly to delineate spatiotemporal aspects of cell signaling pathways and real-time chemical changes in organelles.
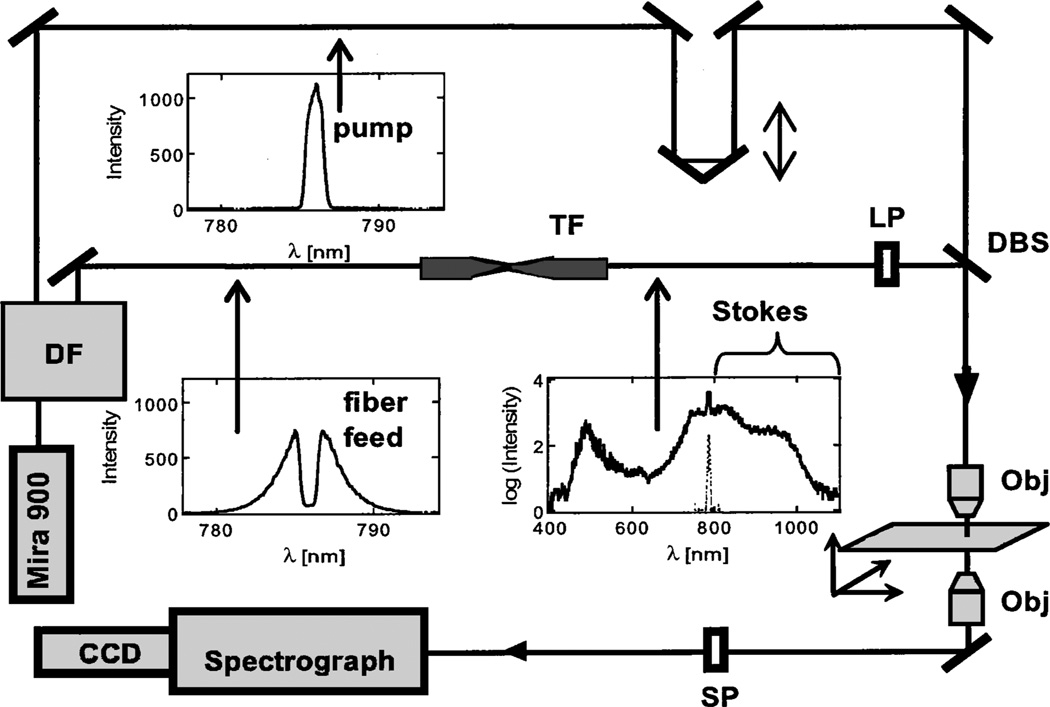
One possible pathway to increased bandwidth of vibrational sensitivity in CARS is an increased bandwidth of the Stokes light, as illustrated by the dashed vertical arrows in Fig. 1. Here we use broadband Stokes light to demonstrate for the first time to our knowledge a CARS microscope that can acquire spectral information over at least 2500 cm−1 simultaneously. Our experimental configuration is shown in Fig. 2. The instrument employs a Ti:sapphire oscillator (Coherent Mira 900F)7 pumped by a 6-W Nd:YVO4 laser (Coherent Verdi), producing 150-fs pulses at 785 nm, with a repetition rate of 76 MHz. After passing through an optical isolator, the oscillator output is introduced into a dispersionless filter.8 A 13-cm−1 slice is picked from the center of the spectrally dispersed pulse at the Fourier plane of this device and redirected for use as the CARS pump (ωp). The spectrum of the pump is displayed at the top of Fig. 2; it has a nearly transform-limited temporal width of 1.2 ps. The remainder of the laser output (200 mW; spectrum also depicted in Fig. 2) is fed into a tapered nonlinear fiber with a 9-mm length and a 2-µm-diameter waist to create a continuum that spans the range (500–1100 nm).9 The power in the output of the nonlinear fiber (≈100 mW) is distributed almost evenly among the blueshifted light, the unconverted feed light, and the redshifted light. The portion of the continuum at wavelengths longer than 785 nmis used for Stokes light. Frequency chirping of the continuum pulse occurs in the nonlinear fiber, giving a group-velocity dispersion of ≈32,000 fs2, and a pulse width of ~3 ps for the Stokes light (800–1100 nm).
Figure 2.
Experimental conf iguration: DF, dispersionless filter; TF, tapered fiber; LP, long-pass filter; SP, short-pass filter; DBS, dichroic beam splitter; Obj, microscope objective. The inset spectra are (counterclockwise from top) pump, feed light to TF, and output of TF. The TF feed light is arbitrarily scaled and superimposed on the TF output spectrum.
Pump and Stokes light are combined with a dichroic beam splitter (Chroma) and then directed through an 0.8-N.A. microscope objective onto the sample, where the average power is 13 mW for the pump and 10 mW for the Stokes light. Image scanning is performed by moving the sample by use of a motorized microscope stage (Applied Scientific Instrumentation Model MS2000). The CARS signal is collected by a 0.5-N.A. objective, and the spectral components at the pump wavelength and longer are removed by a combination of a notch filter (Kaiser Model HSPF-785) and a short-pass filter (Chroma). Anti-Stokes light is dispersed with a 300-line/mm grating in a Chromex 250IS spectrograph and detected by a thermoelectrically cooled (−55 °C) CCD array camera (Andor Technologies Model DB420).
In addition to the 2500-cm−1 range of spectral sensitivity, another significant benefit of this configuration is that it uses only a single Ti:sapphire oscillator, and thus there are no timing jitter issues.10 There have been previous demonstrations of single-laser CARS, but to our knowledge none has achieved the bandwidth demonstrated here. Paulsen et al.11 recently reported an arrangement using nonlinear fiber; however, they used the soliton output of the fiber as the pump light and the output of the oscillator as the Stokes light and were thereby able to probe only a single vibrational resonance without tuning. Silberberg and co-workers have used a pulse-shaping approach to obtain high-resolution CARS spectra over several hundred wave numbers with a single laser.12
There are three aspects of our system that have no-table potential to affect the spectral range of the CARS signal that we detect: the bandwidth and the chirp of the Stokes light and the axial chromatic aberration (ACA) of the focusing objective. Of these, ACA is potentially the most challenging. For the present work we used an 0.8-N.A. objective with sufficiently small ACA over the wavelength range of interest (Zeiss 50× EC Epiplan Neofluar). Although this objective was sufficient for the present purposes, a higher-N.A. objective is desirable for both increased signal and better spatial resolution. We have devised a straightforward approach for correcting ACA of essentially any objective to an acceptable level; this will be reported in the future.
The solid curve in Fig. 3a shows a broadband CARS spectrum of benzonitrile acquired at a 17-ms integration time; the dashed curve is the nonresonant back-ground, which is obtained by focusing the pump and Stokes light on a glass coverslip. The nonresonant background gives the shape of the CARS spectral envelope and shows that we achieve a reasonably uniform CARS response over spectral band of approximately 2500 cm−1. Stability of the spectral envelope is important for quantitative or even qualitative spectral analysis. The major factor in the stability of the CARS spectral envelope in our apparatus seems to be the stability in the shape and amplitude of the Stokes light envelope. We find that the intensity of our Stokes continuum can be characterized as having a relative standard deviation (rsd) of 0.004 over short time periods (50 ms to 10 s) and a rsd of 0.025 over long time periods (1 s to 1 h). The relative intensities of 15-cm−1 spectral segments were constant to within 0.003 and 0.05 rsd over the respective short and long time periods referred to above. This gives an indication of the spectral shape stability.
Figure 3.
Broadband CARS spectrum of benzonitrile. a, Raw CARS spectrum (solid curve) and nonresonant background (dashed curve). b, Ratio of the CARS spectrum to the nonresonant background (solid curve) and positions and amplitudes of the Raman lines.12 The CARS spectrum was obtained in 17 ms. c, Spontaneous Raman spectrum obtained under identical laser flux (23 mW but all in pump light). This spectrum was acquired in 1 s. The standard uncertainty of the spectrometer wavelength calibration was 5 cm−1.
The solid curve in Fig. 3b is the normalized CARS signal for benzonitrile. This is calculated by taking the ratio of the raw CARS signal to the nonresonant background after f irst subtracting the dark counts from both. The dashed lines in Fig. 3b represent the positions and amplitudes of Raman peaks for benzonitrile.13 We note that the positions of the CARS resonances that we obtain are consistent with the Raman line positions; however, the amplitudes are not. It appears, in the low-wave-number regime, that the CARS response is diminished with respect to the amplitude of the spectral envelope obtained from the nonresonant background. Figure 3c is a spontaneous Raman spectrum, acquired under 23-mW pump power for comparison purposes. We required a 1-s integration time to obtain a signal-to-noise ratio similar to that in the raw CARS data of Fig. 3a.
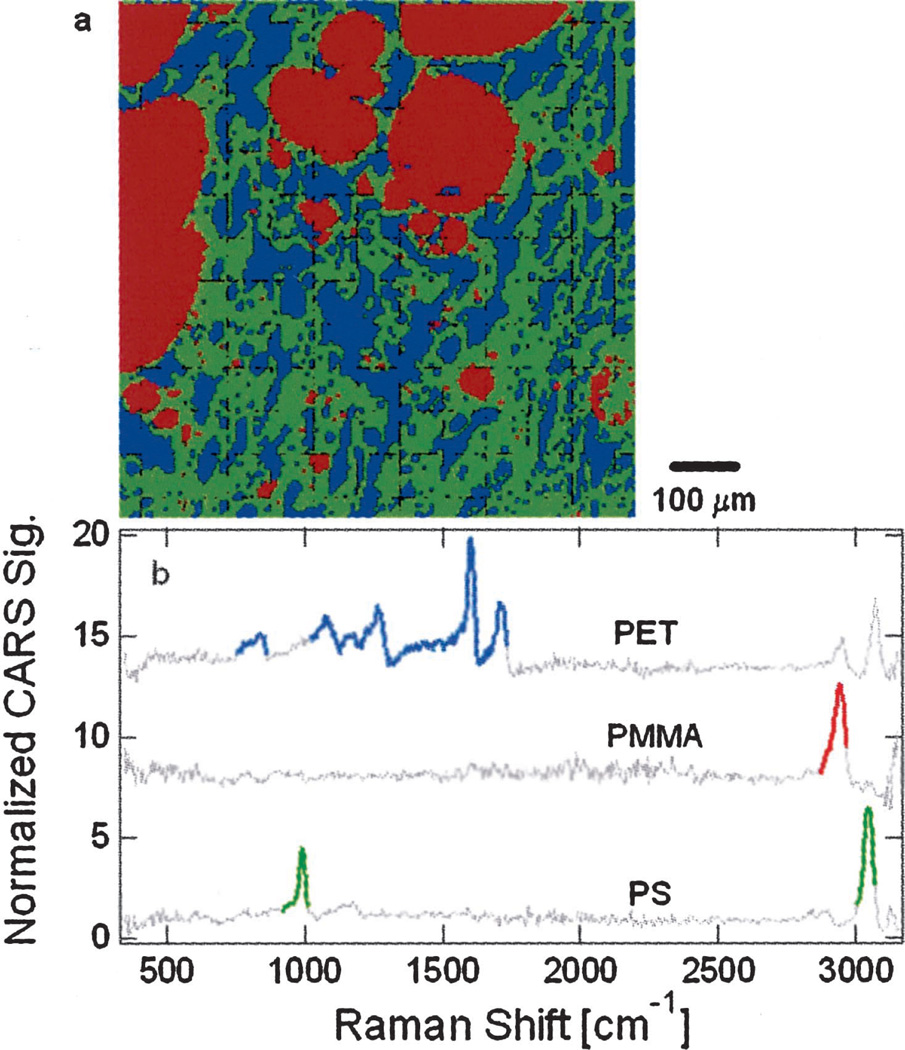
Figure 4a is an image of a tertiary polymer containing equal parts of polystyrene (PS), poly(methyl methacrylate) (PMMA), and poly(ethylene terephthalate) (PET); the polymer blend was annealed at 250 °C for 120 s, then melt pressed at that temperature. The image was obtained by use of broadband CARS microscopy, and pseudocolors were assigned to each polymer: red, green, and blue for PMMA, PS, and PET, respectively. Spectra from each of the blend components are plotted in Fig. 4b. The segments of these reference spectra represented by bold, colored lines were used for qualitative identification of spectra associated with individual pixels. Dot products were calculated from the reference spectral segments and corresponding spectral segments from the pixel in question. Pixel identity was assigned from the reference spectrum that gave the highest dot product. Each of the reference spectra was scaled so that the dot product of all the segments in the spectrum with themselves gave a total value of 1. In this way we could assign a polymer identity to each pixel with a standard uncertainty of 0.01.
Figure 4.
a, Broadband CARS micrograph of a phase-separated polymer blend including equal parts PMMA, PS, and PET. The pseudocolor image is 150 pixels square; the colors red, green, and blue correspond to PMMA, PS, and PET, respectively. b, Reference spectra from each of the individual polymer components (with an arbitrary vertical shift for clarity). The bold, colored line segments indicate spectral regions that were used for identification of spectra from each pixel in a.
The image in Fig. 4a was acquired with 17-ms pixel exposure times. This is much slower than the current state of the art in narrowband CARS (≈10-µs exposure time),14 but there is significant potential for increased information content in broadband spectral images.
Acknowledgments
We gratefully acknowledge that this work was funded in part by National Institutes of Health grant 1 R21 EB002468-01. We also thank William Wadsworth, John Lawall, and Tsvetelina Petrova for helpful guidance with regard to the use of nonlinear fibers for continuum generation and Lee Richter for his interest and assistance.
References
- 1.Duncan MD, Reintjes J, Manuccia TJ. Opt. Lett. 1982;7:350. doi: 10.1364/ol.7.000350. [DOI] [PubMed] [Google Scholar]
- 2.Zumbusch A, Holtom GR, Xie XS. Phys. Rev. Lett. 1999;82:4142. [Google Scholar]
- 3.Chen JX, Volkmer A, Book LD, Xie XS. J. Phys. Chem. B. 2002;106:8493. [Google Scholar]
- 4.Muller M, Schins JM. J. Phys. Chem. B. 2002;106:3715. [Google Scholar]
- 5.Schut TCB, Wolthuis R, Caspers PJ, Puppels GJ. J. Raman Spectrosc. 2002;33:580. [Google Scholar]
- 6.Konig K, So PTC, Mantulin WW, Gratton E. Opt. Lett. 1997;22:135. doi: 10.1364/ol.22.000135. [DOI] [PubMed] [Google Scholar]
- 7.Certain commercial equipment and materials are identified in this Letter to specify adequately the experimental procedure. In no case does such identification imply recommendation by the National Institute of Standards and Technology, nor does it imply that the material or equipment identified is necessarily the best available for this purpose.
- 8.Weiner AM, Heritage JP, Kirschner EM. J. Opt. Soc. Am. B. 1988;5:1563. [Google Scholar]
- 9.Birks TA, Wadsworth WJ, St. J. Russell P. Opt. Lett. 2000;25:1415. doi: 10.1364/ol.25.001415. [DOI] [PubMed] [Google Scholar]
- 10.Jones DJ, Potma EO, Cheng JX, Burfeindt B, Pang Y, Ye J, Xie XS. Rev. Sci. Instrum. 2002;73:2843. [Google Scholar]
- 11.Paulsen HN, Hilligsoe KM, Thogersen J, Keiding SR, Larsen JJ. Opt. Lett. 2003;28:1123. doi: 10.1364/ol.28.001123. [DOI] [PubMed] [Google Scholar]
- 12.Oron D, Dudovich N, Yelin D, Silberberg Y. Phys. Rev. Lett. 2002;88:063004. doi: 10.1103/PhysRevLett.88.063004. [DOI] [PubMed] [Google Scholar]
- 13.McCreery RL. http://www.chemistry.ohio-state.edu/~rmccreer/freqcorr/images/benzo.html. [Google Scholar]
- 14.Cheng JX, Jia YK, Zheng GF, Xie XS. Biophys. J. 2002;83:502. doi: 10.1016/S0006-3495(02)75186-2. [DOI] [PMC free article] [PubMed] [Google Scholar]


