

Abstract
Ethanol (alcohol) interacts with diverse molecular effectors across a range of concentrations in the brain, eliciting intoxication through to sedation. Invertebrate models including the nematode worm Caenorhabditis elegans have been deployed for molecular genetic studies to inform on key components of these alcohol signaling pathways. C. elegans studies have typically employed external dosing with high (>250 mM) ethanol concentrations: A careful analysis of responses to low concentrations is lacking. Using the C. elegans pharyngeal system as a paradigm, we report a previously uncharacterized continuum of cellular and behavioral responses to ethanol from low (10 mM) to high (300 mM) concentrations. The complexity of these responses indicates that the pleiotropic action of ethanol observed in mammalian brain is conserved in this invertebrate model. We investigated two candidate ethanol effectors, the calcium-activated K+ channel SLO-1 and gap junctions, and show that they contribute to, but are not sole determinants of, the low- and high-concentration effects, respectively. Notably, this study shows cellular and whole organismal behavioral responses to ethanol in C. elegans that directly equate to intoxicating through to supralethal blood alcohol concentrations in humans and provides an important benchmark for interpretation of paradigms that seek to inform on human alcohol use disorders.—Dillon, J., Andrianakis, I., Mould, R., Ient, B., Liu, W., James, C., O'Connor, V., Holden-Dye, L. Distinct molecular targets including SLO-1 and gap junctions are engaged across a continuum of ethanol concentrations in Caenorhabditis elegans.
Keywords: electrophysiology, pharynx, anesthesia, intoxication, alcohol, calcium-activated K+ channel
ethanol (alcohol) has complex concentration-dependent effects on neural circuits, which profoundly affect brain function, behavior, and mental health (1). It elicits these effects through relatively low-affinity interactions with a diverse range of signaling pathways encompassing lipid membrane, membrane-bound receptors and ion channels, and intracellular signaling cascades (2). However, the contribution of each of these component effectors to the emergent behavioral response spanning intoxication through to sedation is poorly understood. Therefore, this study aimed to establish an experimental paradigm in Caenorhabditis elegans to reveal behavioral elements of this complexity and to resolve the underpinning neural network responses across the range of alcohol concentrations that impact on human brain function (3).
C. elegans has provided a highly tractable experimental model to investigate the effects of ethanol on broad aspects of biology encompassing survival (4), development (5, 6), gene expression (7, 8), and neuroadaptive responses (9, 10). C. elegans also encounter alcohol in their natural habitat, rotting fruit (11), and thus may provide insight from an ecological and evolutionary perspective (12).
Here we show that the pharyngeal system of C. elegans lends itself well to an analysis of the effects of ethanol that spans interrelated levels of biological organization from whole organismal behavior through to neural network activity and cellular responses (13). This breadth of analysis cannot readily be achieved in higher animals and provides a route to a molecular genetic paradigm to reveal distinct ethanol effector pathways. Furthermore, it encompasses several neuronal substrates and signaling pathways identified as being involved in the acute responses to ethanol in the mammalian brain highlighting it as an informative model for an integrative analysis of ethanol-elicited behaviors (14). At the behavioral level, C. elegans feeding can be quantified in the intact organism as its translucent cuticle permits visual observation of the rhythmic contraction-relaxation cycle of the pharyngeal terminal bulb that underpins this behavior (15). Feeding is supported by the coordinated activity of the pharyngeal neural network, and this can be recorded in the form of an electropharyngeogram (EPG; ref. 16), which reports on the activity of the excitatory and inhibitory motorneurones that regulate the pharynx and the rhythmic contraction-relaxation cycle of the pharyngeal muscle syncytium. Finally, moving from the network to the cellular level, intracellular recordings of the muscle cells of the pharyngeal terminal bulb provide a direct measure of the electrical properties of single muscle cells. These are electrically coupled to form the syncytium, which is regulated by the pharyngeal neural network and underpins feeding behavior (17, 18). We deployed these overlapping experimental approaches to reveal a previously uncharacterized complex continuum of C. elegans ethanol responses that map onto the same range of concentrations that elicit intoxication through to sedation and lethality in human. A calcium-activated K+ channel, SLO-1, and gap junctions are ascribed a role in low- and high-dose effects, respectively.
MATERIALS AND METHODS
Culturing of C. elegans
Wild-type, Bristol N2 animals were cultured according to established methods (19). Hermaphrodites were grown on a bacterial lawn of Escherichia coli (OP50 strain). Worm age was synchronized by picking L4 larval stage animals to new plates 18 h prior to performing the behavioral and electrophysiological experiments. The strains NM1968 slo-1(js379), JD21 cca-1(ad1650), and DA1426 exp-2(sa26ad1426) were obtained from the C. elegans Genetic Centre (Minneapolis, MN, USA).
Scoring feeding behavior in intact animals
Feeding behavior was scored by measuring frequency of pharyngeal pumping where a single pharyngeal pump is one contraction-relaxation cycle of the terminal bulb of the pharyngeal muscle. Worms used in pumping assays were picked from a plate seeded with a lawn of OP50 food and placed onto a nonfood plate for 5 min to remove any bacteria adhering to the cuticle. Individual worms were then transferred to separate plates with or without OP50 and with or without ethanol and pharyngeal pumping was recorded using a hand counter, for 1 min. In the experiments conducted in the presence of food, only one measurement was made for each worm 5 min after it was placed on the agar plate. For the experiments in the absence of food, the pumping rate was monitored at 5 and 60 min following removal from food. Ethanol-containing plates were prepared in the same way as described previously (9). Pharyngeal pumping was recorded using a hand counter.
Recording the effects of ethanol on the pharyngeal neural network
The EPG is an extracellular electrophysiological technique in which a suction electrode placed on the anterior-most tip of the worm records each pharyngeal muscle pump. A single pump corresponds to the coordinated contraction and relaxation of the pharynx to ingest bacteria, and the rate of pumping correlates to the rate of feeding in the intact worm. These experiments were performed on worm heads that had been cut from the body, thus exposing them to the perfusing medium and allowing precise control of ethanol application, both in terms of concentration and duration. Worms were transferred to a 3-cm-diameter Petri dish containing modified Dent's saline (in mM: 10 d-glucose, 140 NaCl, 1 MgCl2, 3 CaCl2, 6 KCl, and 10 HEPES; pH 7.4) supplemented with 0.01% BSA (w/v). A razor blade was then used to make a transverse cut immediately posterior of the terminal bulb of the pharynx. The semi-intact pharyngeal preparation in which the body wall muscle contracts to expose the nerve ring and pharynx was transferred to the recording chamber, which held a volume of ∼400–500 μl. EPGs were made using previously described methods (17, 20). The recordings were made under perfusion with Dent's saline at a rate of ∼4–5 ml/min. Ethanol was diluted to the required concentration in Dent's saline and applied by perfusion. In the case of carbenoxolone, a stock solution was prepared in water and diluted to the required concentration in Dent's saline. The time course of drug application is indicated in individual figures and figure legends. To quantify the effects of ethanol on the behavior of the pharyngeal network, we used recordings of the basal activity and the effect of perfusion with ethanol. Recordings were analyzed offline using a signal peak detection algorithm, which allows high-throughput analysis of EPG signals (20). This analysis was deployed to extract features of the EPG signal that define key features of the pharyngeal neural network: the frequency; the average duration of single EPGs; the number of P waves per EPG, regulated by activity of the inhibitory motorneurone M3 (21) and the R to E ratio, which is closely associated with muscle depolarization (contraction) at the beginning of a pump and repolarization (relaxation) at the end of a pump; and the pattern of activity, which is also under neural control (20).
We adopted an experimental design for EPG recordings that would enable us to take into account the changing behavior of the pharynx as it responds to the removal from the food plate. The pharynx is the feeding organ of the worm, and its behavior is regulated by the presence or absence of food. When the worm's head is cut and the pharyngeal preparation is placed on the microscope stage in order to make the recording, the pharynx undergoes a time-dependent physiological adaptation to removal from food, which is manifest as an initial very low pumping rate followed by a gradual increase over the course of the recording. Therefore, all ethanol treatment groups were paired with control recordings; i.e., a sham-treatment control experiment, on the same experimental day made over the same time period but with no ethanol. Each EPG recording was made for 20 min. All experiments commenced with a 5-min perfusion period with Dent's saline. After 5 min, the perfusion was switched to either ethanol (test) or Dent's saline (sham-treatment control). After another 10 min, the perfusion was switched to saline for both experimental groups. To test whether ethanol significantly affected pharyngeal pumping, a statistical analysis was performed that compared the change in pumping rate over time in the sham control group with the change over time in the ethanol test group (see below).
Recording the effects of ethanol on single muscle cells of the pharyngeal terminal bulb
Single microelectrode intracellular recordings were made from the terminal bulb as described previously (17, 22). Recordings were made from cut head preparations in Dent's saline supplemented with 0.01% BSA (w/v). The recordings were made under perfusion with Dent's saline at a rate of ∼4–5 ml/min. Ethanol was diluted to the required concentration in Dent's saline and applied by perfusion. The time course of drug application is indicated in each figure.
Measuring gap-junction coupling
The integrity of gap-junction coupling in the pharyngeal muscle syncytium was assessed by intracellular dye injection. A 5% (w/v) solution of 5(6)-carboxyfluorescein mixed isomers (Sigma, St. Louis, MO, USA) in 0.1 M potassium acetate was prepared and filtered immediately before use. The dye was injected by iontophoresis (50 nA hyperpolarizing current) via a sharp electrode that was inserted into the exposed terminal bulb. The sharp electrode was filled with a small volume of the 5(6)-carboxyfluorescein solution and then filled with 4 M potassium acetate, 10 mM KCl. Dye filling commenced 4 min after impalement of the terminal bulb, which was confirmed by obtaining a negative resting membrane potential. During this initial 4-min period and for the duration of the dye filling, the pharynxes were under constant perfusion. While the dye was being injected, its diffusion through the pharynx was recorded. Fluorescence was observed using a standard GFP filter block. Pharyngeal muscle images were captured during dye injection. An external trigger was used to synchronize image capture with a shutter positioned in the epifluorescence port. Images were captured using a Hamamatsu digital camera (Hamamatsu Photonics, Hamamatsu, Japan) and Wasabi image capture software (supplied by Hamamatsu) at ×60. An image was recorded every 5 s for 5 min with an exposure time of 30 μs, after 4 min of gaining an intracellular recording. The fluorescence intensity of the corpus for each successive frame was measured post hoc using the Wasabi image capture software. The region of the corpus was manually selected using the software and fluorescence was measured in the selected region as pixel intensity on a 16-bit gray scale for each individual worm.
Pharyngeal video recordings
Video was captured while simultaneously recording an EPG, using a black-and-white video camera at 25 frames/s. The video recorded 30 s from individual worms during the last 5-min period of the 10-min ethanol application.
Statistical analysis
Data are expressed as means ± sem. Significant difference was tested using paired or unpaired Student's t test as appropriate. For the time-course studies on the effect of ethanol on EPG frequency, a statistical analysis was performed that took into account the gradually increasing baseline pumping rate during the recording period. AutoEPG software (20) was used to extract the pumping frequency at 1-min intervals of the 20-min time course of the experiment for both control and ethanol-treated worms. For each worm, the rate of pumping during the first 5 min of the recording was averaged to give the basal pumping frequency during this period. This was then subtracted from the pump rate during the treatment period at each time interval, to give the increase/change from baseline at 1-min intervals during the treatment period. The data obtained were then used to fit mixed-effects or longitudinal regression models to study the time course over the 10-min treatment period. Subsequently, an averaged linear regression line was fitted for the control worms and for the worms treated with ethanol, and the null hypothesis that these two average linear regression lines are coincident was tested.
RESULTS
Low-dose ethanol-induced excitation and high dose-induced inhibition of feeding behavior
The effect of ethanol on feeding behavior was tested in the presence and absence of food (Fig. 1A). The pharyngeal muscle typically pumps at a rate of 200 pumps/min in the presence of abundant food, and this is rapidly reduced when the animals are moved away from food (23), although over the course of an hour, the pumping rate gradually increases to a level ∼10% of that on food (Fig. 1B–D). Exposure of animals to 25 mM ethanol on food had no significant effect on the rate of feeding (control 178.3±9.1 pumps/min; 25 mM ethanol 192.9±6.2 pumps/min; n=60; P = 0.1899, Student's unpaired t test.) However, after 5 min exposure to 50 mM, a small but significant increase in rate was observed (Fig. 1B). This stimulatory effect of 50 mM ethanol was more marked 5 min after removal from food (Fig. 1C) and was transient; after 60 min, the pump rate in the presence and absence of ethanol was the same (Fig. 1D). At 150 mM ethanol, no effect of ethanol was found either in the presence of food or 5 min after removal from food (Fig. 1E, F). However, 60 min after removal from food, a significant inhibition of pumping was found. At 300 mM ethanol, the rate of feeding was strongly inhibited both in the presence and absence of food after 5 and 60 min off food. This inhibition of feeding was accompanied by an inhibition of locomotion and uncoordinated movement as described previously (refs. 24, 25 and data not shown). Therefore, exposure of C. elegans to ethanol has a threshold effect on feeding behavior at 50 mM and progresses from a low-dose excitation through to a high-dose inhibition.
Figure 1.

Ethanol-induced low-dose excitation and high-dose inhibition of feeding in intact worms. A) Experimental design for the analysis of ethanol effect on pharyngeal pumping in the presence (gray shading) and absence of food. B) Dosage of 50 mM ethanol on food; n = 68 Eth, 50 Ctrl. C) Dosage of 50 mM ethanol off food for 5 min; n = 10 Eth, 10 Ctrl. D) Dosage of 50 mM ethanol off food for 60 min; n = 9 Eth, 8 Ctrl. E) Dosage of 150 mM ethanol on food; n = 16 Eth, 16 Ctrl. F) Dosage of 150 mM ethanol off food for 5 min; n = 8 Eth, 8 Ctrl. G) Dosage of 150 mM ethanol off food for 60 min; n = 8 Eth, 5 Ctrl. H) Dosage of 300 mM ethanol on food; n = 16 Eth, 16 Ctrl. I) Dosage of 300 mM ethanol off food for 5 min; n = 8 Eth, 6 Ctrl. J) Dosage of 300 mM ethanol off food for 60 min; n = 8 Eth, 3 Ctrl. Data are means + sem. Eth, ethanol; Ctrl, control. *P < 0.05, **P < 0.01, ***P < 0.001; unpaired Student's t test.
Concentration-dependent effects of ethanol on the pharyngeal neural network
Extracellular recordings captured from the anterior tip of the worm report the activity of the pharyngeal neuromuscular network (Fig. 2A). On a slow time-base, this can be used to report the frequency of pharyngeal pumping (Fig. 2B); whereas, on an expanded time-base, it is possible to resolve discrete features of the EPG waveform (Fig. 2C), which report activity in the musculature and the neural circuit regulating feeding behavior (for review see ref. 13).
Figure 2.
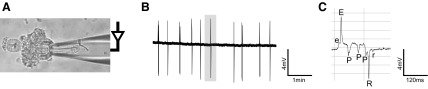
EPG for recording neural network and pharyngeal activity underpinning feeding behavior. A) Method for measuring the EPG. The pharynx was dissected to expose the terminal bulb to the perfusate, and the recording electrode was positioned just before the corpus. B) EPG recording displayed on a slow time base; an individual spike (highlighted) corresponds to a single contraction-relaxation cycle (pump) of the pharynx. C) Region shaded in panel B displayed on an expanded time base. Each pump of the pharynx produces a characteristic waveform. Annotation for electrical transients: e is associated with the cholinergic MC motorneuron activity; E is caused by muscle depolarization; P is associated with the glutamatergic M3 motorneuron; R and r correspond to muscle repolarization.
A systematic analysis of the concentration-dependent effects of ethanol on EPG recordings was conducted (Fig. 3A). In these assays, the heads were cut from the body of the worm, and no food was present to stimulate pharyngeal activity. Therefore, the basal rate of pumping was low, ∼10/min, and gradually increased over time; e.g., Fig. 3C. At a concentration of 20 mM ethanol, no significant effect on the EPG frequency (data not shown) was found. The lowest concentration tested at which an effect on pharyngeal pumping frequency was observed was 50 mM (Fig. 3B, C). This finding closely matched the results obtained in the experiments measuring feeding behavior in intact worms. Furthermore, and similar to the stimulation of feeding in the intact worm in the absence of food with 50 mM, this effect was transient. At 100 mM (Fig. 3D, E) and 150 mM (Fig. F, G), the effect of ethanol on the pump frequency over the 10-min time course of its application were more variable compared to effects observed with 50 mM ethanol (Fig. 3B, C). At these higher concentrations, individual worms displayed either a transient, variable increase in the pump frequency when ethanol was first applied (Fig. 3D), as seen at 50 mM, or a progressive inhibition of pumping that occurred within 4–5 min of ethanol being applied (Fig. 3F). Thus, despite the fact that in individual worms, variable responses to ethanol could be observed at these concentrations (Fig. 3D, F), the net result was that no significant effect overall on the rate of pharyngeal pumping (Fig. 3E, G) was found. In contrast, at 300 mM, ethanol pharyngeal pumping was rapidly and markedly inhibited (Fig. 3H, I). This inhibition correlated with that observed with 300 mM ethanol on feeding behavior in the intact worm (Fig. 1H–J). The inhibition of pharyngeal pumping in the cut-head preparation was rapidly and completely reversed when the ethanol was washed off with Dent's saline (Fig. 3H).
Figure 3.

Ethanol has concentration-dependent effects on neural network activity. A) Electrophysiological recordings from sham-treated control and ethanol-treated preparations. B, D, F, H) Example EPG traces recorded from individual worms: 50 mM (B), 100 mM (D), 150 mM (F), and 300 mM ethanol (H). C, E, G, I) Time course for the response to ethanol: 50 mM (C), 100 mM (E), 150 mM (G), and 300 mM ethanol (I). Gray indicates sham treatment; black indicates ethanol treatment. Application of 50 mM ethanol caused a significant difference in the frequency of pharyngeal pumping compared to the sham-treated control (P<0.001; see Materials and Methods for statistical analysis). Note the decrease in the amplitude of the E spike during ethanol application, which is reversed during the wash phase. Number of individual animals for each concentration: 50 mM, n = 23 ethanol, 26 control; 100 mM, n = 7 ethanol, 10 control; 150 mM, n = 11 ethanol, 10 control; 300 mM, n = 14 ethanol, 14 control.
Closer inspection of the EPG waveform across the range of ethanol concentrations indicated a disruption of the integrity of the signal. At 10 mM ethanol, a subtle but significant disruption of the pattern of activity was observed, such that pumps occurred more often as bursts of activity (Fig. 4A, B); however, the average frequency of pumping was unaffected (control 0.28±0.026 Hz, compared to 10 mM ethanol 0.27±0.025Hz, n=9). At 50 mM ethanol and above, further effects on the shape of the EPG waveform were observed. To quantify these, the effects of ethanol on the EPG duration and the ratio of the R- and E-spike amplitudes were measured (Fig. 5A). A shift in the R/E ratio (Fig. 5B) was found, which reflects the observation that the E spike (which results from synchronous depolarization of the muscle syncytium) decreased in amplitude relative to the R spike (which largely derives from the rapid repolarization of the terminal bulb muscle). The effect of ethanol on the R/E ratio was less at 300 mM, as there was, in addition, a marked decrease in the amplitude of the R spike (Figs. 3H and 5B). This reduction coincided with the complete inhibition of pump frequency (Fig. 3H). At 50 mM ethanol, the concentration that increases feeding and pumping frequency, there was a reduction in pump duration, whereas at 300 mM, a concentration that inhibits feeding and pump frequency, EPG duration was significantly increased (Fig. 5C).
Figure 4.
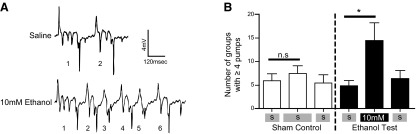
Resolving discrete ethanol effects on neural network activity by high-resolution analysis of EPG waveforms. A) Application of 10 mM ethanol caused wild-type worms to pump in bursts containing 4 or more individual pumps. In the example shown for 10 mM ethanol, 6 individual pumps occur, each within 200 ms of the previous pump, which would be classified as a group containing ≥4 pumps. B) Quantification of the bursting behavior of the pharynx stimulated by 10 mM ethanol. Sham-treated control, n = 9; ethanol tested, n = 9. Shaded bars indicate saline application. *P < 0.05; 2-tailed paired Student's t test.
Figure 5.
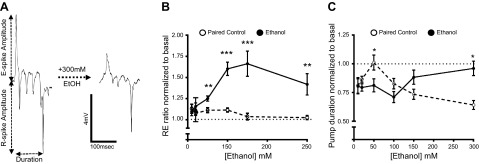
Concentration-dependent effect of ethanol on the EPG waveform. A) Single-pump waveform indicating the parameters measured to record the ratio of the R- and E-spike amplitude and the pump duration before and after ethanol treatment. B, C) Effect of ethanol on R/E ratio (B) and pump duration (C). EPG recordings were conducted according to the experimental design shown in Fig. 3A. For each recording, the data obtained during the 10-min saline/ethanol perfusion period were normalized to basal (i.e., the recording obtained in the first 5 min of perfusion). Graphs show the average normalized value plotted for the paired control (open symbols) and ethanol (solid symbols) treatment groups. R/E ratio and pump duration of ethanol-treated worms and the respective paired control were compared using an unpaired Student's t test. Numbers of individuals tested were same as in Fig. 3. *P < 0.05.
Therefore, the dissected C. elegans pharyngeal network exhibits a similar profile of responses to ethanol as feeding behavior in the intact worm, with an excitation at 50 mM progressing to marked inhibition at 300 mM. In addition, this assay resolves a low-dose effect of ethanol at 10 mM manifest as a disruption of rhythmic coordinated pumping.
Complex effects of ethanol on pharyngeal muscle action potentials
The activity of the pharynx is underpinned by the generation of a pharyngeal action potential, which can be recorded via intracellular electrodes placed in the terminal bulb region of the pharynx (17, 26). Therefore, to assess the effects of ethanol at the cellular level in the pharyngeal network, we made intracellular recordings from a single pharyngeal muscle in the terminal bulb (Fig. 6A). We observed concentration-dependent effects on pharyngeal action potential frequency and shape (Fig. 6B–E). The lowest concentration at which an effect was observed was 20 mM (Fig. 6B; control spike rate 12.72±2.085/min; 20 mM ethanol 21±3.166/min; n=5; P=0.012 paired Student's t test). Interesting to note, this also appeared to be accompanied by bursting activity, as observed with 10 mM ethanol in the EPG assay. As the concentration of ethanol was increased, a concomitant increase was found in action potential frequency (Fig. 6C, E) accompanied by a marked perturbation of the action potential waveform (Fig. 6D), a decrease in the amplitude of the action potential (Fig. 6F), and a depolarization of the resting membrane potential (Fig. 6G). The change in resting membrane potential became more pronounced as the concentration of ethanol increased from 150 mM (Fig. 6G). All of these effects of ethanol were rapidly reversed on washing the ethanol out with Dent's saline (Fig. 6B, C).
Figure 6.

Concentration-dependent effect of ethanol on single muscle cells of the pharyngeal terminal bulb. A) Configuration for recording action potentials from single muscle cells in the terminal bulb. B) Effect of 20 mM ethanol on muscle activity. Note the initial rapid increase in activity during the first 2 min of ethanol application (indicated by the gray bar). C) Example recordings made in the presence of increasing ethanol concentration. D) Examples of the effect of increasing ethanol on the shape of the muscle action potential. E, F) Effect of ethanol on spike frequency during the first 2 min of ethanol application, normalized to basal spike frequency (E) and effect of ethanol on spike amplitude (F). For each individual recording, the amplitude of the last 6 spikes in the first 2 min of ethanol application was used to calculate the mean spike amplitude. This finding was normalized to the mean spike amplitude of the last 6 spikes of the basal period. Number of individuals recorded for each concentration: 1 mM, n = 5 ethanol, 5 control; 10 mM, n = 7 ethanol, 7 control; 20 mM, n = 5 ethanol, 4 control; 30 mM, n = 4 ethanol, 4 contro; 50 mM, n = 6 ethanol, 5 control; 100 mM, n = 5 ethanol, 4 control; 150 mM, n = 5 ethanol, 4 control; 300 mM, n = 9 ethanol, 5 control; 500 mM, n = 5 ethanol, 3 control. Statistical analysis was performed using Student's unpaired t test for each paired experimental group (control and ethanol) on the data prior to normalization. *P < 0.05, **P < 0.01. G) Effect of ethanol on the muscle resting membrane potential. For each concentration tested, the resting membrane potential was measured over a stable region of the basal and treatment periods. *P < 0.05.
Fibrillation of the terminal bulb in high concentrations of ethanol
Of note from the intracellular recordings of the pharyngeal action potentials was the finding that the 3-fold increase in the frequency of pharyngeal action potentials with 300 mM ethanol was not reflected in a concomitant increase in EPG frequency (Figs. 3D–G and 6B, C, E). We also noted the disconnection between the excitatory effect of 300 mM ethanol on pharyngeal muscle action potential frequency and the inhibitory effect of 300 mM ethanol on feeding behavior (Fig. 1H–J). In many ways, the pharynx can be thought of as operating in a similar fashion to the vertebrate heart in that a muscle action potential is rapidly propagated via gap junctions through a muscle syncytium to bring about synchronous contraction and relaxation (13). Thus, we considered that 300 mM ethanol may cause an uncoupling of the pharyngeal action potential from the coordinated contraction-relaxation cycle of the pharyngeal syncytium. Indeed, the effect of ethanol in causing a decreased E-spike amplitude in the EPG, a part of the waveform resulting from synchronous depolarization in the muscle syncytium, may be interpreted as a reduced synchronization of muscle activity in the presence of ethanol. To test whether ethanol caused muscle uncoupling, we captured videos of pharynxes in the presence and absence of ethanol. In the presence of ethanol, the normal synchronous activity of the pharynx, readily seen as the coordinated opening and closing of the terminal bulb grinder (Supplemental Video S1A) became uncoordinated, resembling a fibrillation (Supplemental Video S1B). This paralleled the dose-dependent changes in the intact worm that were observed to inhibit feeding behavior.
High concentrations of ethanol uncouple the pharyngeal syncytium
To determine whether the coupling of the pharyngeal muscles is disrupted by ethanol, the fluorescent dye carboxyfluorescein was injected into the terminal bulb of wild-type pharynxes. In control animals, the dye spread from a single muscle cell in the terminal bulb to all of the major muscle cells of the pharynx. We tested two concentrations of ethanol, 150 and 300 mM, at which we had previously observed a pronounced effect on the amplitude of the muscle depolarization E spike in the EPG. In the ethanol-treated animals, the rate of dye diffusion was compromised. The fluorescence intensity was measured from the corpus (Fig. 7A). At both concentrations of ethanol, the fluorescence intensity of this region lagged behind control animals (Fig. 7B), and this was significantly different from control animals at 300 mM ethanol (Fig. 7C).
Figure 7.

Effect of ethanol on gap-junction coupling. A) Experimental setup for the injection and measurement of pharyngeal dye filling with 5(6)-carboxyfluorescein. B) Pixel intensity of the corpus was measured at 5-s intervals over a 5-min time course in the presence of either 150 or 300 mM ethanol. In the sham-treated control, ethanol was substituted for saline. Time points represent means ± sem. Control, n = 11; 150 mM, n = 7; 300 mM, n = 4. An unpaired Student's t test was used to compare the pixel intensity at the last time point. *P < 0.05. C) Example images recorded 5 and 100 s after commencing dye injection from the pharynx of control worms and worms exposed to either 150 or 300 mM ethanol. Arrows indicate location of the corpus muscle. D) Application of 50 mM carbenoxolone caused a decrease in the amplitude of the E and R phases of the EPG waveform. Representative EPG recording with EPG waveforms presented using an expanded time base. E) Application of 300 mM ethanol. Representative EPG recording with EPG waveforms presented using an expanded time base. Note that similar EPG waveforms were identified in the presence of carbenoxolone and a high concentration of ethanol.
The compromised pharyngeal dye filling suggests that the gap-junction coupling of the pharyngeal muscle cells was disrupted by ethanol. To assess whether the decrease in the amplitude of the E spike recorded by the EPG in the presence of ethanol was caused by a disruption to gap-junction transmission, EPGs were recorded in the presence of carbenoxolone, an inhibitor of gap-junction coupling (27). Similar to ethanol, carbenoxolone (50 μM) caused a decrease in the E-spike amplitude of the EPG waveform (Fig. 7D, E). In addition, this finding was accompanied by a decrease in the amplitude of the R spike. The EPG waveform in the presence of carbenoxolone was similar to that recorded after a 2- to 3-min exposure of the pharynx to 300 mM ethanol.
SLO-1 in the pharyngeal response to ethanol, from cell to behavior
SLO-1 is a calcium-dependent big potassium (BK) channel, which is highly conserved across the animal phyla and has been widely implicated in the intoxicating actions of ethanol (28, 29). Therefore, we tested whether a slo-1 functional null mutant, js379 (30) had altered pharyngeal responses to ethanol. Intracellular recordings of the action potentials from slo-1(js379) at 50 mM ethanol showed a lack of the stimulatory effect seen in wild-type (Fig. 8A, B). In these experiments, the pharyngeal action potential frequency of slo-1(js379) was higher than wild-type (Fig. 8B), which may occlude an excitatory ethanol effect. However, against that argument is the fact that the frequency of slo-1 rate is below the maximal rates observed elsewhere, which suggests that ethanol could increase the spike rate further. In contrast, the inhibitory effects at high concentrations of ethanol on action potential amplitude were still clearly observed in slo-1 (Fig. 8A), as was the effect of ethanol on membrane potential (Fig. 8A, C). The inhibition of amplitude was more obvious in slo-1(js379) (Fig. 8A) compared to wild type (Fig. 6C). In the intact animal, the effect of ethanol on feeding behavior was the same in slo-1 compared to wild type, and both the low-dose excitation and high-dose inhibition were observed (Fig. 8D). Thus, it would seem that, while slo-1 contributes to the ethanol sensitivity of the pharyngeal muscle, it is not required for the response at the whole organismal level consistent with ethanol having actions through diverse signaling pathways to bring about behavioral inhibition.
Figure 8.

Effect of ethanol on the pharyngeal network and feeding behavior of slo-1(js379). A) Example intracellular recordings of the effect of increasing concentrations of ethanol on pharyngeal muscle cell activity. B) Quantification and comparison of wild-type (n=6) and slo-1(js379) (n=5) pharyngeal muscle activity in the presence of 50 mM ethanol. C) Effect of ethanol on slo-1(js379) pharyngeal muscle resting membrane potential. Number of individuals tested for each concentration: 50 mM, n = 5; 100 mM, n = 5; 150 mM, n = 5; 300 mM, n = 4. D) Pharyngeal pumping in intact slo-1(js379) animals in the absence of food and the presence of increasing concentrations of ethanol. C indicates paired control animals. Number of individuals tested for each concentration: 50 mM, n = 8 ethanol, 11 control; 150 mM, n = 8 ethanol, 12 control; 300 mM, n = 8 ethanol, 8 control. Statistical analysis: 2-tailed unpaired Student's t test was used to compare the spike rate in the presence of ethanol and the basal spike rate prior to ethanol application (B); each concentration to the resting membrane potential at 50 mM ethanol (C); or pump rates of ethanol-treated and paired sham-treated control worms (D). *P < 0.05, **P < 0.01.
DISCUSSION
In humans, the blood alcohol concentration (BAC) that is legally considered to impair judgment is 0.08% (v/v) or 17 mM (UK and U.S. drink-drive limit; ref. 2). In C. elegans, we have shown that the lowest concentration of ethanol that can elicit a neural response is 10 mM. This finding was manifest as an altered pattern of activity of the pharyngeal muscle. The normally rhythmic contraction–relaxation cycle changed from an evenly spaced pattern of pumps to a bursting-like activity in which a series of pumps occurred rapidly in succession. This slight disruption of C. elegans coordinated network activity is what one might predict as a paradigm of mild intoxication. The effect of ethanol in eliciting a bursting pattern of EPG activity is similar to a phenotype reported for a null mutant of the calcium-activated K+ channel slo-1(js379) (20). SLO-1 is a well-characterized effector for ethanol (28), with both inhibition (29) and facilitation (31) reported, depending on the assay and lipid environment. This alteration in the pattern of pharyngeal pumping was not discernible in the whole-animal feeding assay, most likely because these latter assays were constrained to measure the average frequency of pharyngeal pumps and do not have sufficient resolution to detect an altered pattern of activity. In the pharyngeal system, slo-1 is expressed in neurons and not in the muscle (32) and appears to be important for regulating the neurogenic drive for pharyngeal activity (20, 32). Therefore, these data are consistent with a low-dose (10 mM) ethanol-mediated inhibition of SLO-1 in the pharyngeal nervous system giving rise to slight disruption of coordinated network activity.
At 20 mM ethanol, a concentration just in excess of the UK and U.S. drink-drive limit, still no observable effect was found on feeding behavior in the intact worm. However, at the cellular level, significant, albeit small, stimulatory effects on the frequency of activity in the pharyngeal network were found. It is likely that the subtle nature of these effects precluded their detection in the less-sensitive intact organismal assay. Furthermore, a marked temporal aspect to the excitation was found, so that it was initially greater with the effect waning over a relatively short time course of just a few minutes.
At 50 mM ethanol, a concentration that is profoundly intoxicating in humans, the stimulatory action of ethanol on pharyngeal action potential frequency became more apparent and was accompanied by an increase in pharyngeal pumping rate observed in both the EPG assay and the intact animal feeding behavioral assay. Thus, at 50 mM ethanol, good parity was found among the cellular, neural network, and behavioral responses. The stimulatory effect of 50 mM ethanol on pharyngeal action potential frequency was absent in the calcium-activated K+ channel mutant slo-1(js379), which further suggests a role for this channel, either directly or indirectly, in mediating the effects of ethanol. The concentration at which ethanol elicits this effect in C. elegans pharynx is equivalent to the concentration that modulates mammalian BK channels (29) and further supports a role for calcium-activated K+ channels in mediating the intoxicating actions of ethanol. At a mechanistic level, there is the possibility for ethanol to act as either a facilitator or inhibitor of SLO-1 signaling in the pharyngeal neural network to bring about this excitation. The observation that the pharyngeal phenotype of slo-1(js379) is similar to that of the effect of low-dose ethanol (20, 32) is consistent with the suggestion that, in this system, ethanol is acting as an antagonist of SLO-1 function and that mutation in slo-1 occludes the ethanol effect. Nonetheless, an agonist action at SLO-1 would not be incompatible with increased network activity as discussed in Atkinson (33). Notably, the slo-1 dependence of the low-dose stimulatory effect of ethanol was observed at the level of the pharyngeal network, but not in the intact organism feeding assay. This finding suggests that other effectors are involved in regulating this response to ethanol beyond the pharyngeal network.
At 50 mM ethanol, effects on the shape of the EPG waveform were found as well, including a shortening of pump duration. In the pharyngeal network, pump duration is tightly regulated by signaling through inhibitory glutamate signaling mediated by glutamate-gated chloride channels (21), and the effect on pump duration suggests a facilitation of this inhibitory signaling. The nematode GluCl channels are related to mammalian inhibitory GABA-A and glycine-gated chloride channels (34), which are known to be sensitive to enhancement of function by ethanol (2). Thus, our data suggest that this mechanism of action may be conserved in a C. elegans ligand-gated chloride channel.
Above 50 mM BAC in humans, the effects of alcohol become more severe, and sedation and anesthesia are rapidly followed by lethality, with the LD50 at 87 mM (3). Remarkably, in C. elegans at 150 mM, the pharyngeal muscle could still maintain a rhythmic contraction–relaxation cycle, although the shape of the waveform was altered. Furthermore, the worms could still feed at a normal rate on food. However, after prolonged withdrawal from food in the presence of ethanol, clear reduction in the rate of feeding was found, which suggests that either the increased duration of exposure and/or the additional stressor of food removal rendered the behavior susceptible to an ethanol inhibition.
There was a disconnect between the behavioral inhibition observed at 150 and 300 mM ethanol and the effect of ethanol at the cellular level, which was an excitation. This led us to question whether there was uncoupling of cellular activity from the pharyngeal organ and feeding behavior mediated by ethanol inhibition of gap-junction coupling (35). C. elegans expresses a family of gap junctions of which a subset are found in the pharyngeal muscle (35, 36) and may present a target for ethanol. Furthermore, acute ethanol depresses coupling of mammalian gap junctions (37). We have shown that in C. elegans pharynx, ethanol exposure delayed dye coupling between the muscle cells. This finding was mimicked by application of the gap-junction blocker carbenoxolone, which caused a similar but not identical effect to ethanol in the EPG recordings. Taken together, these observations suggest that inhibition of gap-junction coupling by ethanol contributes to its inhibitory effects on feeding behavior. In mammalian brain, evidence also indicates gap-junction inhibition that contributes to alcohol intoxication (38).
At 300 mM ethanol, a concentration that is supralethal in humans, worms exhibit profoundly inhibited behavior, with reduced egg-laying, locomotion (7, 25), chemotaxis (9), and pharyngeal pumping (24). In the pharyngeal muscle, this high concentration affects the biophysical properties of the muscle membrane, which causes a membrane depolarization. This condition was accompanied by a marked disruption in the pharyngeal action potential waveform, with the most notable effect being a reduction in amplitude. The latter observation would be consistent with an effect on calcium channel conductance. Two calcium channel currents have been identified as being required for the initiation phase of the pharyngeal muscle action potential, CCA-1, which encodes a T-type calcium channel, and EGL-19, which encodes an L-type calcium channel (39, 40). Ethanol has been reported as depressing both of these types of voltage-activated calcium conductance in the mammalian system at concentrations equivalent to those that produced a change in the amplitude of the pharyngeal muscle action potential (41). We conducted EPG analysis of cca-1(ad1650). The EPG waveform of cca-1 did not phenocopy the effects of ethanol on wild-type pharynx and 300 mM ethanol elicited an inhibition that was indistinguishable from the effect on wild-type worms (Supplemental Fig. 1A). However, this finding does not rule out a contributory role for CCA-1 in mediating the effects of ethanol. Rather, it might indicate the difficulty in resolving the interaction of ethanol with specific ion channels in a system in which it is acting through many diverse multiple effectors. Further studies either using whole-cell patch-clamp studies or heterologous expression of the recombinant channel would be required to resolve this point. The effect of ethanol on the resting membrane potential likely reflects a block of K+ conductance, as the membrane potential is largely determined by the K+ equilibrium (18). In mammalian systems, K+ channels have a variable sensitivity to ethanol (2, 42, 43). In C. elegans, the K+ channel EXP-2 has an important role in shaping the pharyngeal action potential (39), and it is possible that an interaction of ethanol with EXP-2 might explain the high-dose inhibition of pharyngeal pumping. However, an exp-2 mutant (sa26ad1426) has a severely abnormal waveform that does not phenocopy the effects of ethanol on the EPG (Supplemental Fig. S1B) and suggests that ethanol inhibition of EXP-2 might not contribute to its actions on the pharynx.
The interrelated responses to ethanol from the cellular to behavioral level in C. elegans are consistent with earlier evidence that the cuticle of the worm does not present a significant diffusion barrier to ethanol and suggests that external dosing results in an equivalent internal concentration (24). The overarching indication is that in C. elegans, as in the mammalian brain, ethanol has pleiotropic effects that span intoxication through to sedation (Fig. 9). The data reinforce a role for calcium-activated K+ channels in low-dose effects of ethanol (29) but, important to note, also indicate that this finding is insufficient to explain a whole organismal response. High-dose effects are mediated in part by gap-junction blockade and correlate with profound behavioral inhibition. Furthermore, the characteristics of the responses to high-dose ethanol implicate both Ca2+ and K+ channels. By profiling the effect of ethanol from low to high doses, this study has provided a route to discriminate ethanol intoxication from sedation and anesthesia and represents an important benchmark for the deployment of C. elegans as a model for human alcohol use disorders.
Figure 9.

Comparison of human BAC and effective ethanol concentration in C. elegans. aRef. 3. bPresent study. cRef. 25. dRef. 24. eRef. 44.
Supplementary Material
Acknowledgments
This work was supported in part by grant BB/E022251/1 from the Biotechnology and Biological Sciences Research Council (BBSRC), UK. B.I. received funding from the Gerald Kerkut Charitable Trust. C. elegans slo-1(js379) was provided by the Caenorhabditis elegans Genetics Center (Minneapolis, MN, USA), funded by the U.S. National Institutes of Health (NIH) Office of Research Infrastructure Programs (P40 OD010440).
This article includes supplemental data. Please visit http://www.fasebj.org to obtain this information.
- BAC
- blood alcohol concentration
- BK
- big potassium
- EPG
- electropharyngeogram
REFERENCES
- 1. Morgan M., Ritson E. (2010) Alcohol and Health, Medical Council on Alcohol, London [Google Scholar]
- 2. Harris R. A., Trudell J. R., Mihic S. J. (2008) Ethanol's molecular targets. Sci. Signal 1, re7. [DOI] [PMC free article] [PubMed] [Google Scholar]
- 3. Koob G. F., Le Moal M. (2006) Alcohol. In Neurobiology of Addiction, pp. 173–241, Elsevier, London [Google Scholar]
- 4. Castro P. V., Khare S., Young B. D., Clarke S. G. (2012) Caenorhabditis elegans battling starvation stress: low levels of ethanol prolong lifespan in L1 larvae. PLoS ONE 7, e29984. [DOI] [PMC free article] [PubMed] [Google Scholar]
- 5. Davis J. R., Li Y., Rankin C. H. (2008) Effects of developmental exposure to ethanol on Caenorhabditis elegans. Alcohol. Clin. Exp. Res. 32, 853–867 [DOI] [PubMed] [Google Scholar]
- 6. Lin C. H., Sa S., Chand J., Rankin C. H. (2013) Dynamic and persistent effects of ethanol exposure on development: an in vivo analysis during and after embryonic ethanol exposure in Caenorhabditis elegans. Alcohol. Clin. Exp. Res. 37, E190–E198 [DOI] [PubMed] [Google Scholar]
- 7. Morgan P. G., Sedensky M. M. (1995) Mutations affecting sensitivity to ethanol in the nematode, Caenorhabditis elegans. Alcohol. Clin. Exp. Res. 19, 1423–1429 [DOI] [PubMed] [Google Scholar]
- 8. Kwon J. Y., Hong M., Choi M. S., Kang S., Duke K., Kim S., Lee S., Lee J. (2004) Ethanol-response genes and their regulation analyzed by a microarray and comparative genomic approach in the nematode Caenorhabditis elegans. Genomics 83, 600–614 [DOI] [PubMed] [Google Scholar]
- 9. Mitchell P., Mould R., Dillon J., Glautier S., Andrianakis I., James C., Pugh A., Holden-Dye L., O'Connor V. (2010) A differential role for neuropeptides in acute and chronic adaptive responses to alcohol: Behavioural and genetic analysis in Caenorhabditis elegans. PLoS ONE 5, e10422. [DOI] [PMC free article] [PubMed] [Google Scholar]
- 10. Bettinger J. C., Leung K., Bolling M. H., Goldsmith A. D., Davies A. G. (2012) Lipid environment modulates the development of acute tolerance to ethanol in Caenorhabditis elegans. PLoS ONE 7, e35192. [DOI] [PMC free article] [PubMed] [Google Scholar]
- 11. Félix M.-A., Braendle C. (2010) The natural history of Caenorhabditis elegans. Curr. Biol. 20, R965–R969 [DOI] [PubMed] [Google Scholar]
- 12. Cutter A. D., Yan W., Tsvetkov N., Sunil S., Félix M.-A. (2010) Molecular population genetics and phenotypic sensitivity to ethanol for a globally diverse sample of the nematode Caenorhabditis briggsae. Mol. Ecol. 19, 798–809 [DOI] [PubMed] [Google Scholar]
- 13. Franks C., Holden-Dye L., Bull K., Luedtke S., Walker R. (2006) Anatomy, physiology and pharmacology of Caenorhabditis elegans pharynx: a model to define gene function in a simple neural system. Inv. Neurosci. 6, 105–122 [DOI] [PubMed] [Google Scholar]
- 14. Scholz H., Mustard J. (2013) Invertebrate models of alcoholism. In Behavioral Neurobiology of Alcohol Addiction (Sommer W. H., Spanagel R., eds.) Vol. 13, pp. 433–457, Springer Berlin, Heidelberg, Germany [Google Scholar]
- 15. Avery L., Shtonda B. B. (2003) Food transport in the C. elegans pharynx. J. Exp. Biol. 206, 2441–2457 [DOI] [PMC free article] [PubMed] [Google Scholar]
- 16. Raizen D. M., Avery L. (1994) Electrical activity and behavior in the pharynx of Caenorhabditis elegans. Neuron 12, 483–495 [DOI] [PMC free article] [PubMed] [Google Scholar]
- 17. Cook A., Franks C. J., Holden-Dye L. (2006) Electrophysiological recordings from the pharynx. WormBook 10.1895/wormbook.1.110.1 [DOI] [PMC free article] [PubMed] [Google Scholar]
- 18. Franks C. J., Pemberton D., Vinogradova I., Cook A., Walker R. J., Holden-Dye L. (2002) Ionic basis of the resting membrane potential and action potential in the pharyngeal muscle of Caenorhabditis elegans. J. Neurophysiol. 87, 954–961 [DOI] [PubMed] [Google Scholar]
- 19. Brenner S. (1974) The genetics of Caenorhabditis elegans. Genetics 77, 71–94 [DOI] [PMC free article] [PubMed] [Google Scholar]
- 20. Dillon J., Andrianakis I., Bull K., Glautier S., O'Connor V., Holden-Dye L., James C. (2009) AutoEPG: Software for the analysis of electrical activity in the microcircuit underpinning feeding behaviour of Caenorhabditis elegans. PLoS ONE 4, e8482. [DOI] [PMC free article] [PubMed] [Google Scholar]
- 21. Avery L. (1993) Motor neuron M3 controls pharyngeal muscle relaxation timing in Caenorhabditis elegans. J. Exp. Biol. 175, 283–297 [DOI] [PubMed] [Google Scholar]
- 22. Pemberton D., Franks C., Walker R., Holden-Dye L. (2001) Characterization of glutamate-gated chloride channels in the pharynx of wild-type and mutant Caenorhabditis elegans delineates the role of the subunit GluCl-alpha2 in the function of the native receptor. Mol. Pharmacol. 59, 1037–1043 [DOI] [PubMed] [Google Scholar]
- 23. Avery L., Horvitz H. (1990) Effects of starvation and neuroactive drugs on feeding in Caenorhabditis elegans. J. Exp. Zool. 253, 263–270 [DOI] [PubMed] [Google Scholar]
- 24. Mitchell P. H., Bull K., Glautier S., Hopper N. A., Holden-Dye L., O'Connor V. (2007) The concentration-dependent effects of ethanol on Caenorhabditis elegans behaviour. Pharmacogenomics J. 7, 411–417 [DOI] [PubMed] [Google Scholar]
- 25. Davies A. G., Pierce-Shimomura J. T., Kim H., VanHoven M. K., Thiele T. R., Bonci A., Bargmann C. I., McIntire S. L. (2003) A central role of the BK potassium channel in behavioral responses to ethanol in C. elegans. Cell 115, 655–666 [DOI] [PubMed] [Google Scholar]
- 26. Avery L., Raizen D., Lockery S. (1995) Electrophysiological methods. Methods Cell Biol. 48, 251–269 [PMC free article] [PubMed] [Google Scholar]
- 27. Sagar G. D. V., Larson D. M. (2006) Carbenoxolone inhibits junctional transfer and upregulates connexin43 expression by a protein kinase A-dependent pathway. J. Cell. Biochem. 98, 1543–1551 [DOI] [PubMed] [Google Scholar]
- 28. Crowder C. M. (2004) Ethanol targets: a BK channel cocktail in C. elegans. Trends Neurosci. 27, 579–582 [DOI] [PubMed] [Google Scholar]
- 29. Liu J., Bukiya A. N., Kuntamallappanavar G., Singh A. K., Dopico A. M. (2013) Distinct sensitivity of Slo1 channel proteins to ethanol. Mol. Pharmacol. 83, 235–244 [DOI] [PMC free article] [PubMed] [Google Scholar]
- 30. Wang Z.-W., Saifee O., Nonet M. L., Salkoff L. (2001) SLO-1 potassium channels control quantal content of neurotransmitter release at the C. elegans neuromuscular junction. Neuron 32, 867–881 [DOI] [PubMed] [Google Scholar]
- 31. Yuan C., Chen M., Covey D. F., Johnston L. J., Treistman S. N. (2011) Cholesterol tuning of BK ethanol response is enantioselective, and is a function of accompanying lipids. PLoS ONE 6, e27572. [DOI] [PMC free article] [PubMed] [Google Scholar]
- 32. Chiang J.-T. A., Steciuk M., Shtonda B., Avery L. (2006) Evolution of pharyngeal behaviors and neuronal functions in free-living soil nematodes. J. Exp. Biol. 209, 1859–1873 [DOI] [PubMed] [Google Scholar]
- 33. Atkinson N. S. (2009) Tolerance in Drosophila. J. Neurogenetics 23, 293–302 [DOI] [PMC free article] [PubMed] [Google Scholar]
- 34. Cully D. F., Vassilatis D. K., Liu K. K., Paress P. S., Van der Ploeg L. H. T., Schaeffer J. M., Arena J. P. (1994) Cloning of an avermectin-sensitive glutamate-gated chloride channel from Caenorhabditis elegans. Nature 371, 707–711 [DOI] [PubMed] [Google Scholar]
- 35. Starich T. A., Lee R. Y., Panzarella C., Avery L., Shaw J. E. (1996) eat-5 and unc-7 represent a multigene family in Caenorhabditis elegans involved in cell-cell coupling. J. Cell Biol. 134, 537–548 [DOI] [PMC free article] [PubMed] [Google Scholar]
- 36. Altun Z. F., Chen B., Wang Z.-W., Hall D. H. (2009) High resolution map of Caenorhabditis elegans gap junction proteins. Dev. Dynamics 238, 1936–1950 [DOI] [PMC free article] [PubMed] [Google Scholar]
- 37. Adermark L., Olsson T., Hansson E. (2004) Ethanol acutely decreases astroglial gap junction permeability in primary cultures from defined brain regions. Neurochem. Int. 45, 971–978 [DOI] [PubMed] [Google Scholar]
- 38. Steffensen S. C., Bradley K. D., Hansen D. M., Wilcox J. D., Wilcox R. S., Allison D. W., Merrill C. B., Edwards J. G. (2011) The role of connexin-36 gap junctions in alcohol intoxication and consumption. Synapse 65, 695–707 [DOI] [PMC free article] [PubMed] [Google Scholar]
- 39. Shtonda B., Avery L. (2005) CCA-1, EGL-19 and EXP-2 currents shape action potentials in the Caenorhabditis elegans pharynx. J. Exp. Biol. 208, 2177–2190 [DOI] [PMC free article] [PubMed] [Google Scholar]
- 40. Steger K. A., Shtonda B. B., Thacker C., Snutch T. P., Avery L. (2005) The C. elegans T-type calcium channel CCA-1 boosts neuromuscular transmission. J. Exp. Biol. 208, 2191–2203 [DOI] [PMC free article] [PubMed] [Google Scholar]
- 41. Twombly D. A., Herman M. D., Kye C. H., Narahashi T. (1990) Ethanol effects on two types of voltage-activated calcium channels. J. Pharmacol. Exp. Therap. 254, 1029–1037 [PubMed] [Google Scholar]
- 42. Blednov Y. A., Stoffel M., Alva H., Harris R. A. (2003) A pervasive mechanism for analgesia: activation of GIRK2 channels. Proc. Natl. Acad. Sci. U. S. A. 100, 277–282 [DOI] [PMC free article] [PubMed] [Google Scholar]
- 43. Covarrubias M., Rubin E. (1993) Ethanol selectively blocks a noninactivating K+ current expressed in Xenopus oocytes. Proc. Natl. Acad. Sci. U. S. A. 90, 6957–6960 [DOI] [PMC free article] [PubMed] [Google Scholar]
- 44. Graham M. E., Edwards M. R., Holden-Dye L., Morgan A., Burgoyne R. D., Barclay J. W. (2009) UNC-18 modulates ethanol sensitivity in Caenorhabditis elegans. Mol. Biol. Cell 20, 43–55 [DOI] [PMC free article] [PubMed] [Google Scholar]
Associated Data
This section collects any data citations, data availability statements, or supplementary materials included in this article.