

Abstract
Although differences in breeding lifespan are an important source of variation in male fitness, the factors affecting the breeding tenure of males have seldom been explored. Here, we use cross-species comparisons to investigate the correlates of breeding lifespan in male mammals. Our results show that male breeding lifespan depends on the extent of polygyny, which reflects the relative intensity of competition for access to females. Males have relatively short breeding tenure in species where individuals have the potential to monopolize mating with multiple females, and longer ones where individuals defend one female at a time. Male breeding tenure is also shorter in species in which females breed frequently than in those where females breed less frequently, suggesting that the costs of guarding females may contribute to limiting tenure length. As a consequence of these relationships, estimates of skew in male breeding success within seasons overestimate skew calculated across the lifetime and, in several polygynous species, variance in lifetime breeding success is not substantially higher in males than in females.
Keywords: mating system, reproductive skew, lifetime breeding success, mammals
1. Introduction
The reproductive success of male mammals varies widely [1,2], partly as a consequence of variation in mating rate and partly as a result of contrasts in longevity [1,3]. While many studies have explored the extent and causes of variation in mating rate among males within breeding seasons [4–7], relatively few have investigated the extent and causes of variation in the breeding lifespan of males [8]. Intraspecific comparisons of the breeding tenure of males show that the breeding lifespan of individual males is reduced when the intensity of competition over females is high [9,10]. Males defending large numbers of females may be faced with more frequent challenges by competitors, so that the probability that they will be displaced is relatively high [11,12]. As a result of frequent challenges, they may also experience increased risks of injury or energetic costs which reduce the chance that they will win repeated interactions [13,14]. Allocation of resources to secondary sexual characteristics or physiological traits associated with reproductive competition may also reduce the potential allocation of resources by males to somatic maintenance [15].
One consequence of the effects of male competition on the duration of male breeding tenure is that, in polygynous animals, male breeding success is often restricted to a relatively small number of years when individuals are in their prime [1,4,16–18]. As a result, estimates of standardized variance in male breeding success within years (or reproductive skew) will usually overestimate standardized variance in male success calculated over the lifetime of individuals [1,19]. As breeding in females is usually distributed across a longer period and females may show consistent individual differences in breeding success, this suggests that estimates of sex differences in reproductive skew based on data on particular seasons may often overestimate sex differences in lifetime skew by a substantial margin [20–22].
While interspecific comparisons show that the breeding tenure of male mammals is negatively associated with the degree of polygyny [8], there have been few recent attempts to examine the distribution of sex differences in fitness variance since before 1990 [1]. A wider range of genetic data are now available. Here, we use phylogenetic comparative approaches to investigate the extent and potential causes of species differences in male breeding tenure length among mammals and their effects on variation in male lifetime breeding success. We focus on mammals partly because the relative influence of competition between males varies widely between breeding systems and partly because estimates of male breeding tenure are available for a substantial number of species. In addition, the median number of months that dominant males retain their tenure has been shown to be a good estimator of male breeding lifespan, as males sire only few offspring outside their period of dominance [6].
We first test whether interspecific differences in median male breeding tenure length are related to maximum longevity, annual survival and the age of first reproduction in females in order to determine whether male breeding tenure length is correlated with variation in the pace of reproduction or breeding lifespan of females [8]. Subsequently, we investigate whether male breeding tenure length is related to factors that are likely to affect the intensity and frequency of competition between males, including the number of females that males can potentially monopolize and the rate at which females give birth. Finally, we assess how mating rate and breeding lifespan affect variance in male lifetime fitness and compare measures of variation in lifetime breeding success in females and males for different mating systems.
2. Material and methods
Information on male breeding tenure length was collected by searching ‘Web of Science ISI’, recording the median number of months males retain the dominant position in social groups based on records of populations in the wild (see also [23]). Breeding tenure was defined to start once a male obtains a dominant position, either by taking over a group of females or after queuing for dominance within a group, and ends after he is displaced by another male and does not successfully attain dominance again in the same or in another group. The start of males’ breeding lifespan is usually several months or years after they reach adulthood, and males might survive after their breeding lifespan has ended. Data for the length of the inter-birth interval, maximum lifespan (separating records from the wild and captivity), age at first reproduction and population density were drawn from published datasets [24,25]. We extracted data on adult survival in wild populations calculated across all ages from previous comparative studies [26,27]. We recorded the degree of sexual dimorphism in body mass as a proxy for physical competition [28–31] and testes mass relative to body mass as proxy for sperm competition [32]. Data on the number of breeding adult females and males per group were extracted from the papers reporting male breeding tenure length or references cited there to match them to the specific population, and we checked that values did not represent outliers for the respective species by comparing them to published reviews [33]. We recorded whether a single male and a single female monopolize reproduction (monogamous), whether a single male resides with several breeding females (harem), or whether multiple males and females live in social groups (multimale/polygynandrous). Information on the reproductive share of alpha males was obtained from [6] and used as measure of reproductive skew in groups. In addition, for a number species which have been the subject of long-term studies, and for which paternity has been determined using genetic methods, we extracted information on the lifetime breeding success of males and females by counting the number of offspring assigned to individual males and females. We recorded whether assigned offspring were pre- or post-weaning. As all studies sample offspring after the most critical period of early offspring mortality, developmental stage did not seem to consistently bias the measure of variance in lifetime breeding success or affect the results, and we present the results from the full dataset. When the information did not specifically list the proportion of non-breeding individuals, we estimated these given the number of surviving offspring that were reported for the breeding individuals and calculated the standardized variance in lifetime breeding success across both breeders and non-breeders. The full dataset with references is listed in the electronic supplementary material. All continuous variables were log-transformed prior to analyses.
We performed multivariate generalized least-squares regressions on the life-history variables while correcting for phylogenetic relationships. Regressions were performed in R with functions of the packages caper [34] and geiger [35] (function ‘pgls’ and ‘gls’ with a correlation structure estimated by the function corPagel), using maximum likelihood to estimate the best value of Pagel's λ, and with MCMCglmm [36]. The three methods identified the same model as best explaining the data in all cases, and below we only report the results using the function ‘pgls’. These methods include the phylogenetic similarity of species as a covariance matrix, which we calculated based on the updated mammalian supertree [37] using functions of the package APE [38] to truncate the tree. We first compared the effect of each life-history factor separately in explaining variation in male breeding tenure length to null models. Significance of terms was assessed based on a comparison of Akaike (for gls) and deviance (for MCMCglmm) information criterion values. Next, we assessed whether any model that included interactions between the factors provided a better explanation of the data, comparing different combinations using the function ‘dredge’ as implemented in the package ‘MuMIn’ [39]. Tables showing model comparisons are provided in the electronic supplementary material.
3. Results
Across 61 species of mammals for which observational data on variation in male breeding success were available (see the electronic supplementary material), median breeding tenure of males varied between nine and 144 months. Closely related taxa have similar tenure length and there is a detectable phylogenetic signal (maximum-likelihood estimation of λ = 0.87 (95% confidence interval: 0.71–0.97), where 1.00 indicates a perfect fit to the phylogenetic tree). However, the best explanatory models described below indicate that there is no residual phylogenetic signal, suggesting that male breeding tenure length adapts to changes in life history and social structure with little evolutionary lag. Contrasts in male breeding tenure length do not appear to reflect species’ differences in the risk of extrinsic mortality, as variation in male breeding tenure length across species is not associated with maximum longevity in either sex (n = 58 species, λ = 0.84, AICc = −18.0 versus AICc of null model = −16.7) (figure 1) or with rates of adult survival in wild populations (n = 23 species, λ = 0.75, AICc = 13.5 versus AICc of null model = 10.4; for full model comparisons, see the electronic supplementary material).
Figure 1.

Male breeding tenure length increases with the length of the inter-birth interval. Across mammalian species, the length of time a dominant male manages to maintain his tenure (measured in months) increases as the inter-birth interval of females increases (panel (a), measured in months). This association is not a consequence of constraints on tenure length owing to senescence as a consequence of the faster or slower life history of a species, as male breeding tenure length is not correlated with maximum longevity (panel (b), measured in months).
Across the 61 species, contrasts in male breeding tenure length are consistently associated with: (i) the average duration of inter-birth intervals among females (n = 61 species, λ = 0.66, AICc = −46.3 versus AICc of null model = −16.6, r2 = 0.47), with males remaining dominant for an average of three breeding seasons (range 1–7) (figure 1); (ii) the average number of females per breeding group (model including inter-birth interval and number of females per group: n = 61 species, λ = 0.50, r2 = 0.58, AICc = −58.4 versus AICc of model including only inter-birth interval −46.3); and (iii) whether groups contain a single or multiple males (including single- versus multimale system as a factor in the correlation: n = 61 species, λ = 0.36, r2 = 0.64, AICc = −61.9 versus −58.4), with male breeding tenures being shorter in species with monogamous and harem systems and longer in multimale species (figure 2).
Figure 2.
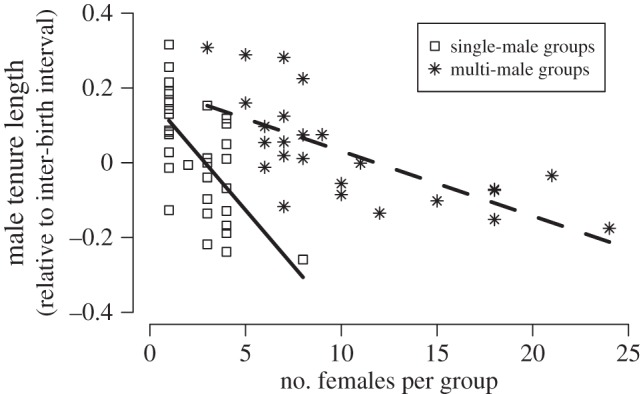
Male breeding tenure length decreases as the number of females per group increases. Males maintain their dominant position longer in species in which there are only few females in the group. For a given number of females in the group, tenure lengths are shorter in species in which groups contain only a single male (open squares) compared with species in which groups contain multiple females and multiple males (stars). For comparison, tenure length has been adjusted for the length of the inter-birth interval of the species.
Among species in which groups contain a single breeding male, the length of the inter-birth intervals and the number of females in the group explain about 81% of the variation in male breeding tenure length. The tenure of dominants is reduced by approximately 30% of an inter-birth interval for each additional female in the group: changes from a single female (monogamy) to two females have similar effects to those of additional increases in female group size. For species living in social groups with multiple males, the best model explaining variation in tenure length included the inter-birth interval, the number of females in the group and the sex ratio in the group, explaining about 84% of the variation. Across species with multiple males per group, male breeding tenure lengths are shorter in species in which groups contain a higher number of females, each additional female leading to a decrease of approximately 10% of an inter-birth interval. The effect of the sex ratio in the group is independent of changes in female number so that, for a given sex ratio, males have longer tenures in smaller groups. This suggests that dominants may be able to defend a certain proportion of females in the group, rather than a certain number: for example, if the sex ratio is one female per male, the dominant male might defend 50% of the females and therefore have a higher mating success and shorter tenure if groups contain more females.
In groups containing multiple males, male breeding tenure is not associated with the number of males in the group, the proportion of alpha male paternity, relative testes size or the degree of sexual dimorphism in body weight, although these factors are highly correlated among themselves. As the number of male competitors in the group increases, the proportion of offspring dominant males sire in a group declines (n = 14 species, λ = 0.0, r2 = 0.67, AICc = 122.0 versus null model AICc 134.8), sexual dimorphism decreases (n = 31 species, λ = 0.93, r2 = 0.32, AICc 151.7 versus null model AICc 161.1) and relative testes sizes increase (n = 14 species, λ = 0.0, r2 = 0.75, AICc = 44.9 versus 46.5). Male breeding tenure length does not differ between species in which males immigrate with relatives (as in lions) and species in which males immigrate individually and join a queue of unrelated males (as in savannah baboons).
The presence of a strong negative correlation between male breeding tenure length and the number of females per group suggests that measures of variation in reproductive skew among adult males based on data collected in single seasons will overestimate variation in lifetime breeding success. Measures of standardized variance in lifetime breeding success in both sexes are available for few species, but the data available suggest that reproductive skew among males measured within single breeding seasons is not a consistent predictor of standardized variance in male lifetime breeding success (r2 = 0.03, p = 0.29, n = 10 species), with large values in skew consistently overestimating variance in male lifetime breeding success. Similarly, variation in breeding tenure explains only a limited portion of the species differences in standardized variance in male lifetime breeding success (r2 = 0.17, p = 0.11, n = 12 species). While reproductive skew among females measured within single breeding seasons also does not predict species differences in standardized variance in female lifetime breeding success (r2 = 0.30, p = 0.12, n = 7 species), differences in female breeding lifespan explain a large proportion of the species differences in standardized variance in female lifetime breeding success (r2 = 0.58, p = 0.002, n = 12 species).
Across the 15 species in our sample, skew in male lifetime breeding success does not consistently exceed skew in female lifetime breeding success (V = 28, p = 0.07, n = 15 species) (figure 3a). This is partly owing to the high values in the standardized variance in lifetime breeding success of females observed in cooperatively breeding species, like the meerkat and red wolf (figure 3b), whereas in polygynous species skew in lifetime breeding success appears to be higher in males than in females. For both females and males, skew in lifetime breeding success is not consistently higher in species with polygynous compared with monogamous breeding systems (males: W = 23, p = 0.95; females: W = 32, p = 0.21).
Figure 3.
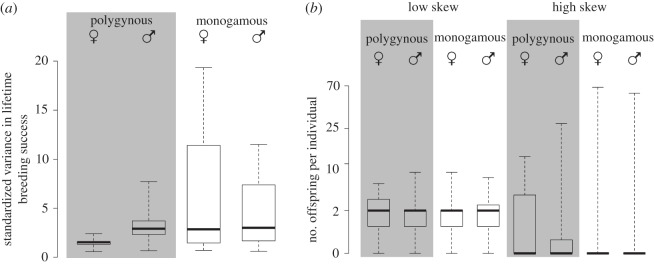
Standardized variance in lifetime breeding success of females and males in polygynous and monogamous breeding systems. Data on variance in lifetime breeding success of both females and males are available for 15 mammalian species, of which four species are monogamous (gibbons, red wolf, white-footed mice, meerkat). While in most species with polygynous breeding males have higher skew in lifetime breeding success than females (a), the difference is not very pronounced. Skew in male lifetime breeding success in species with monogamous breeding is not distinct from and can be both lower and higher than in polygynous species. High variance in lifetime breeding success arises in some species where certain individuals can produce a large number of offspring (b, note that values are on a log-scale), but high and low skew can occur in both females or males in either breeding system (species from left to right: chimpanzee, sifaka, gibbon, gibbon, Japanese macaque, red deer, meerkat and meerkat).
4. Discussion
Our findings show that median male breeding tenure varies from less than 1 up to 12 years between species and is an important determinant of differences in male lifetime breeding success. Male breeding tenure lengths are shorter in species in which dominant males have the potential to defend a larger number of females during breeding seasons, as changes in the number of females and the sex composition of social groups are associated with interspecific contrasts in male breeding lifespan. The presence of a strong negative correlation between male breeding tenure length and the number of females per group suggests that measures of variation in reproductive skew among adult males based on data collected in single seasons will overestimate variation in lifetime breeding success. Our data on observed standardized variance in lifetime breeding success of females and males provide support to earlier studies which questioned whether variation in breeding success is consistently greater in males than females [1,12,19,22,40].
The median duration of male breeding tenure is unrelated to most life-history parameters. In most mammalian species, male breeding tenures are substantially shorter than the breeding lifespans of females [8]. This supports previous suggestions that sexual selection might act differently on males and females. Females are predicted to experience selection which either favours the rapid production of offspring which themselves reproduce quickly or which maximizes the number of breeding attempts [41]. As expected, we find that contrasts in breeding lifespan explained interspecific differences in the variance in lifetime skew in females but not in males. However, as the frequency and intensity of competition over access to females appears to limit male breeding lifespan, neither reproductive skew nor breeding tenure provides sufficient estimates of the intensity of sexual selection in males. While our results extend findings in intraspecific studies to show that contrasts between species are shaped by similar trade-offs between mating competition and male breeding tenure, more detailed long-term studies will be needed to reveal the underlying proximate cause for this relationship.
Previous studies have suggested that as male breeding tenure is relatively short in many species and is strongly affected by differences in age, estimates of standardized variation in male breeding success calculated across adults within seasons are likely to substantially overestimate variation in lifetime breeding success [1,11], and some studies have argued that the variation in male fitness may not necessarily exceed variation of female lifetime breeding success [42,43]. Our sample of data on standardized variance in lifetime breeding success in males and females support these suggestions that the values for males may not be substantially higher than for females in polygynous species, whereas in monogamous species maximum values for females frequently exceed values for males as a result of shorter male lifespans.
These findings are relevant to our understanding of sex differences in the operation of sexual selection. The evolution of sex differences in morphology and behaviour is often explained as a consequence of increased variance in male fitness generating stronger selection pressures on traits used to compete over reproductive success in males than females. While variance in male fitness may exceed variance in female fitness in polygynous species, the available evidence of variance in lifetime breeding success in males and females suggest that the extent of sex differences in variance in fitness may not be large or consistent. These results suggest that the evolution of sex differences in morphology and behaviour may depend to a greater extent on the form of reproductive competition in males and females [44] and on the relative strength of selection operating on particular traits [12,19]. While the degree of sexual selection might be similar between the sexes and across mating systems, selection might target different traits that permit individuals to increase their breeding success. The frequently poor relationship between breeding systems and sexual dimorphism as well as the development of male weaponry or secondary sexual traits in species where variance in female breeding success exceeds variance in male breeding success [45] may be explained if in many species males still face more physical competition to increase breeding success.
Acknowledgements
We thank E. Huchard and everyone in the Large Animal Research Group in Cambridge for helpful discussions.
Data accessibility
All data and references are provided in the electronic supplementary material (electronic supplementary material, table S1).
Funding statement
The Leverhulme Trust, the Isaac Newton Trust and the European Research Council provided the funding for this study.
References
- 1.Clutton-Brock TH. (ed.) 1988. Reproductive success: studies of individual variation in contrasting breeding systems. Chicago, IL: University of Chicago Press. [Google Scholar]
- 2.Shuster SM, Wade MJ. 2003. Mating systems and strategies. Princeton, NJ: Princeton University Press. [Google Scholar]
- 3.Ellis L. 1995. Dominance and reproductive success among nonhuman animals: a cross-species comparison. Ethol. Sociobiol. 16, 257–333. ( 10.1016/0162-3095(95)00050-U) [DOI] [Google Scholar]
- 4.Kutsukake N, Nunn CL. 2006. Comparative tests of reproductive skew in male primates: the roles of demographic factors and incomplete control. Behav. Ecol. Sociobiol. 60, 695–706. ( 10.1007/s00265-006-0213-1) [DOI] [Google Scholar]
- 5.Ostner J, Nunn CL, Schülke O. 2008. Female reproductive synchrony predicts skewed paternity across primates. Behav. Ecol. 19, 1150–1158. ( 10.1093/beheco/arn093) [DOI] [PMC free article] [PubMed] [Google Scholar]
- 6.Soulsbury CD. 2010. Genetic patterns of paternity and testes size in mammals. PLoS ONE 5, e9581 ( 10.1371/journal.pone.0009581) [DOI] [PMC free article] [PubMed] [Google Scholar]
- 7.Gogarten JF, Koenig A. 2013. Reproductive seasonality is a poor predictor of receptive synchrony and male reproductive skew among nonhuman primates. Behav. Ecol. Sociobiol. 67, 123–134. ( 10.1007/s00265-012-1432-2) [DOI] [Google Scholar]
- 8.Clutton-Brock TH, Isvaran K. 2007. Sex differences in ageing in natural populations of vertebrates. Proc. R. Soc. B 274, 3097–3104. ( 10.1098/rspb.2007.1138) [DOI] [PMC free article] [PubMed] [Google Scholar]
- 9.Prowse N, Partridge L. 1997. The effects of reproduction on longevity and fertility in male Drosophila melanogaster. J. Insect Physiol. 43, 501–512. ( 10.1016/S0022-1910(97)00014-0) [DOI] [PubMed] [Google Scholar]
- 10.Robinson MR, Pilkington JG, Clutton-Brock TH, Pemberton JM, Kruuk LE. 2006. Live fast, die young: trade-offs between fitness components and sexually antagonistic selection on weaponry in Soay sheep. Evolution 60, 2168–2181. ( 10.1111/j.0014-3820.2006.tb01854.x) [DOI] [PubMed] [Google Scholar]
- 11.Clutton-Brock TH, Guinness FE. 1982. Red deer: behavior and ecology of two sexes. Chicago, IL: University of Chicago Press. [Google Scholar]
- 12.Clutton-Brock TH, Huchard E. 2013. Social competition and selection in males and females. Phil. Trans. R. Soc. B 368, 20130074 ( 10.1098/rstb.2013.0074) [DOI] [PMC free article] [PubMed] [Google Scholar]
- 13.Goymann W, Wingfield JC. 2004. Allostatic load, social status and stress hormones: the costs of social status matter. Anim. Behav. 67, 591–602. ( 10.1016/j.anbehav.2003.08.007) [DOI] [Google Scholar]
- 14.Bonduriansky R, Maklakov A, Zajitschek F, Brooks R. 2008. Sexual selection, sexual conflict and the evolution of ageing and life span. Funct. Ecol. 22, 443–453. ( 10.1111/j.1365-2435.2008.01417.x) [DOI] [Google Scholar]
- 15.Hunt J, Brooks R, Jennions MD, Smith MJ, Bentsen CL, Bussiere LF. 2004. High-quality male field crickets invest heavily in sexual display but die young. Nature 432, 1024–1027. ( 10.1038/nature03084) [DOI] [PubMed] [Google Scholar]
- 16.Wiley RH. 1974. Evolution of social organization and life-history patterns among grouse. Q. Rev. Biol. 49, 201–227. ( 10.1086/408083) [DOI] [PubMed] [Google Scholar]
- 17.Coltman DW, Festa-Bianchet M, Jorgenson JT, Strobeck C. 2002. Age-dependent sexual selection in bighorn rams. Proc. R. Soc. Lond. B 269, 165–172. ( 10.1098/rspb.2001.1851) [DOI] [PMC free article] [PubMed] [Google Scholar]
- 18.Alberts SC, Watts HE, Altmann J. 2003. Queuing and queue-jumping: long-term patterns of reproductive skew in male savannah baboons, Papio cynocephalus. Anim. Behav. 65, 821–840. ( 10.1006/anbe.2003.2106) [DOI] [Google Scholar]
- 19.Clutton-Brock TH. 1983. Selection in relation to sex. In Evolution from molecules to men (ed. Bendall DS.), pp. 457–481. Cambridge, UK: Cambridge University Press. [Google Scholar]
- 20.Le Boeuf BJ, Reiter J. 1988. Lifetime reproductive success in northern elephant seals. In Reproductive success: studies of individual variation in contrasting breeding systems (ed. Clutton-Brock TH.), pp. 344–362. Chicago, IL: University of Chicago Press. [Google Scholar]
- 21.Coltman DW, Bancroft DR, Robertson A, Smith JA, Clutton-Brock TH, Pemberton JM. 1999. Male reproductive success in a promiscuous mammal: behavioural estimates compared with genetic paternity. Mol. Ecol. 8, 1199–1209. ( 10.1046/j.1365-294x.1999.00683.x) [DOI] [PubMed] [Google Scholar]
- 22.Gowaty PA. 2007. Sex differences in ageing in natural populations of mammals and birds. J. Biosci. 32, 1221–1222. ( 10.1007/s12038-007-0130-0) [DOI] [PubMed] [Google Scholar]
- 23.Lukas D, Clutton-Brock TH. 2011. Group structure, kinship, inbreeding risk and habitual female dispersal in plural-breeding mammals. J. Evol. Biol. 24, 2624–2630. ( 10.1111/j.1420-9101.2011.02385.x) [DOI] [PubMed] [Google Scholar]
- 24.Jones KE, et al. 2009. PanTHERIA: a species-level database of life history, ecology, and geography of extant and recently extinct mammals. Ecol. Archives E090–184 Ecology 90, 2648 ( 10.1890/08-1494.1) [DOI] [Google Scholar]
- 25.De Magalhaes JP, Costa J. 2009. A database of vertebrate longevity records and their relation to other life-history traits. J. Evol. Biol. 22, 1770–1774. ( 10.1111/j.1420-9101.2009.01783.x) [DOI] [PubMed] [Google Scholar]
- 26.Oli MK, Dobson FS. 2003. The relative importance of life-history variables to population growth rate in mammals: Cole's prediction revisited. Am. Nat. 161, 422–440. ( 10.1086/367591) [DOI] [PubMed] [Google Scholar]
- 27.McCarthy MA, Citroen R, McCall SC. 2008. Allometric scaling and Bayesian priors for annual survival of birds and mammals. Am. Nat. 172, 216–222. ( 10.1086/588074) [DOI] [PubMed] [Google Scholar]
- 28.Jarman P. 1983. Mating system and sexual dimorphism in large terrestrial, mammalian herbivores. Biol. Rev. 58, 485–520. ( 10.1111/j.1469-185X.1983.tb00398.x) [DOI] [Google Scholar]
- 29.Loison A, Gaillard JM, Pélabon C, Yoccoz NG. 1999. What factors shape sexual size dimorphism in ungulates? Evol. Ecol. Res. 1, 611–633. [Google Scholar]
- 30.Smith RJ, Cheverud JM. 2002. Scaling of sexual dimorphism in body mass: a phylogenetic analysis of Rensch's rule in primates. Int. J. Primatol. 23, 1095–1135. ( 10.1023/A:1019654100876) [DOI] [Google Scholar]
- 31.Isaac JL. 2005. Potential causes and life-history consequences of sexual size dimorphism in mammals. Mamm. Rev. 35, 101–115. ( 10.1111/j.1365-2907.2005.00045.x) [DOI] [Google Scholar]
- 32.Ramm SA, Stockley P. 2010. Sperm competition and sperm length influence the rate of mammalian spermatogenesis. Biol. Lett. 6, 219–221. ( 10.1098/rsbl.2009.0635) [DOI] [PMC free article] [PubMed] [Google Scholar]
- 33.Nunn CL, van Schaik CP, Zinner D. 2001. Do exaggerated sexual swellings function in female mating competition in primates? A comparative test of the reliable indicator hypothesis. Behav. Ecol. 12, 646–654. ( 10.1093/beheco/12.5.646) [DOI] [Google Scholar]
- 34.Orme CDL, Freckleton RP, Thomas GH, Petzoldt T, Fritz SA, Isaac N, Pearse W. 2012. caper: comparative analyses of phylogenetics and evolution in R. R package v. 0.5. See: http://cran.r-project.org/web/packages/caper/.
- 35.Harmon LJ, Weir JT, Brock CD, Glor RE, Challenger W. 2008. GEIGER: investigating evolutionary radiations. Bioinformatics 24, 129–131. ( 10.1093/bioinformatics/btm538) [DOI] [PubMed] [Google Scholar]
- 36.Hadfield JD, Nakagawa S. 2010. General quantitative genetic methods for comparative biology: phylogenies, taxonomies and multi-trait models for continuous and categorical characters. J. Evol. Biol. 23, 494–508. ( 10.1111/j.1420-9101.2009.01915.x) [DOI] [PubMed] [Google Scholar]
- 37.Fritz SA, Bininda-Emonds OR, Purvis A. 2009. Geographical variation in predictors of mammalian extinction risk: big is bad, but only in the tropics. Ecol. Lett. 12, 538–549. ( 10.1111/j.1461-0248.2009.01307.x) [DOI] [PubMed] [Google Scholar]
- 38.Paradis E, Claude J, Strimmer K. 2004. APE: analyses of phylogenetics and evolution in R language. Bioinformatics 20, 289–290. ( 10.1093/bioinformatics/btg412) [DOI] [PubMed] [Google Scholar]
- 39.Bartoń K. 2013. MuMIn: multi-model inference. R package v. 1.9. 0. See: http://cran.r-project.org/web/packages/MuMIn/. [Google Scholar]
- 40.Hauber ME, Lacey EA. 2005. Bateman's principle in cooperatively breeding vertebrates: the effects of non-breeding alloparents on variability in female and male reproductive success. Integr. Comp. Biol. 45, 903–914. ( 10.1093/icb/45.5.903) [DOI] [PubMed] [Google Scholar]
- 41.Bielby J, et al. 2007. The fast slow continuum in mammalian life history: an empirical reevaluation. Am. Nat. 169, 748–757. ( 10.1086/516847) [DOI] [PubMed] [Google Scholar]
- 42.Gowaty PA. 2004. Sex roles, contests for the control of reproduction, and sexual selection. In Sexual selection in primates: new and comparative perspectives (eds Kappeler PM, van Schaik C.), pp. 37–54. Cambridge, UK: Cambridge University Press. [Google Scholar]
- 43.Clutton-Brock T. 2007. Sexual selection in males and females. Science 318, 1882–1885. ( 10.1126/science.1133311) [DOI] [PubMed] [Google Scholar]
- 44.Rubenstein DR, Lovette IJ. 2009. Reproductive skew and selection on female ornamentation in social species. Nature 462, 786–789. ( 10.1038/nature08614) [DOI] [PubMed] [Google Scholar]
- 45.Young AJ, Bennett NC. 2013. Intra-sexual selection in cooperative mammals and birds: why are females not bigger and better armed? Phil. Trans. R. Soc. B 368, 20130075 ( 10.1098/rstb.2013.0075) [DOI] [PMC free article] [PubMed] [Google Scholar]
Associated Data
This section collects any data citations, data availability statements, or supplementary materials included in this article.
Data Availability Statement
All data and references are provided in the electronic supplementary material (electronic supplementary material, table S1).