

Abstract
While some aspects of the phylogeny of the five living echinoderm classes are clear, the position of the ophiuroids (brittlestars) relative to asteroids (starfish), echinoids (sea urchins) and holothurians (sea cucumbers) is controversial. Ophiuroids have a pluteus-type larva in common with echinoids giving some support to an ophiuroid/echinoid/holothurian clade named Cryptosyringida. Most molecular phylogenetic studies, however, support an ophiuroid/asteroid clade (Asterozoa) implying either convergent evolution of the pluteus or reversals to an auricularia-type larva in asteroids and holothurians. A recent study of 10 genes from four of the five echinoderm classes used ‘phylogenetic signal dissection’ to separate alignment positions into subsets of (i) suboptimal, heterogeneously evolving sites (invariant plus rapidly changing) and (ii) the remaining optimal, homogeneously evolving sites. Along with most previous molecular phylogenetic studies, their set of heterogeneous sites, expected to be more prone to systematic error, support Asterozoa. The homogeneous sites, in contrast, support an ophiuroid/echinoid grouping, consistent with the cryptosyringid clade, leading them to posit homology of the ophiopluteus and echinopluteus. Our new dataset comprises 219 genes from all echinoderm classes; analyses using probabilistic Bayesian phylogenetic methods strongly support Asterozoa. The most reliable, slowly evolving quartile of genes also gives highest support for Asterozoa; this support diminishes in second and third quartiles and the fastest changing quartile places the ophiuroids close to the root. Using phylogenetic signal dissection, we find heterogenous sites support an unlikely grouping of Ophiuroidea + Holothuria while homogeneous sites again strongly support Asterozoa. Our large and taxonomically complete dataset finds no support for the cryptosyringid hypothesis; in showing strong support for the Asterozoa, our preferred topology leaves the question of homology of pluteus larvae open.
Keywords: echinoderm, phylogeny, phylogenomic, Asterozoa, Cryptosyringida
1. Introduction
Echinoderms are composed of five extant classes, sea urchins (echinoids), starfish (asteroids), sea cucumbers (holothurians), brittlestars (ophiuroids) and sea lilies (crinoids). Although the modern classes appear in a relatively short time interval early in the fossil record (525–480 Ma) [1], extant crown group species in each class have more recent origins: present-day crinoids and echinoids radiated in large part after the Permian/Triassic extinction event for instance (approx. 250 Ma) [2,3], with asteroids also likely to have undergone an evolutionary bottleneck at this time [4]. The resulting long stem lineages leading to the living forms mean that the monophyly of each class is not in doubt. The rapid and ancient appearance of the classes, however, means that the resolution of the relationships between them is challenging.
Dealing first with the uncontroversial aspects of echinoderm class-level phylogeny, consideration of morphology and previous molecular analyses strongly support a monophyletic group of echinoids, asteroids, holothurians and ophiuroids (Eleutherozoa). Within this eleutherozoan clade, most authors also accept a close relationship between the globular echinoids and holothurians (Echinozoa). The major point of remaining dispute revolves around the position of the ophiuroids, with two plausible solutions. According to the Asterozoa hypothesis, ophiuroids are the sister group of the asteroids, whereas the Cryptosyringida hypothesis links the ophiuroids instead to the Echinozoa (figure 1).
Figure 1.
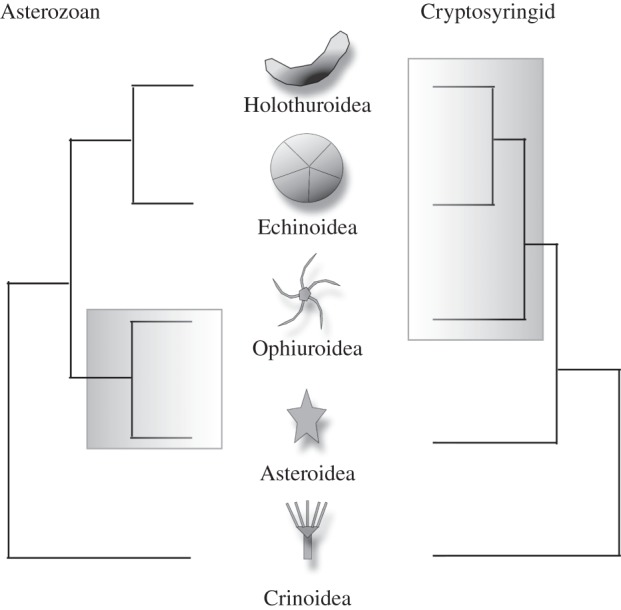
The two hypotheses of echinoderm evolution discussed in this work. The Asterozoan hypothesis unites ophiuroids and asteroids on the basis of a five-rayed body plan. The cryptosyringid hypothesis places ophiuroids as sister group to the holothurians and echinoids on the basis of, for example, closed ambulacral grooves (see Introduction).
The relationship of the echinoids and ophiuroids is of particular evolutionary interest, as members of both classes possess a pluteus-type larva (electronic supplementary material, figure S1). These are characterized by a mesodermally derived calcite skeleton, which supports the elongated, ciliated arms that are used for feeding and swimming. Pluteus larvae contrast with non-skeleton-forming, generic dipleurula type that characterizes the early development of crinoids, asteroids and holothurians. The dipleurula has been proposed to represent the larval form ancestral to all ambulacrarians, as it is also shared with hemichordates, the sister group to echinoderms. The gene regulatory network (GRN) involved in the development of the larval skeleton in the sea urchin Strongylocentrotus purpuratus is one of the best understood developmental networks in biology [5], but has yet to be characterized in ophiuroids.
Among morphologists, Hyman was ‘of the opinion that the closer relationship of ophiuroids to echinoids rather than to asteroids, as usually supposed, is not to be doubted’ on the basis of the shared pluteus larva, ambulacral canals enclosed by epineural folds and biochemical criteria [6, pp. 699–700]. Littlewood et al. [7] also found support for this scenario with their most parsimonious tree based on combined larval and adult morphology, although they note that the alternative asterozoan tree was only two steps longer.
The first molecular analyses using 18S rRNA genes found monophyletic echinoderms, but a questionable internal topology [8]; subsequent reanalysis of these data using more modern phylogenetic methods supports cryptosyringids [9]. Using 28S and 18S rRNA genes, Mallatt & Winchell [10] found strong support for Asterozoa. An analysis of 13 protein-coding sequences encoded in mitochondrial genomes [11] identified three lineages within the echinoderms—crinoids, ophiuroids and a clade consisting of (asteroids, (echinoids, holothurians)). Inspection of this tree shows that the ophiuroids are particularly rapidly evolving, raising the likelihood that their position as sister to other eleutherozoan classes is the result of a long-branch attraction (LBA) artefact [12]. Janies and co-workers analysed combined molecular (seven loci) and morphological datasets from a large set of echinoderms. They produced trees supporting asterozoans and cryptosyringids (as well as other scenarios) and concluded that the overall phylogeny was sensitive to the choice of analytical methods [13].
Most recently, Pisani and co-workers presented an analysis of seven nuclear protein-coding genes and three nuclear ribosomal RNAs from four of the five echinoderm classes (crinoids, ophiuroids, asteroids and echinoids). Analysis of their full dataset supported the Asterozoa hypothesis (ophiuroids, asteroids) [14]. By careful removal of subsets of data expected to be problematic, they produced, in contrast, a tree supporting the cryptosyringid (ophiuroid, echinoid) clade. Their analysis did not include any holothurian sequences. There is the possibility that this omission might have resulted in an unnecessarily long echinoid branch rendering the dataset more susceptible to branch positioning artefacts.
We have re-examined the question of echinoderm class relationships with a large dataset (219 nuclear protein-coding genes) including representatives from all five extant classes of echinoderms including data from two ophiuroids, two asteroids, two holothurians, four echinoids and a crinoid as well as data from three hemichordates and a cephalochordate as outgroup taxa.
2. Material and methods
Our analysis combined sequences from novel data sources and pre-existing protein and expressed sequence transcript databases, as outlined below.
(a). Sources of data
Amphiura filiformis were collected by Peterson mud grabs at a depth of approximately 40 m close to the Sven Loven Centre for Marine Sciences, Kristineberg, on the Gulmar fjord, Sweden (58°15′ N, 11°25′ E). A normalized cDNA library was constructed from mRNA of arm tissues from A. filiformis (regenerated and intact tissues) and sequenced using Roche 454 GS-FLX Titanium technology.
Adult Amphipholis squamata were collected in Argylle Creek on San Juan Island, Washington, and maintained in flow-through aquaria at Friday Harbor Laboratories. Brooded juveniles at a range of stages of adult body plan formation were dissected out of the bursal sacs of the adult animals and flash frozen in liquid nitrogen. Following total RNA extraction, cDNA library construction was carried out by Express Genomics, Maryland, and sequencing of excised inserts was carried out using Roche 454 GS-FLX technology.
Solaster stimpsoni adults were collected by SCUBA at Eagle Cove San Juan Island, Washington, in April during their reproductive season. Adults were spawned by injection of 1-methyl adenine as described [15]. The positively buoyant embryos were cultured in running seawater tables as described [16] with Sanger EST sequencing as described in [17,18].
Adult Florometra serratissima were collected by SCUBA at Bamfield Marine Station Sciences Centre, British Columbia, Canada. Mature oocytes were dissected from the adult female pinnules using forceps and fertilized with sperm obtained by rupturing testes. Embryos were cultured in glass bowls. Gastrula, early doliolaria and late doliolaria developmental stages were frozen in liquid nitrogen and total RNA prepared using the Ambion RNA aqueous mini kit. RNA samples were pooled and prepared for sequencing using the Illumina TruSeq stranded mRNA sample prep with oligo-dT selection then sequenced using HiSeq 101 bp paired-end reads.
Eucidaris tribuloides transcriptome sequences were obtained from the GenBank Sequence Read Archive (accession no. SRX043529).
All other echinoderm nucleotide sequences were taken from the NCBI est_others database.
(b). Preprocessing of nucleotide sequences
High coverage and short read lengths mean that sequences produced using so-called next generation (i.e. Illumina, 454) technologies benefit from being preassembled using dedicated software.
We assembled a dataset of 46 312 223 2 × 101 bp paired-end sequences from the crinoid F. serratissima using the Inchworm program from the Trinity package [19]. This resulted in a set of 1 681 253 sequences.
Amphiura filiformis reads were assembled in MIRA v. 3.2.0rc3 [20], giving 35 742 sequences. Amphipholis squamata and E. tribuloides reads were assembled using the Newbler assembler, to give 53 028 and 21 969 contigs, respectively [21].
(c). Orthologue identification and alignment construction
We used a set of 12 625 Saccoglossus kowalevskii (Skow) sequences retrieved from the NCBI protein sequence database to search the predicted proteomes of the chordate Branchiostoma floridae (Bflo), retrieved from the JGI and the sea urchin S. purpuratus (Spur) retrieved from the NCBI. We identified trios of sequences that formed consistent reciprocal best matches in each other's proteomes and were therefore likely orthologues. Best matches were identified using blastp [22].
For all Saccoglossus sequences that were members of an orthologous trio (Skow, Bflo and Spur), we used tblastn to search a database of all echinoderm and hemichordate expressed sequences from the NCBI est_others database, with the addition of the Florometra, Amphipholis, Amphiura, Solaster and Eucidaris processed datasets described above and Ptychodera flava sequences taken directly from the NCBI trace archive without preprocessing.
Significant hits to each Saccoglossus protein were extracted from the echinoderm nucleotide sequence databases and placed into species-specific groups. The nucleotide sequences in each species group were then assembled in isolation using CAP3 [23]. Assembled sequences thus produced were searched against metazoan protein sequences from the NCBI NR protein sequence database (blastp) and translated against the best match using the estwise program from the genewise package [24].
Each of the resulting assembled protein sequences was then searched against the combined proteomes of Saccoglossus, Branchiostoma and Strongylocentrotus using blastp, and only those for which the best hits were consistent with the members of the initial Skow, Bflo and Spur orthologous trio were retained.
Sets of proteins for each Skow, Bflo and Spur trio were then aligned with all predicted orthologous echinoderm and hemichordate proteins using PROBCONS [25]. A phylogeny was constructed for each protein alignment using PhyML [26], using the WAG model [27], estimating the proportion of invariable sites, estimating the gamma distribution parameter allowing four gamma rate categories (WAG + IG4) and optimizing the tree topology and branch lengths. Each phylogeny was then rooted with the Branchiostoma sequence (the chordate outgroup). Only those alignments that then yielded a monophyletic cluster of echinoderms were retained (i.e. no echinoderm sequences were allowed to branch within the hemichordates or between hemichordates and the root). This test will have the effect of excluding gene sets that include paralogous echinoderm sequences. Paralogous sequences would cluster outside a set of orthologous genes in a correct phylogeny. Rooting with the Branchiostoma orthologue will cause any paralogous echinoderm sequences to branch between this root and hemichordate (the presence of which is inevitable given the composition of our seed orthologue trios). Branching order of echinoderm classes within the echinoderm monophyletic group was not constrained during this process. Tree re-rooting and tests for monophyletic groups were performed using custom perl and python scripts. Final alignments were also screened for RNA contamination against all RNA sequences from the Rfam database [28], using tblastn [22].
(d). Additional filters on final alignment
Only proteins for which at least four out of five echinoderm classes were represented were included in the concatenated alignment (echinoids were invariably present owing to the presence of a S. purpuratus protein in the seed orthologue trios). We finally processed the alignment by visual inspection to remove unreliably aligned sections. The final concatenated alignment contained 219 genes.
(e). Phylogenetic analyses
PhyloBayes analyses were performed with the computationally intensive site-heterogeneous CAT + GTR + Γ mixture model taking approximately one month per analysis. This model accounts for across-site heterogeneities in the amino acid replacement process and is implemented in an MCMC framework by the program PhyloBayes v. 3.3d [29]. Two independent runs were performed with a total length of 6000 cycles, saved every 10 cycles. To construct the tree, the first 2000 points were discarded as burn-in, and the topology and posterior consensus support was computed on the 4000 remaining trees. We also checked for convergence of the two independent runs following burn-in of 2000 using bpcomp, which in each case showed a ‘maxdiff’ (maximum discrepancy) below 0.1.
In order to assess the reliability of trees, we calculated phylogenies on 50 bootstrap replicates (i.e. sampling with replacement to create an alignment the same size as the original) and 100 jack-knife replicates (i.e. sampling without replacement, alignments 25% original length), in both cases using PhyloBayes with the CAT + GTR + Γ model. Chains were run for 1000 cycles, and consensus trees calculated using bpcomp, with 200 cycles discarded as burn-in.
(f). Cross-validation
We performed statistical comparisons of the CAT + GTR + Γ, the WAG + Γ and GTR + Γ models using cross-validation tests as described in [30]. Ten replicates were run: 9/10 of the positions randomly drawn from the alignment were used as the learning set and the remaining 1/10 as the test set. For each model, MCMC were run for 1100 cycles, 100 being discarded as burn-in.
(g). Phylogenetic signal dissection: site rate ranking
Recapitulating the approach of Pisani et al. [14], the number of changes at each site was calculated over a maximum-parsimony tree constructed with unresolved relationships between echinoderm classes. The number of changes for each character over the tree was normalized to correct for positions with missing data, by dividing by the number of changes by the number of taxa with a character at that position. The positions in the alignment were then divided into one sub-alignment containing heterogeneously evolving sites (comprised all invariant positions plus the most frequently substituting quarter of the variable sites) and a second sub-alignment containing the more homogeneously evolving positions comprised the remaining 75% of the more slowly evolving variable sites. These two datasets were analysed separately and the results compared.
(h). Phylogenetic signal dissection: gene rate ranking
Using an alignment for each gene, a maximum-likelihood tree was calculated using PhyML [26] and the total length of that tree (in estimated substitutions per position across all branches) was divided by the number of taxa on the tree to give an estimate of the rate of evolution for each gene. Genes were concatenated in order of their evolutionary rates and the resulting dataset divided into four approximately equal-sized quartiles containing genes ranging from the slowest to the fastest. Each of these four datasets was analysed separately and the results compared.
(i). Partition by gene using MrBayes v. 3.2
We partitioned the dataset into individual genes and, by unlinking the partitions, we allowed each gene to find its own best fitting empirical model from among the 10 possible in MrBayes (poisson, jones, dayhoff, mtrev, mtmam, wag, rtrev, cprev, vt or blosum). We ran two runs of four chains each for a total of 500 000 generations well beyond convergence of the two runs. We additionally unlinked the rate multiplier associated with each gene partition allowing the genes to share the same topology and branch length but to be scaled independently and also use individually best fitting empirical model as before.
3. Results
(a). Data assembly
We gathered a set of 3872 Saccoglossus, Branchiostoma and Strongylocentrotus orthologous trios and used these to search our echinoderm dataset, producing 3537 alignments including additional echinoderm data. Of these, 2630 passed tests for echinoderm monophyly—that is, the echinoderm sequences formed a subtree that included all echinoderm sequences and none of the outgroup species.
Several species that were present in the NCBI est_others sequence database, and thus captured by our automated procedures, had particularly low representation in the final alignment and were removed from subsequent analysis, namely Patiria miniata (asteroid), Heliocidaris erythrogramma (echinoid), Pseudocentrotus depressus (echinoid) and Strongylocentrotus intermedius (echinoid). We also excluded the hemichordate Rhabdopleura compacta, again owing to low coverage. Although incidental to the question of echinoderm phylogeny, this meant we were unable to address the issue of enteropneust monophyly (but see [31] for a convincing conclusion based on miRNAs).
In total, 219 genes were found to have representatives from at least four echinoderm classes. Fifteen taxa were included in the final alignment of 80 666 columns. No hits to the Rfam database were found in the sequences included in these alignments. After filtering for confidently aligned regions, 45 818 positions remained. The full dataset is described in the electronic supplementary material, table S1.
Of the individual gene trees for genes represented in the final alignment, 31 contained monophyletic Cryptosyringida and 49 contained monophyletic Asterozoa. Requiring both crinoid and holothurian sequences to be present (which a priori we would expect to produce more reliable results) enriched Asterozoa (10 trees) relative to Cryptosyringida (three trees).
(b). Echinoderm phylogeny
Analysis using PhyloBayes [29] on the full dataset of 45 818 reliably aligned amino acids from 15 taxa produced the tree shown in figure 2. As widely recognized, the crinoids diverge first and form a sistergroup to the four other classes—the Eleutherozoa. Within the Eleutherozoa, the Asterozoa clade (asteroids + ophiuroids) and the Echinozoa (echinoids + holothurians) are recovered as sister clades. Within the echinoids, the cidaroid E. tribuloides is the deepest branching and within the hemichordates, the ptychoderids clustered together, as expected. All clades have a posterior probability of 1. This topology is supported by analyses using both the widely employed site-homogeneous WAG + Γ and GTR + Γ models (gamma with five rate categories) and the more complex site-heterogeneous CAT + GTR model (with the default Dirichlet process for estimating rates across sites [32]). We verified by cross-validation that the CAT + GTR + Γ model had a better fit to our dataset than the GTR + Γ (ΔlnL 228.36 ± 23.5159) and that the GTR + Γ had a better fit than WAG + Γ (ΔlnL 290.48 ± 17.613).
Figure 2.

Full tree from complete dataset (see text for description).
We performed 50 bootstrap replicates using the CAT + GTR + Γ model: 90% of replicates supported Asterozoa. Of the remainder, 8% placed ophiuroids as sister to holothurians, with only 2% supporting Cryptosyringida. We also performed 100 jack-knife replicates using just 25% of the full dataset: the results with such a reduced dataset were naturally less robust; nevertheless 57% of trees support the asterozoan topology. As with the bootstrap samples, the next most common result in the jack-knife set (25%) contained the unlikely grouping of holothurians and ophiuroids. Cryptosyringids sensu stricto ((H,E),O) were observed in only 8% of trees, with a further 5% containing monophyletic cryptosyringids although with ophiuroids and holothurians as sister groups ((H,O),E). In summary, both bootstrap and jack-knife replication provide support for asterozoans. The cryptosyringids were the third best supported topology with both approaches, and less well supported than a grouping of holothurians and ophiuroids, which, to the best of our knowledge, has no serious support from other sources and can likely be discounted as a long-branch artefact.
The Asterozoa–Echinozoa topology has been supported by the majority of molecular analyses of this problem. By contrast, the recent work by Pisani et al. addressing the possibility of systematic error due to unequal rates of evolution and saturation using an approach they call phylogenetic signal dissection supports, instead, the cryptosyringid clade (Echinozoa + Ophiuroidea). This result was supported in the Pisani et al. analysis only when using the portion of the alignment remaining after the constant and the most variable sites had been removed. We set out to replicate this approach with our larger and more taxonomically complete dataset. We used two approaches to test the effects of removing faster evolving and less reliable data: first, the site-based method as described, which we term site rate ranking (SRR); second, we classified each gene in our alignment into one of four quartiles according to its rate of evolution and analysed each of these quartiles in turn—we call this gene rate ranking (GRR). The GRR method has the advantage that it does not depend on pre-specifying any topology, whereas the SRR approach has the advantage that it treats each site independently.
Using either of these approaches with our dataset, we find no support for the cryptosyringid clade. Electronic supplementary material, figure S2, shows the results using the site-based SRR method. With the supposedly optimal portion of the alignment (constant and most variable sites removed), we still find strong support for the Asterozoa–Echinozoa topology (electronic supplementary material, figure S2a). The support is slightly lower than when using the whole alignment (support for Asterozoa pp = 0.94), presumably because the alignment is shorter (16 678 sites compared to 46 913 for the complete alignment) and hence less informative. Using the suboptimal sites (constant and variable), we recover an improbable topology with Holothuroidea and Ophiuroidea as sister taxa (both are long branches) and the relative positions of echinoids, asteroids and the holothurian/ophiuroid group are unresolved (electronic supplementary material, figure S2b).
Earlier support for cryptosyringids came from a dataset that did not include holothurians [14] and so we repeated the SRR method with this class excluded. We recovered identical relative positions for each of the remaining classes and so this difference in taxonomic representation does not explain the difference between our results and those of Pisani et al. [14] (results not shown).
Figure 3 shows the results from the gene-based GRR approach. The slowest quartile (most reliable) shows the strongest support for Asterozoa (pp = 1, figure 3a). The second and third quartiles still support this clade but with diminishing support (second quartile pp = 0.83, figure 3b; third quartile pp = 0.71, figure 3c) The fourth quartile (fastest evolving genes and likely least reliable) places the ophiuroids as sister group to the Echinozoa + Asteroidea, presumably due to LBA between the relatively long-branched ophiuroids and the outgroups (figure 3d). All other aspects of the tree (including the Echinozoa clade) do not change as the datasets get faster and all other clades receive the maximum support (pp = 1) in analyses of all four quartets. The difference in rate is very evident when comparing these trees (shortest (figure 3a) to longest (figure 3d)), which are all drawn to the same scale.
Figure 3.

Results from our data stratified by overall length of gene trees (gene rate ranking), from (a), the slowest evolving quartile, to (d) the fastest evolving quartile.
We conducted two experiments using analyses performed with MrBayes in which we partitioned the dataset by genes and allowed genes to adopt firstly gene-specific empirical models of amino acid substitution and secondly both gene-specific empirical models and a gene-specific rate. In both experiments, the topology was the same as in figure 2 with posterior probability of 1.0 for all nodes.
4. Discussion
(a). Echinoderm phylogeny
All of our analyses unequivocally support a clade of Ophiuroidea plus Asteroidea: Asterozoa. Despite using two methods to stratify our data by evolutionary rate, we found no support for the alternative Cryptosyringida hypothesis of a sister group relationship of Ophiuroidea and Echinoidea + Holothuroidea. Our dataset is considerably larger than others that have been brought to bear on this question, includes at least two members of each of the relevant classes and deep sampling of the closest outgroup (the crinoid). A priori, we might expect such a dataset to produce a more reliable result, and we have not been able to identify confounding factors. Our trees do reveal very short branches leading to the asterozoan and echinozoan clades, however. These divergences appear to have taken place in a compressed time interval, a fact perhaps underscored by the absence of any miRNAs that may have helped resolve the relative positioning of these taxa [14]. Further molecular testing of our topology might come from even deeper taxon sampling or new types of data. The order of the echinoid Hox genes, for instance, at least as observed in S. purpuratus, is derived relative to that seen in hemichordates, and apparently coupled with this, the HOX4 orthologue has been lost [33,34]. HOX4 orthologues have, however, been identified in crinoids [35] and asteroids [36]. Their status in ophiuroids is uncertain (the Stegophiura sladeni sequence referred to as SS-11 in the previous study [37] is not convincing), but our phylogeny would be problematic if ophiuroids and echinoids shared a complex molecular character state [38], such as a Hox cluster rearrangement and gene loss, to the exclusion of asteroids. We are not aware of any other complex molecular character states that might be informative for this phylogenetic question: the systematic exploration of their existence, presence and absence must await complete genome sequences of representatives of other echinoderm classes.
(b). Asterozoa and the origins of the larval skeleton
The most recent molecular study to address echinoderm phylogeny [14] stated that their result (i.e. supporting cryptosyringids) ‘confirms that that the morphologically similar pluteus larval stages of echinoids and ophiuroids are indeed homologous rather than convergent’. It is not clear, however, that the larval skeleton can be used as a phylogenetic character to distinguish between the alternative phylogenetic trees without making assumptions about the relative ease of gain or loss events (electronic supplementary material, figure S3). Under the scenario of a single origin for the larval skeletons (the evidence for which we review briefly below), the cryptosyringid hypothesis is indeed more parsimonious than the asterozoan, requiring a single loss of the skeleton in holothurians (and concomitant reversal to a auricularia/bipinnaria type of larva), with the asterozoan hypothesis requiring an additional loss/reversal in asteroids (electronic supplementary material, figures S3a and S3c). If a dual origin of the larval skeleton is favoured, the two phylogenetic scenarios are indistinguishable on parsimony grounds (so far as it relates to the skeleton) (electronic supplementary material, figures S3b and S3d).
Although the larval skeleton seems intuitively to be a complex trait, in the sense that it might be regarded as unlikely to have evolved twice, all echinoderm classes share an adult skeleton, and the evolution of the larval skeleton may be the result of a relatively simple redeployment of this, making the possibility of convergence more likely. Gao & Davidson [39], comparing larval and adult skeletogenesis, have identified the genes specifically required for embryonic activation of the skeletogenesis network in the echinoid S. purpuratus, showing that this is only a small component of the overall skeletogenic GRN. It is worth noting that the key gene in the embryonic skeleotogenic GRN, Pmar1, involved in the establishment of the double negative gate that de-represses skeletogenesis [5] currently appears to be an echinoid autapomorphy. We could not find evidence of Pmar1 orthologue presence in any taxa in our echinoderm EST database (or non-echinoderm databases) except for S. purpuratus. Although Vaughn et al. [40] mention an unpublished ophiuroid Pmar1 orthologue, their inability to find Pmar1 transcripts expressed in any stage of brittlestar development supported their conclusion that ‘embryonic skeleton formation in sea urchins and brittle stars represents convergent evolution by independent co-optation of a shared pathway used in adult skeleton formation’ [40, p. 14].
The suggestion that the echinoid larval skeleton may be a derived state is further supported by McCauley et al.'s [41] analysis of holothurian embryogenesis. Based on an analysis of the embryonic expression patterns of mesodermal regulatory genes in Parastichopus parvimensis, they suggest ‘that the ancestor of the sea cucumber + sea urchin clade may have had a mesoderm with a regulatory state similar to that of extant sea cucumbers and may have developed only a rudimentary larval skeleton’ [41, p. 5], and argue that, as such, holothurians are unlikely to have lost a complex larval skeleton. If we accept the sister group relationship of echinoderms and holothurians, this in turn suggests that the larval skeleton was not a plesiomorphy of these two taxa and thus unlikely to be a plesiomorphy of any possible clade including the ophiuroids. Other authors have argued on morphological grounds that the two kinds of plutei are convergent forms [42,43], but as the defining feature of the pluteus is its skeleton, most desirable would be a comparison of the fine details of the developmental genetics responsible for initiating production of the larval skeletons, which we would expect to more exactly overlap in homologous plutei. We emphasize that such evidence would be useful for ruling out the scenario of a single origin for the pluteus within cryptosyringids (electronic supplementary material, figure S3c), not for distinguishing between the dual origin scenarios—however, our molecular evidence clearly favours the Asterozoa (i.e. electronic supplementary material, figure S3b).
(c). Adult morphology
The cryptosyringids owe their name to the fact that their radial water vascular system and radial nerve become covered during development, a trait that was viewed as a synapomorphy of the group [44]. In later work, however, Smith and co-workers [7] pointed out that the developmental mechanism by which this occurs differs within the echinoids, suggesting that its presence in some instances may be due to convergence, and as such, it would not be a reliable phylogenetic marker. To the best of our knowledge, there has been no work on the molecular mechanisms leading to covered radial nerves and water vascular system in ophiuroids and echinoids. Under the Asterozoa hypothesis, we would predict differing molecular mechanisms, suggesting parallel evolution of the trait in echinoids and ophiuroids, unless the trait were secondarily absent from asteroids, in which case the fossil record may be the best source of evidence.
If our inference of monophyletic Asterozoa is correct, it means that the hypothesis of a star-like common ancestor of Eleutherozoa can neither be rejected nor supported. This in turn has implications for the interpretation of the fossil record: in particular, based on our analysis, there is no reason to rule out a non-stellate ancestor for the echinoid + holothurian stem group.
Acknowledgements
We thank Sam Dupont (University of Gothenburg, Kristineberg) and David Dylus (UCL) for helpful comments.
Funding statement
C.J.L. acknowledges funding from: NASA Exobiology 1-EXO11-0135. C.B.C. acknowledges funding from the NSERC discovery grants programme. M.J.T. is supported by a Royal Society Wolfson Research Merit Award.
References
- 1.Erwin DH, Laflamme M, Tweedt SM, Sperling EA, Pisani D, Peterson KJ. 2011. The Cambrian conundrum: early divergence and later ecological success in the early history of animals. Science 334, 1091–1097. ( 10.1126/science.1206375) [DOI] [PubMed] [Google Scholar]
- 2.Kroh A, Smith AB. 2010. The phylogeny and classification of post-Palaeozoic echinoids. J. Syst. Palaeontol. 8, 147–212. ( 10.1080/14772011003603556) [DOI] [Google Scholar]
- 3.Rouse GW, et al. 2013. Fixed, free, and fixed: the fickle phylogeny of extant Crinoidea (Echinodermata) and their Permian–Triassic origin. Mol. Phylogenet. Evol. 66, 161–181. ( 10.1016/j.ympev.2012.09.018) [DOI] [PubMed] [Google Scholar]
- 4.Twitchett RJ, Oji T. 2005. Early Triassic recovery of echinoderms. Comptes Rendus Palevol. 4, 531–542. ( 10.1016/j.crpv.2005.02.006) [DOI] [Google Scholar]
- 5.Oliveri P, Tu Q, Davidson EH. 2008. Global regulatory logic for specification of an embryonic cell lineage. Proc. Natl Acad. Sci. USA 105, 5955–5962. ( 10.1073/pnas.0711220105) [DOI] [PMC free article] [PubMed] [Google Scholar]
- 6.Hyman LH. 1955. The invertebrates (Vol. IV): Echinodermata. New York, NY: McGraw-Hill. [Google Scholar]
- 7.Littlewood DTJ, Smith AB, Clough KA, Emson RH. 1997. The interrelationships of the echinoderm classes: morphological and molecular evidence. Biol. J. Linn. Soc. 61, 409–438. ( 10.1111/j.1095-8312.1997.tb01799.x) [DOI] [Google Scholar]
- 8.Field KG, Olsen GJ, Lane DJ, Giovannoni SJ, Ghiselin MT, Raff EC, Pace NR, Raff RA. 1988. Molecular phylogeny of the animal kingdom. Science 239, 748–753. ( 10.1126/science.3277277) [DOI] [PubMed] [Google Scholar]
- 9.Telford MJ. 2013. Field et al. Redux. EvoDevo 4, 5 ( 10.1186/2041-9139-4-5) [DOI] [PMC free article] [PubMed] [Google Scholar]
- 10.Mallatt J, Winchell CJ. 2007. Ribosomal RNA genes and deuterostome phylogeny revisited: more cyclostomes, elasmobranchs, reptiles, and a brittle star. Mol. Phylogenet. Evol. 43, 1005–1022. ( 10.1016/j.ympev.2006.11.023) [DOI] [PubMed] [Google Scholar]
- 11.Perseke M, Bernhard D, Fritzsch G, Brümmer F, Stadler PF, Schlegel M. 2010. Mitochondrial genome evolution in Ophiuroidea, Echinoidea, and Holothuroidea: insights in phylogenetic relationships of Echinodermata. Mol. Phylogenet. Evol. 56, 201–211. ( 10.1016/j.ympev.2010.01.035) [DOI] [PubMed] [Google Scholar]
- 12.Felsenstein J. 2004. Inferring phylogenies. Sunderland, MA: Sinauer Associates. [Google Scholar]
- 13.Janies DA, Voight JR, Daly M. 2011. Echinoderm phylogeny including Xyloplax, a progenetic asteroid. Syst. Biol. 60, 420–438. ( 10.1093/sysbio/syr044) [DOI] [PubMed] [Google Scholar]
- 14.Pisani D, Feuda R, Peterson KJ, Smith AB. 2012. Resolving phylogenetic signal from noise when divergence is rapid: a new look at the old problem of echinoderm class relationships. Mol. Phylogenet. Evol. 62, 27–34. ( 10.1016/j.ympev.2011.08.028) [DOI] [PubMed] [Google Scholar]
- 15.Strathmann MF. 1987. Reproduction and development of marine invertebrates of the Northern Pacific Coast. Seattle, WA: University of Washington Press. [Google Scholar]
- 16.Aronowicz J. 2007. The ‘agitator’: an inexpensive device for culturing large numbers of fragile marine invertebrate larvae. Mar. Biol. 151, 1137–1141. ( 10.1007/s00227-006-0554-3) [DOI] [Google Scholar]
- 17.Bourlat SJ, et al. 2006. Deuterostome phylogeny reveals monophyletic chordates and the new phylum Xenoturbellida. Nature 444, 85–88. ( 10.1038/nature05241) [DOI] [PubMed] [Google Scholar]
- 18.Lowe CJ, Wu M, Salic A, Evans L, Lander E, Stange-Thomann N, Gruber CE, Gerhart J, Kirschner M. 2003. Anteroposterior patterning in hemichordates and the origins of the chordate nervous system. Cell 113, 853–865. ( 10.1016/S0092-8674(03)00469-0) [DOI] [PubMed] [Google Scholar]
- 19.Grabherr MG, et al. 2011. Full-length transcriptome assembly from RNA-Seq data without a reference genome. Nat. Biotechnol. 29, 644–652. ( 10.1038/nbt.1883) [DOI] [PMC free article] [PubMed] [Google Scholar]
- 20.Chevreux B, Pfisterer T, Drescher B, Driesel AJ, Müller WEG, Wetter T, Suhai S. 2004. Using the miraEST assembler for reliable and automated mRNA transcript assembly and SNP detection in sequenced ESTs. Genome Res. 14, 1147–1159. ( 10.1101/gr.1917404) [DOI] [PMC free article] [PubMed] [Google Scholar]
- 21.Quinn NL, et al. 2008. Assessing the feasibility of GS FLX Pyrosequencing for sequencing the Atlantic salmon genome. BMC Genomics 9, 404 ( 10.1186/1471-2164-9-404) [DOI] [PMC free article] [PubMed] [Google Scholar]
- 22.Altschul SF, Madden TL, Schäffer AA, Zhang J, Zhang Z, Miller W, Lipman DJ. 1997. Gapped BLAST and PSI-BLAST: a new generation of protein database search programs. Nucleic Acids Res. 25, 3389–3402. ( 10.1093/nar/25.17.3389) [DOI] [PMC free article] [PubMed] [Google Scholar]
- 23.Huang X, Madan A. 1999. CAP3: a DNA sequence assembly program. Genome Res. 9, 868–877. ( 10.1101/gr.9.9.868) [DOI] [PMC free article] [PubMed] [Google Scholar]
- 24.Birney E, Clamp M, Durbin R. 2004. GeneWise and Genomewise. Genome Res. 14, 988–995. ( 10.1101/gr.1865504) [DOI] [PMC free article] [PubMed] [Google Scholar]
- 25.Do CB, Mahabhashyam MSP, Brudno M, Batzoglou S. 2005. ProbCons: probabilistic consistency-based multiple sequence alignment. Genome Res. 15, 330–340. ( 10.1101/gr.2821705) [DOI] [PMC free article] [PubMed] [Google Scholar]
- 26.Guindon S, Gascuel O. 2003. A simple, fast, and accurate algorithm to estimate large phylogenies by maximum likelihood. Syst. Biol. 52, 696–704. ( 10.1080/10635150390235520) [DOI] [PubMed] [Google Scholar]
- 27.Whelan S, Goldman N. 2001. A general empirical model of protein evolution derived from multiple protein families using a maximum-likelihood approach. Mol. Biol. Evol. 18, 691–699. ( 10.1093/oxfordjournals.molbev.a003851) [DOI] [PubMed] [Google Scholar]
- 28.Burge SW, Daub J, Eberhardt R, Tate J, Barquist L, Nawrocki EP, Eddy SR, Gardner PP, Bateman A. 2013. Rfam 11.0: 10 years of RNA families. Nucleic Acids Res. 41, D226–D232. ( 10.1093/nar/gks1005) [DOI] [PMC free article] [PubMed] [Google Scholar]
- 29.Lartillot N, Lepage T, Blanquart S. 2009. PhyloBayes 3: a Bayesian software package for phylogenetic reconstruction and molecular dating. Bioinformatics 25, 2286–2288. ( 10.1093/bioinformatics/btp368) [DOI] [PubMed] [Google Scholar]
- 30.Lartillot N, Brinkmann H, Philippe H. 2007. Suppression of long-branch attraction artefacts in the animal phylogeny using a site-heterogeneous model. BMC Evol. Biol. 7(Suppl. 1), S4 ( 10.1186/1471-2148-7-S1-S4) [DOI] [PMC free article] [PubMed] [Google Scholar]
- 31.Peterson KJ, Su Y-H, Arnone MI, Swalla B, King BL. 2013. MicroRNAs support the monophyly of enteropneust hemichordates. J. Exp. Zool. B Mol. Dev. Evol. 320, 368–374. ( 10.1002/jez.b.22510) [DOI] [PubMed] [Google Scholar]
- 32.Huelsenbeck JP, Suchard MA. 2007. A nonparametric method for accommodating and testing across-site rate variation. Syst. Biol. 56, 975–987. ( 10.1080/10635150701670569) [DOI] [PubMed] [Google Scholar]
- 33.Peterson KJ. 2004. Isolation of Hox and Parahox genes in the hemichordate Ptychodera flava and the evolution of deuterostome Hox genes. Mol. Phylogenet. Evol. 31, 1208–1215. ( 10.1016/j.ympev.2003.10.007) [DOI] [PubMed] [Google Scholar]
- 34.Cameron RA, et al. 2006. Unusual gene order and organization of the sea urchin hox cluster. J. Exp. Zool. B Mol. Dev. Evol. 306, 45–58. ( 10.1002/jez.b.21070) [DOI] [PubMed] [Google Scholar]
- 35.Hara Y, Yamaguchi M, Akasaka K, Nakano H, Nonaka M, Amemiya S. 2006. Expression patterns of Hox genes in larvae of the sea lily Metacrinus rotundus. Dev. Genes Evol. 216, 797–809. ( 10.1007/s00427-006-0108-1) [DOI] [PubMed] [Google Scholar]
- 36.Long S, Martinez P, Chen W-C, Thorndyke M, Byrne M. 2003. Evolution of echinoderms may not have required modification of the ancestral deuterostome HOX gene cluster: first report of PG4 and PG5 Hox orthologues in echinoderms. Dev. Genes Evol. 213, 573–576. ( 10.1007/s00427-003-0355-3) [DOI] [PubMed] [Google Scholar]
- 37.Mito T, Endo K. 2000. PCR survey of Hox genes in the crinoid and ophiuroid: evidence for anterior conservation and posterior expansion in the echinoderm Hox gene cluster. Mol. Phylogenet. Evol. 14, 375–388. ( 10.1006/mpev.1999.0707) [DOI] [PubMed] [Google Scholar]
- 38.Telford MJ, Copley RR. 2011. Improving animal phylogenies with genomic data. Trends Genet. 27, 186–195. ( 10.1016/j.tig.2011.02.003) [DOI] [PubMed] [Google Scholar]
- 39.Gao F, Davidson EH. 2008. Transfer of a large gene regulatory apparatus to a new developmental address in echinoid evolution. Proc. Natl Acad. Sci. USA 105, 6091–6096. ( 10.1073/pnas.0801201105) [DOI] [PMC free article] [PubMed] [Google Scholar]
- 40.Vaughn R, Garnhart N, Garey JR, Thomas WK, Livingston BT. 2012. Sequencing and analysis of the gastrula transcriptome of the brittle star Ophiocoma wendtii. EvoDevo 3, 19 ( 10.1186/2041-9139-3-19) [DOI] [PMC free article] [PubMed] [Google Scholar]
- 41.McCauley BS, Wright EP, Exner C, Kitazawa C, Hinman VF. 2012. Development of an embryonic skeletogenic mesenchyme lineage in a sea cucumber reveals the trajectory of change for the evolution of novel structures in echinoderms. EvoDevo 3, 17 ( 10.1186/2041-9139-3-17) [DOI] [PMC free article] [PubMed] [Google Scholar]
- 42.Byrne M, Nakajima Y, Chee FC, Burke RD. 2007. Apical organs in echinoderm larvae: insights into larval evolution in the Ambulacraria. Evol. Dev. 9, 432–445. ( 10.1111/j.1525-142X.2007.00189.x) [DOI] [PubMed] [Google Scholar]
- 43.Dupont S, Thorndyke W, Thorndyke MC, Burke RD. 2009. Neural development of the brittlestar Amphiura filiformis. Dev. Genes Evol. 219, 159–166. ( 10.1007/s00427-009-0277-9) [DOI] [PubMed] [Google Scholar]
- 44.Smith AB. 1984. Classification of the Echinodermata. Palaeontology 27, 431–459. [Google Scholar]