

Abstract
Background
The current study aimed to compare the effects of different cholinesterase inhibitors on acetylcholinesterase (AChE) and butyrylcholinesterase (BuChE) activities and protein levels, in the cerebrospinal fluid (CSF) of Alzheimer disease (AD) patients.
Methods and Findings
AD patients aged 50–85 years were randomized to open-label treatment with oral rivastigmine, donepezil or galantamine for 13 weeks. AChE and BuChE activities were assayed by Ellman’s colorimetric method. Protein levels were assessed by enzyme-linked immunosorbent assay (ELISA). Primary analyses were based on the Completer population (randomized patients who completed Week 13 assessments). 63 patients were randomized to treatment. Rivastigmine was associated with decreased AChE activity by 42.6% and decreased AChE protein levels by 9.3%, and decreased BuChE activity by 45.6% and decreased BuChE protein levels by 21.8%. Galantamine decreased AChE activity by 2.1% and BuChE activity by 0.5%, but increased AChE protein levels by 51.2% and BuChE protein levels by10.5%. Donepezil increased AChE and BuChE activities by 11.8% and 2.8%, respectively. Donepezil caused a 215.2%increase in AChE and 0.4% increase in BuChE protein levels. Changes in mean AChE-Readthrough/Synaptic ratios, which might reflect underlying neurodegenerative processes, were 1.4, 0.6, and 0.4 for rivastigmine, donepezil and galantamine, respectively.
Conclusion
The findings suggest pharmacologically-induced differences between rivastigmine, donepezil and galantamine. Rivastigmine provides sustained inhibition of AChE and BuChE, while donepezil and galantamine do not inhibit BuChE and are associated with increases in CSF AChE protein levels. The clinical implications require evaluation.
Keywords: Acetylcholinesterase, Alzheimer’s disease, Butyrylcholinesterase, Cerebrospinal fluid (CSF), Cholinesterase inhibitors
INTRODUCTION
Synaptic or neuronal acetylcholine (ACh) has many roles in central cholinergic neurotransmission, the autonomic nervous system (ANS), neuromuscular communication, and interaction with other neurotransmitter pathways [1–3]. ACh is also involved in neuronal-to-immune communication and is a stress-response regulator [4–6]. Cholinesterase inhibitors (ChEIs) are a mainstay of Alzheimer’s disease (AD) therapy. Both acetylcholinesterase (AChE) and butyrylcholinesterase (BuChE) play a role in ACh regulation [7, 8], and have functions beyond cholinergic signaling, including roles in systemic, neurovascular, and brain inflammation [1, 4].
AChE and BuChE are more appropriately considered a combinational series of variant proteins [9, 10], which allow them to participate in various biologic processes. Dissimilar terminal sequences of enzyme isoforms account for the different multimerization, attachment to cell membranes, or existence as soluble proteins [11]. Mechanisms that allow single genes for AChE or BuChE to produce numerous products that perform many tasks involve alternate promoters, alternative splicing, and numerous post-translational events [6, 12, 13].
Three ChEIs are commonly used in the clinical treatment of AD: rivastigmine, donepezil and galantamine. Rivastigmine is a carbamate molecule; donepezil a piperidine; and galantamine a phenanthrene alkaloid [14]. Rivastigmine inhibits both AChE and BuChE, whereas donepezil and galantamine are more AChE-selective [15]. Several longer-term studies with rapidly-reversible AChE inhibitors (galantamine, donepezil, tacrine) have shown an increase in CSF AChE activity [16, 17], while a sustained decrease in activity has been reported following treatment with the slowly-reversible dual inhibitor rivastigmine [18]. The objectives of the current study were to compare effects of ChEIs on BuChE and AChE enzyme levels and hydrolytic activities, on different isoforms of AChE, and on key protein markers in the CSF of AD patients.
METHODS
Patients
Patients included in the study were aged 50 to 85 years and had a diagnosis of dementia of the Alzheimer’s type according to the DSM-IV criteria [19], and probable or possible AD according to the National Institute of Neurological and Communicative Disorders and Stroke and the Alzheimer Disease and Related Disorders Association (NINCDS-ADRDA) [20]. Patients had mild to moderate dementia as confirmed by a Mini-Mental State Examination (MMSE) score of 10 to 20. Patients being treated with psychotropic medications could remain on treatment during the study, provided that the dose had been stabilized for the past month.
Patients were excluded from the study if they had prior exposure to rivastigmine, donepezil or galantamine. Other exclusion criteria included: advanced, severe, or unstable disease of any type that might interfere with study evaluations or put the patient at special risk; imaging findings consistent with a condition other than AD that would explain the patient’s dementia; current treatment with coumarin derivatives; blood clotting abnormalities or inadequate platelet function.
Study Design
This was a prospective, multicenter, randomized, 13-week, open-label, comparative study in patients with mild to moderate AD. Patients were randomized to treatment with oral rivastigmine, donepezil or galantamine in a 1:1:1 ratio to enable direct comparisons of these agents on pre-specified outcomes. The protocol was approved by the Institutional Review Board/Independent Ethics Committee/Research Ethics Board. The study was in compliance with the principles of Good Clinical Practice and the Declaration of Helsinki. Informed consent was obtained from the patients or their legally appointed representative.
CSF samples were collected at baseline and at Week 13. At both visits, a morning meal of approximately 500 calories was given to the patient upon arrival at the study site. In accordance with manufacturer guidelines, patients on rivastigmine and galantamine treatment received their study medication immediately following breakfast; donepezil was administered the previous evening. The lumbar puncture procedure to collect CSF samples was performed approximately 4–6 hours after the patient had eaten the meal. Thus, steady-state should have been reached by the time of the procedure. CSF samples were collected by lumbar puncture in the L3–4 or L4–5 interspace using a 20 gauge spinal introducer and 24 gauge Sprotte atraumatic spinal needle. CSF was withdrawn through the spinal needle with 5 cc sterile polypropylene syringes.
Patients started treatment on either rivastigmine 1.5 mg bid, donepezil 5 mg qd, or galantamine 4 mg bid. After a minimum of 4 weeks, if patient demonstrated good tolerability at the current dose, they were up-titrated to rivastigmine 3 mg bid, donepezil 10 mg qd, or galantamine 8 mg bid. Subsequent up-titrations of rivastigmine or galantamine could be made following a minimum of 4 weeks at each dose, based upon the patient’s well-being and tolerability, to a maximum of rivastigmine 6 mg bid or galantamine 12 mg bid. Dose decreases could occur at any time, but the aim was to maintain patients at highest well-tolerated doses. Patients needed to sustain a minimum dose of rivastigmine 3 mg bid, galantamine 8 mg bid, or donepezil 5 mg qd for at least 3 days prior to the Week 13 visit.
Site staff, study patients, caregivers, and all monitoring personnel were not blinded to the assigned treatment. However, personnel performing laboratory sample processing for cholinesterase activity and protein markers were blinded to the assigned treatment, and to the collection time point (either pre- or post-dose).
Laboratory Assessments
The first 3 mL of CSF collected from each patient was sent to the site’s local laboratory for cell count, glucose and protein determination. Two 1 mL polypropylene tubes of CSF were collected for cholinesterase activity assessments. An additional 5 mL was collected, divided as 0.5 mL aliquots into 10 pre-labeled and ordered tubes, and placed immediately on dry ice for biomarker evaluation. A blood sample for cholinesterase activity (two tubes of 2 mL each) and Aβ assessments (one 1 mL EDTA-containing tube) was also drawn following the lumbar puncture conducted at the baseline and Week 13 visits.
Activities of AChE and BuChE in the CSF were assayed using the Ellman’s colorimetric method [21] using acetylthiocholine (ATC; Sigma) and butyrylthiocholine (BTC; Sigma), respectively, as substrates. AChE activity was assessed in the presence of the selective BuChE inhibitor ethopropazine (Sigma) with a final concentration of 0.1 mM. BuChE activity was assessed in the presence of the selective AChE inhibitor 1,5-bis(4-allyldimethylammoniumphenyl)pentan-3-one dibromide (BW284C51; Sigma) with a final concentration of 1.0 mM. Ellman’s reagent 5,5′-Dithiobis(2-nitrobenzoic acid) (DTNB; Sigma), ATC and BTC solutions were prepared daily in sodium-potassium phosphate buffer (50 mM, pH 7.4). CSF samples (50 μL, dilution factor 4) were placed in wells of a 96-well microplate containing 50 μL of the buffer. All samples were run in triplicate. The reaction was started by adding 100 μL of a reagent mixture containing sodium-potassium phosphate buffer (50 mM, pH 7.4); 0.75 mM DTNB (final concentration 0.38 mM);1.0 mM ATC (final concentration 0.50 mM) or 10 mM BTC (final concentration 5.0 mM); and 0.2 mM ethopropazine (final concentration 0.1 mM) or 2.0 mM BW284C51 (final concentration 1.0 mM). The reaction was monitored using a microplate spectrophotometer reader (SpectraMax™ 250; Molecular Devices Corporation) for at least 10 minutes at 412 nm wavelength at room temperature (22.5 °C), using SOFTmax®PRO software (version 3.1.2 for PC; Molecular Devices Corporation). Reaction rates were assessed from the linear portion of the reaction curves as changes of absorbance per minute. Percent changes or inhibition of enzyme activities were calculated for each patient in comparison with his or her own baseline, according to the following formulae: % Inhibition of AChE = [1− (AET/A0)] × 100 and % Inhibition of BuChE = [1− (BET/B0)] × 100, where A0 or B0 are AChE or BuChE activity at baseline, and AET or BET are the AChE or BuChE activity at 13 weeks (End of Trial, ET). CSF activities were assessed as both ng/mL and nmol/min/mL of CSF. Results for the more conservative nmol/min/mL assessments are shown here; the ng/mL assessments were supportive and have been presented elsewhere [22].
CSF BuChE protein levels were quantified by using two selective mouse monoclonal antibodies against human BuChE in a sandwich ELISA. All CSF samples were diluted 4-fold with TBS-T-BSA (10mM Tris-HCl, pH 7.4; 0.9% NaCl; 0.05% Tween 20; and 0.1% bovine serum albumin, BSA; all from Sigma) and frozen at −70°C until the assay. Partially-purified human serum BuChE with a stated specific activity of 12.7 U/mg (c-9971, Sigma) was used as the standard protein. This standard was diluted in the TBS-T-BSA buffer to concentrations of 2.0–0.016 ng/μL (by serial 2-fold steps). Because the standard was not a single homogeneous protein, its own BuChE content was computed using the established specific activity of 740 U/mg (1) before calculating the amounts of BuChE protein in the CSF samples.
Two mouse monoclonal antibodies were used to measure protein levels of the AChE-R and AChE-S splice variants [23]: i) the MA3-042 Ab (Affinity BioReagents, CO), which is raised against cerebellar AChE. ii) the MAB337 Ab (Chemicon International, CA), raised against human red blood cell AChE. The selectivity of these antibodies has been previously determined by Darreh-Shori et al. [23, 24]. All CSF samples were diluted five times in advance in dilution buffer (10 mM Tris-HCl, pH 7.4; 0.9% NaCl; 1.0 mM EDTA; 0.05% Triton X-100 and 1% BSA) and were kept frozen at −20°C until the assay. Partially-purified human AChE with a specific activity of 2.0 U/mg total protein content (#C1682, Sigma) was used as the standard protein. This standard was diluted in the dilution buffer (to a concentration ranging between 2.0 and 0.15 ng/μL, by serial 2-fold steps). Nunc MaxiSorp ELISA plates were coated overnight at 4°C with 150μL/well of the MA3-042 Ab (1:1000) or MAB337 Ab (1:3000) diluted in coating buffer (0.1 M carbonate buffer, pH 9.6, containing 0.2% (wt/v) sodium azide). The plates were blocked at 37°C for 2 hours with 250 μL/well of coating buffer containing 5% BSA (wt/v, Fraction V, Sigma), washed with TBS-T (10 mM Tris-HCl, pH 7.4, containing 0.9% NaCl and 0.05% Tween 20), then incubated overnight at 4°C with 150 μL/well of the standards (in triplicate) or the diluted CSF samples (in triplicate). They were then washed with TBS-T and incubated with ATC reagent mix (200 μL/well of Na/K-phosphate buffer, pH 7.4, containing 1.3 mM ATC, 0.5 mM DTNB) for 1 to 2 hours at 22.5 °C. The absorbance was read at a wavelength of 412 nm.
Immunoblotting analysis was performed to detect changes in relative protein expression of the globular dimeric (G2) and tetrameric (G4) molecular forms of AChE-S, as described previously [25]. Tau, ptau231 and Aβ protein levels were measured using an enzyme-linked immunosorbent assay (ELISA). Each assay utilized antibodies specific to each protein marker: monoclonal antibodies AT120, HT7 and BT2 for total tau; CP27 and Tau-1 for ptau; and 21F12 for Aβ.
Safety and Tolerability
Patients/caregivers were contacted by site staff via telephone at Week 2 to assess patient well-being and tolerability of medications. Safety and tolerability were monitored throughout the study by recording all adverse events (AEs). AEs thought to be associated with the lumbar puncture procedure were recorded separately.
Statistics
Sample size was calculated based on the primary outcome variable, change from baseline in CSF BuChE activity, at Week 13. A mean treatment difference of 0.3 U/L, a standard deviation of 0.28, and a two-sided significance level of 0.025 were assumed. Under these assumptions and using a z-test, approximately 20 patients per treatment group were required to achieve a power of 0.85 for detecting a significant pairwise treatment difference. Assuming a 20% dropout rate, approximately 75 patients were to be randomized.
The primary outcome was change from baseline in CSF BuChE activity. Other variables were change from baseline in CSF AChE activity, change from baseline in AChE and BuChE protein levels, change from baseline in total tau protein levels, change from baseline in ptau231 protein levels, and change from baseline in Aβ(1–42) protein levels. The Neuropsychiatric Inventory (NPI-10), Cambridge Neuropsychological Test Automated Battery (CANTAB) and Clinical Global Impression of Change (CGIC) were used to evaluate clinical symptoms at baseline and at Week 13, with the objective of determining whether changes in cholinesterase activities correlated with clinical measures over the short-term.
Within each treatment group, Week 13 changes from baseline for the efficacy variables were tested for statistical significance using a one-sample t-test. Changes from baseline were compared between treatment groups using an analysis of covariance model with baseline and treatment as the factors. All statistical tests were conducted against a two-sided alternative hypothesis, employing a significance level of 0.05. Summary statistics were reported for all laboratory variables by treatment group and visit. A correction factor for multiplicity was applied to the primary outcome. Secondary outcomes were not corrected for multiplicity because they are hypothesis-generating only.
Primary analyses were based on the completer population, defined as all randomized patients who completed the Week 13 assessments. Supporting analyses were based on the Intent-to-Treat (ITT) population (all randomized patients who received at least one dose of study medication and provided at least one post-baseline efficacy measurement). Safety analyses were performed on the safety population, defined as all randomized patients who received at least one dose of study treatment.
RESULTS
Patients
Sixty-three patients were randomized to treatment (Fig. 1). Patient demographics and baseline characteristics are shown in Table 1. Most patients (95.2% of the safety population) had at least one concurrent medical condition or a relevant medical history before starting study medication. MMSE scores indicated that patients had mild to moderate dementia.
Figure 1.
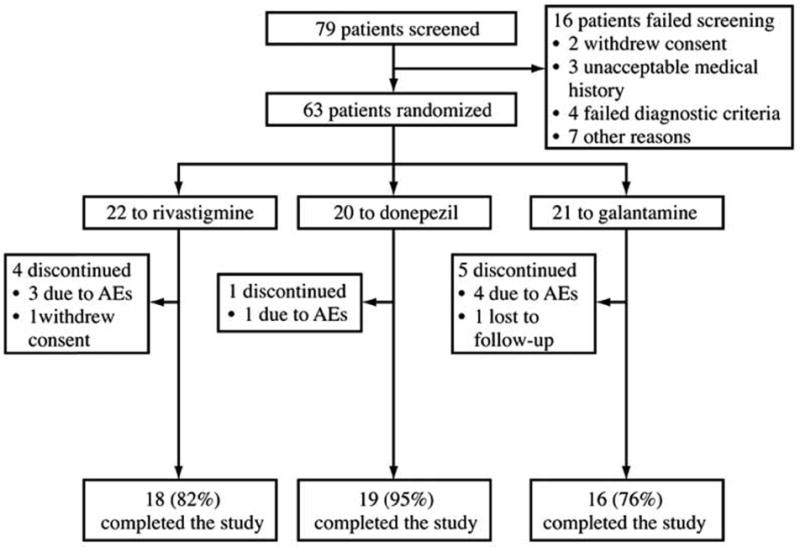
Study profile.
Table 1.
Baseline Characteristics and Demographics of Patients in Each Treatment Group (Safety Population)
| Rivastigmine (n = 22) |
Donepezil (n = 20) |
Galantamine (n = 21) |
|
|---|---|---|---|
| Mean (SD) age, years | 76.8 (8.9) | 74.0 (8.1) | 73.7 (6.5) |
| Gender, % women | 77.3% | 55.0% | 76.2% |
| Race, % Caucasian Other |
95.5% 4.5% |
100% – |
100% – |
| Mean (SD) weight, kg | 65.1 (9.7) | 65.2 (8.0) | 65.7 (11.5) |
| Mean (SD) dementia duration, years | 2.9 (2.1) | 2.7 (1.6) | 3.3 (2.1) |
| With family history of AD, % | 40.9% | 35.0% | 42.9% |
| Mean (SD) MMSE score | 18.8 (3.8) | 20.0 (3.5) | 19.2 (3.1) |
Doses of Study Drugs
Mean doses received by patients at Week 13 were rivastigmine 8.8 mg/day (range 6–12 mg/day), donepezil 9.4 mg/day (range 5–10 mg/day) and galantamine 20.8 mg/day (range 16–24 mg/day).
Safety and Tolerability
At least one AE was reported by 86%, 65% and 81% of patients in the rivastigmine, donepezil and galantamine groups, respectively. Nausea, vomiting, dizziness and diarrhea were the most common AEs (Table 2). Serious AEs were reported by 27%, 30% and 19% of patients in the rivastigmine, donepezil and galantamine groups, respectively. No deaths were reported.
Table 2.
Most Frequent* Treatment-Emergent AEs (Safety Population)
| Rivastigmine (n = 22) |
Donepezil (n = 20) |
Galantamine (n = 21) |
|
|---|---|---|---|
| Nausea | 10 (45.5%) | 2 (10.0%) | 6 (28.6%) |
| Vomiting | 4 (18.2%) | 0 | 3 (14.3%) |
| Dizziness | 3 (13.6%) | 1 (5.0%) | 3 (14.3%) |
| Headache | 3 (13.6%) | 2 (10.0%) | 2 (9.5%) |
| Diarrhea | 2 (9.1%) | 0 | 6 (28.6%) |
| Insomnia | 1 (4.5%) | 2 (10.0%) | 2 (9.5%) |
| Abdominal pain | 0 | 2 (10.0%) | 0 |
| Influenza | 1 (4.5%) | 0 | 2 (9.5%) |
| Upper respiratory tract infection | 2 (9.1%) | 1 (5.0%) | 0 |
| Weight decreased | 2 (9.1%) | 1 (5.0%) | 1 (4.8%) |
| Muscle spasms | 0 | 3 (15.0%) | 1 (4.8%) |
Events occurring in more than one patient in any treatment group are shown
Lumbar-puncture related AEs (i.e. considered by the investigator to be related) were infrequent. ‘Lumbar-puncture headache’ was reported by one patient in the donepezil group. Any other ‘headaches’ that were considered to be related to the procedure were reported by one (5%), two (10%) and two (10%) patients in the rivastigmine, donepezil and galantamine groups, respectively. Back pain considered related to the procedure was reported by two (9%), one (5%) and 1 (5%) patients, respectively. These data are to be published separately [26].
AChE and BuChE Activities
In the primary Completer population, rivastigmine inhibited AChE activities by 42.6% (p < 0.001 versus baseline) and BuChE activities by 45.4% (p < 0.001 versus baseline) (Table 3, Fig. 2). Galantamine inhibited AChE activities by 2.1% and BuChE activities by 0.5% (both P < 0.001 versus rivastigmine; p = ns versus baseline). In contrast, donepezil increased AChE and BuChE activities by 11.8% (p < 0.05 versus baseline) and 2.8% (p = ns versus baseline), respectively (both p < 0.001 versus rivastigmine). Results in the ITT population were similar except for ITT analysis of BuChE inhibition with rivastigmine, which was not statistically significant from baseline, and BuChE inhibition with galantamine was not statistically significant versus rivastigmine in the ITT population (Table 3). One of the follow-up samples in the rivastigmine group was contaminated with blood, and this may have affected the ITT results.
Table 3.
Absolute Changes from Baseline in CSF Cholinesterase Activities in Patients Receiving up to 13 Weeks’ Treatment with Rivastigmine, Donepezil or Galantamine
| Enzyme Activities | Rivastigmine | Donepezil | Galantamine |
|---|---|---|---|
| CSF BuChE | |||
| Completer population, n | 14 | 15 | 15 |
| Mean (SD) baseline activity (nmol/min/mL) | 6.6 (1.6) | 7.2 (2.1) | 6.5 (2.1) |
| Mean (SD) % inhibition at 13 weeks | 45.4%†† (29.0) | −2.8%** (12.5) | 0.5%** (14.1) |
| ITT population, n | 15 | 17 | 16 |
| Mean (SD) baseline activity (nmol/min/mL) | 6.3 (1.9) | 7.2 (2.1) | 6.6 (2.0) |
| Mean (SD) % inhibition at 13 weeks | 26.7% (77.5) | −4.1% (12.6)* | 0.9% (13.7) |
| CSF AChE | |||
| Completer population, n | 14 | 15 | 15 |
| Mean (SD) baseline activity (nmol/min/mL) | 13.9 (3.8) | 16.4 (3.7) | 14.0 (2.5) |
| Mean (SD) % inhibition at 13 weeks | 42.6%†† (18.7) | −11.8%**† (21.2) | 2.1%** (14.9) |
| ITT population, n | 15 | 17 | 16 |
| Mean (SD) baseline activity (nmol/min/mL) | 14.0 (3.7) | 16.5 (3.5) | 13.6 (2.9) |
| Mean (SD) % inhibition at 13 weeks | 38.4%†† (24.5) | −13.0%**† (20.4) | 1.9%** (14.4) |
Negative inhibition suggests that enzyme activity increased after 13 weeks of treatment
p < 0.05,
p < 0.001 versus rivastigmine, using an ANOVA model with treatment as the factor and baseline value as the covariate
p < 0.05;
p < 0.001 versus baseline at 13 weeks, using one-way t-test
Figure 2.
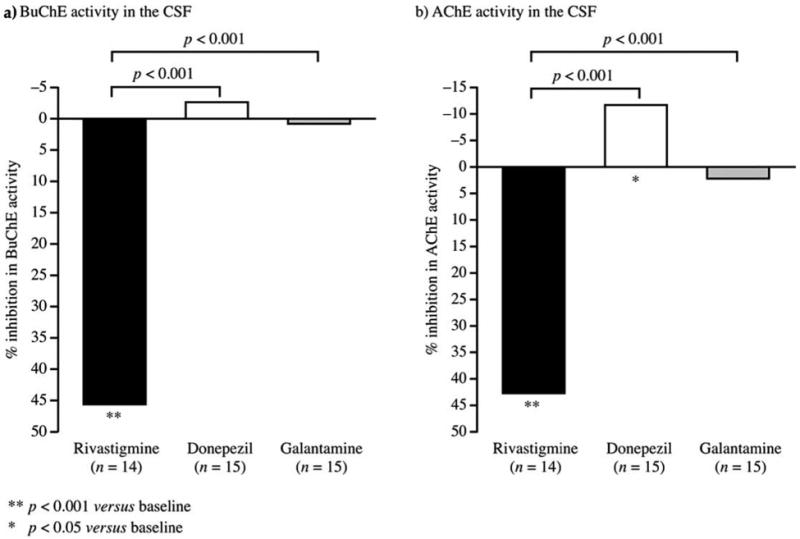
Changes from baseline in CSF cholinesterase activities (Completer population). Data calculated using the formulae: % Inhibition of AChE = [1− (AET/A0)] × 100 and %Inhibition of BuChE = [1− (BET/B0)] × 100, where A0 or B0 are AChE or BuChE activity at baseline, and AET or BET are the AChE or BuChE activity at End of Trial (ET). For these calculations only data from direct colorimetric assay were used.
Data from the three groups were combined to examine whether there were any correlations between changes in cholinesterase activity and any of the cognitive and behavioral measures in this 13 week study, but none were significant.
AChE and BuChE Protein Levels
Rivastigmine treatment appeared to result in decreased AChE (p < 0.001 versus baseline) and BuChE (p = ns versus baseline) protein levels, while donepezil and galantamine treatment tended to lead to significant increased protein levels (Table 4, Fig. 3). In the primary completer population, donepezil caused a 215.2% increase in AChE (< 0.001 versus baseline and versus rivastigmine) and a 0.4% increase in BuChE protein levels (p = ns versus baseline and rivastigmine). Galantamine caused a 51.2% increase in AChE (p < 0.001 versus baseline and p < 0.01 versus rivastigmine) and a 10.5% increase in BuChE protein levels (p = ns versus baseline and versus rivastigmine). Results in the ITT population were similar and supportive, except for ITT changes in AChE protein levels rivastigmine, which were not statistically significant from baseline (Table 4).
Table 4.
Changes from Baseline in CSF Cholinesterase Protein Levels
| Protein Levels | Rivastigmine | Donepezil | Galantamine |
|---|---|---|---|
| CSF BuChE | |||
| Completer population, n | 14 | 15 | 15 |
| Mean (SD) baseline levels (µg/mL) | 25.1 (13.7) | 21.3 (11.5) | 18.6 (5.2) |
| Mean (SD) % change at 13 weeks | −9.3% (24.4) | 0.4% (25.0) | 10.5% (24.1) |
| ITT population, n | 15 | 17 | 16 |
| Mean (SD) baseline levels (µg/mL) | 24.5 (13.4) | 21.4 (10.8) | 18.2 (5.4) |
| Mean (SD) % change at 13 weeks | −7.4% (24.6) | −0.4% (23.5) | 10.4% (23.2) |
| CSF AChE | |||
| Completer population, n | 14 | 14 | 15 |
| Mean (SD) baseline levels (μg/mL) | 3.4 (0.8) | 3.9 (0.9) | 3.4 (0.6) |
| Mean (SD) % change at 13 weeks | −21.8%†† (12.6) | 215.2%**†† (100.5) | 51.2%**†† (45.5) |
| ITT population, n | 15 | 16 | 16 |
| Mean (SD) baseline levels (μg/mL) | 3.4 (0.8) | 4.0 (1.0) | 3.3 (0.7) |
| Mean (SD) % change at 13 weeks | −14.5% (30.9) | 224.5%**†† (109.5) | 51.2%*†† (44.0) |
| CSF AChE-R | |||
| Completer population, n | 14 | 14 | 15 |
| Mean (SD) baseline levels (μg/mL) | 2.1 (0.7) | 2.4 (0.9) | 2.0 (0.4) |
| Mean (SD) % change at 13 weeks | −23.4%†† (15.3) | 193.3%**†† (163.5) | 98.9%*† (100.3) |
| ITT population, n | 15 | 16 | 16 |
| Mean (SD) baseline levels (μg/mL) | 2.0 (0.7) | 2.4 (0.8) | 2.0 (0.5) |
| Mean (SD) % change at 13 weeks | −11.9% (50.0) | 240.1%**† (250.0) | 101.2%*†† (97.4) |
| CSF AChE-S | |||
| Completer population, n | 14 | 15 | 15 |
| Mean (SD) baseline levels (μg/mL) | 1.7 (0.8) | 2.1 (1.6) | 1.6 (0.8) |
| Mean (SD) % change at 13 weeks | −20.3%†† (15.0) | 166.0%**†† (66.0) | 53.2%**†† (47.2) |
| ITT population, n | 15 | 17 | 16 |
| Mean (SD) baseline levels (μg/mL) | 1.7 (0.8) | 2.1 (1.5) | 1.6 (0.8) |
| Mean (SD) % change at 13 weeks | −12.6% (32.8) | 165.8%**†† (62.8) | 53.4%**†† (45.6) |
| Mean (SD) AChE-R/S Ratio | |||
| Changes from baseline | 1.4† (2.0) | 0.6†† (0.3) | 0.4 (4.7) |
Negative changes suggests that protein levels decreased after 13 weeks of treatment
p < 0.001 versus rivastigmine, using an ANOVA model with treatment as the factor and baseline value as the covariate;
p < 0.05;
p < 0.001 versus baseline at 13 weeks, using one-way t-test
Figure 3.
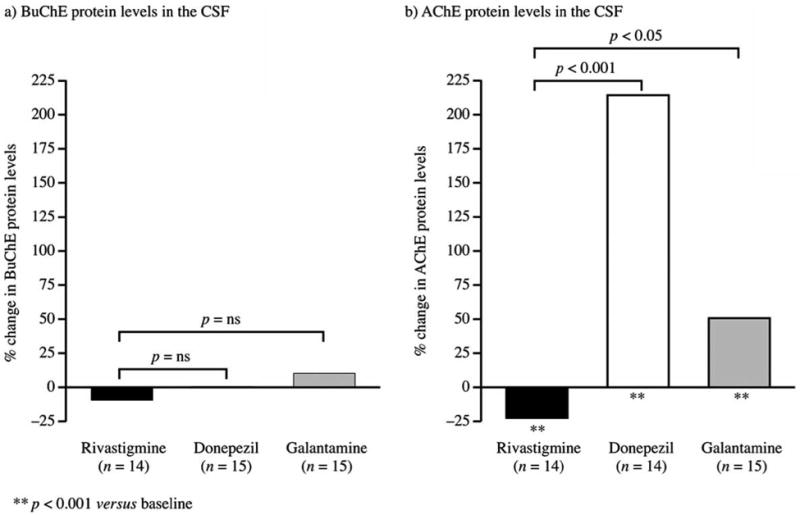
Changes from baseline in CSF cholinesterase protein levels (Completer population).
AChE Isoforms
The pattern of differential effects with rivastigmine versus donepezil or galantamine was consistent for both AChER and AChE-S splice variants (Table 4). Donepezil appeared to reduce the AChE-R/S ratios (p < 0.001 versus baseline), and rivastigmine appeared to increase them (p < 0.05 versus baseline). However, between-group differences were not statistically significant (Table 4).
Immunoblotting analysis also indicated differential changes in the relative protein expression of the G2 and G4 molecular isoforms of the AChE-S variant following treatment with donepezil or galantamine, versus rivastigmine. In donepezil-treated patients, the relative expression of the G2 form showed a significant increase (749.4%), much greater than that of the G4 form (108.9%) (both p ≤ 0.001 versus baseline and versus rivastigmine; Completer population). A similar but less pronounced finding was observed in the galantamine group, in which G2 and G4 levels increased by 75.9% (p < 0.01 versus baseline; p = ns versus rivastigmine) and 51.3% (p = 0.001 versus baseline; p < 0.001 versus rivastigmine), respectively. In the rivastigmine group there was a non-significant increase in G2 (8.4%) and a reduction in G4 (16.3%; p < 0.01 versus baseline) protein levels after 13 weeks of treatment.
Tau, ptau, and Aβ Protein Levels
Mean changes from baseline in ptau231 protein levels in the Completer population were 2.0 pg/mL in the rivastigmine group, 3.1 pg/mL in the donepezil group (p < 0.05 versus baseline) and −3.1 pg/mL in the galantamine group (p <0.05 versus rivastigmine). Mean changes from baseline in total tau protein levels in the rivastigmine, donepezil and galantamine groups were 0.2 pg/mL, 91.4 pg/mL (p < 0.05 versus baseline) and −9.7 pg/mL, respectively. Results were similar and supportive in the ITT population.
Mean changes from baseline in Aβ protein levels in the Completer population were −34.2 pg/mL in the rivastigmine, 16.4 pg/mL in the donepezil and 55.2 pg/mL in the galantamine group. Changes in the rivastigmine versus galantamine groups were significantly different (p < 0.05); changes in the rivastigmine versus donepezil groups were not significantly different. In the ITT population, no significant between-group differences were reported.
DISCUSSION
This is the first direct comparison of the three most commonly-used ChEIs and their effects on the activities and protein levels of target enzymes in AD patients. Rivastigmine treatment significantly reduced CSF BuChE and AChE activities in the primary analysis population and did not increase AChE protein levels, while donepezil and galantamine were associated with increased or unchanged AChE activities and significant increases in AChE protein levels.
Donepezil and galantamine had no significant effects on BuChE activities or protein levels. The effect of donepezil on AChE protein levels, causing a ~215% increase, was particularly striking. The findings are consistent with those of earlier studies [3, 16, 24, 27–30]. Whether these effects are mediated at the level of transcription or represent posttranslational changes, these findings indicate that there appear to be important pharmacologic differences between the three agents.
Findings from the ITT and Completer analyses of BuChE activity in the rivastigmine group were not consistent. One of the follow-up samples was contaminated with blood, and this sample gave false high results for the BuChE activity in the ITT analysis. It also explains the large standard deviation for ITT BuChE inhibition in the rivastigmine group at 13 weeks. For BuChE activity in the rivastigmine group, the Completer analysis, which excluded the contaminated sample, is a more reliable measure of drug effect.
Changes in AChE protein levels might have the potential to have clinically relevant effects. Adaptive up-regulation of AChE-R, which may be age-related, is normally seen following mild stress and endotoxin challenge, and may offer neuroprotective effects [4, 31]. In the non-neuronal cholinergic system extracellular ACh acts as a local anti-inflammatory cellular signaling molecule that reduces the activation of glial and neuroendothelial cells [4]. Short-term treatment with cholinesterase inhibitors has been shown to down-regulate pro-inflammatory cytokines in AD patients [32]. Apart from its involvement in inflammation through its ACh hydrolyzing activity, AChE-R may also possess distinct noncatalytic properties that increase levels of pro-inflammatory cytokines [32, 33]. The AChE-R splice variant and/or AChE activity have been linked with inflammatory processes such as astrocytosis and gliosis in the AD brain [34, 35]. However, extreme stress or accumulated mild stress that results in very high and/or chronically elevated AChE-R levels may not be neuroprotective [4]. An increased AChE-R/S ratio in CSF has been shown to correlate positively with a sustained cognitive improvement on MMSE assessment in tacrine-, rivastigmine-, or donepezil-treated AD patients [24, 25]. In the current study, rivastigmine was shown to not significantly increase overall AChE protein from baseline levels, but to induce a relative increase in AChE-R levels with a significant increase in the AChE-R/S ratio relative to baseline. This finding is consistent with a previous study in which rivastigmine caused a selective increase in levels of AChE-R but not AChE-S [25]. In the current study, differences in the change from baseline in AChE-R/S ratios between drugs were not statistically significant. Further investigation is required into whether alteration in CSF R/S ratios reflect beneficial or adverse effects on short and longer-term neurodegenerative and neuroprotective processes.
AChE monomers are associated with plaques early in the process of amyloid accumulation [36], and are also found in tangles [37]. Aβ–AChE complexes are more toxic than amyloid fibrils and they promote amyloid formation, glial β-APP expression, glial cell activation, and neurotoxicity [38, 39]. Transgenic mice models that over-express both the human amyloid precursor protein (APPswe) and human AChE have accelerated and more intense development of plaque pathology that correlates strongly with cognitive impairment [38]. Of the AChE inhibitors currently in use, only donepezil has been shown to block some of the aggregation capacity (approximately 20%) of AChE [40].
AChE exists in various globular forms containing one, two, or four catalytic subunits (G1, G2, G4). In the brains of patients with AD, the level of the usually membrane-bound tetrameric or G4 form of AChE is selectively reduced by 90% or more in certain brain regions, probably due to the loss of presynaptic terminals [41]. In CSF the G1 and G2 forms of AChE may have less catalytic activity relative to the G4 form [25]. In the current study, the main increase in the protein level of CSF AChE in the donepezil group corresponded to the marked and statistically significant increases (more than 700%) from baseline of the G2 molecular form of AChE-S, consistent with previous findings that donepezil treatment leads to a significant decrease in the G4:G1+G2 ratio [29]. In contrast, the lack of significant increases in G2 forms by rivastigmine in the current study confirms a previous finding in rivastigmine-treated AD patients that contrasted with an over two-fold increase in the expression of the G2 AChE-S isoform in tacrine-treated and untreated patients observed after 1-year follow-up [25].
The functional localization of AChE-S in cholinergic synapses may be controlled by the amount of protein anchors present on the synaptic membrane. Thus, it may be speculated that the gradual upregulation of AChE-S may not significantly impact cholinergic neurotransmission as nonmembrane bound AChE-S, like the soluble AChE-R, will simply diffuse out of the synapse into the extracellular fluid. Estimation of the proportion of the total CSF and AChE-S splice variant protein that is inhibited by drug, rather than the percentage change in overall CSF AChE activity, may be more relevant for evaluating the impact on cholinergic neurotransmission in the brain [42]. The major impact of the increases in AChE protein levels may be on the hydrolysis of parenchymal ACh and due to the non-catalytic functions of the AChE protein, with putative influences on inflammatory cascades. Longer-term therapeutic effects in AD patients with relatively greater levels of neuro-inflammation may be of relevance to sustained inhibition of non-synaptic AChE and BuChE. Patient subpopulations might include those with significantly greater burdens of AD pathology and those with both AD and Lewy body pathology [43, 44].
Effects of rivastigmine on biomarker levels were consistent with previous findings that this agent does not affect tau, ptau231 or Aβ protein levels [30]. Donepezil caused significant increases from baseline in total tau and ptau231 protein levels whereas in an earlier study, 12 months of donepezil treatment resulted in a trend for increasing CSF Aβ protein levels but no changes in tau [29]. In summary, statistically significant differences observed on potential biomarkers of neurodegeneration (tau and Aβ) were small and difficult to interpret. However, differential effects following treatment with different individual agents, if confirmed, may be worthy of further investigation in larger studies of longer duration.
The mechanisms underlying changes in AChE and BuChE activities and protein levels following rivastigmine, donepezil or galantamine treatment have yet to be fully elucidated. However, based on information currently available, the authors propose five possible theories. The first is that both donepezil and galantamine – but not rivastigmine [45] –might interact with the peripheral anionic site (PAS) on the AChE molecule, which mediates upregulation [46, 47]. The second pertains to the mechanism of inhibition, and the lack of strong AChE upregulation with irreversible or slowly reversible inhibitors of AChE such as metrifonate [48] and rivastigmine [18, 25], in contrast to very rapidly reversible inhibitors such as tacrine, donepezil and galantamine. In support of these first two theories, a recent 12-month study in 20 AD patients showed that phenserine (which like rivastigmine is a carbamate that does not interact with the PAS and is slowly reversible; unlike rivastigmine it is AChE-selective) significantly increased glucose metabolism in several cortical regions. This correlated positively with improved cognitive function and reductions in amyloid load, and provided significantly different results to donepezil [49], suggesting that interaction/non-interaction with the PAS and slowly/rapidly reversible inhibition might be the common features underlying the differences seen in these studies. It is our hypothesis that slow/rapid reversible inhibition is a leading feature: the neurons may sense that by increasing the expression of AChE, the equilibrium between the AChE and the inhibitor could be shifted, re-equilibrating synaptic ACh. A third theory relies on the finding that BuChE expression regulates AChE expression [50], and the supposition that inhibition of BuChE by rivastigmine (but not donepezil or galantamine, which are AChE-selective) may regulate the gene expression of AChE. Fourthly, it has been suggested that increases in AChE during treatment with particular ChEIs may be due to the upregulation of AChE gene expression [51], reflecting feedback mechanisms via muscarinic ACh receptors [52]. However, this mechanism does not explain the lack of overall AChE upregulation with rivastigmine. The fifth and last hypothesis is that reductions in inflammation with sustained inhibition of cholinesterases may reduce astroglial activation and release of usually monomeric AChE and BuChE isoforms [53]. It has recently been suggested that astroglia may be the predominant source of AChE-R secretion [53].
The current study is limited by its open-label nature, although laboratory staff members analyzing CSF were blinded to the treatment and baseline MMSE scores of the patients. Furthermore, the study was prospectively powered to detect differences between the treatment groups only on the primary endpoint (CSF BuChE activity change from baseline). Caution should be taken when generalizing the results to all cholinergic function in the brain as CSF levels may not be representative of activities or protein levels in the synaptic fluid, and the study population might not be representative of the AD population at large. Such differences might have affected the findings of the current study, as might the slightly higher baseline AChE activity, in the donepezil group, although the ANOVA analysis was designed to account for baseline differences so their effects on statistical tests should have been minimal.
It would be of interest to evaluate correlations between treatment effects on CSF enzyme activities and protein levels and clinical outcomes (e.g. measures of cognition, activities of daily living). However, published studies have shown that active treatment groups usually do not diverge until patients have been on treatment for at least a year [44, 54, 55].
Another consideration is the methodology used to estimate AChE protein levels and the pseudo-irreversible action of rivastigmine on AChE. It was necessary to use the ELISA-like assay because there are no commercially available antibody pairs that could be used in a classic Sandwich ELISA. The ELISA-like assay uses inherent AChE activity captured in the wells of the ELISA plate for the detection system following addition of substrate. This approach will not affect results of reversible AChE inhibitors such as donepezil and galantamine, since subsequent washing steps in the protocol will have removed these agents. However, the removal of rivastigmine might have been incomplete during the washing steps due to the pseudo-irreversible binding of rivastigmine to the immunocaptured AChE molecules in the wells. Thus, due to incomplete reactivation of AChE molecules, the net effect could be that AChE protein level measures using this approach might have been underestimated in the follow-up samples of rivastigmine treated patients.
In conclusion, after 3 months of treatment at clinically relevant doses in AD patients, CSF findings demonstrate that, relative to baseline, rivastigmine reduces AChE and BuChE activities and leaves protein levels unchanged or slightly reduced; donepezil markedly increases AChE protein levels and increases overall AChE activity, and galantamine more modestly increases AChE protein levels resulting in a net no-change effect on AChE activity. These findings suggest significant pharmacologic differences between these agents and it is important that the clinical implicationsof these differences are elucidated.
Table 5.
Changes from Baseline in Tau, Ptau and Aβ Protein Levels in the CSF (Completer Population)
| Protein Levels | Rivastigmine | Donepezil | Galantamine |
|---|---|---|---|
| tau | |||
| Completer population, n | 17 | 17 | 15 |
| Mean (SD) baseline levels (pg/mL) | 521.7 (338.7) | 879.4 (314.1) | 591.0 (227.1) |
| Mean % change at 13 weeks | 0.4% | 10.4%† | −1.6% |
| ptau | |||
| Completer population, n | 17 | 17 | 15 |
| Mean (SD) baseline levels (pg/mL) | 45.6 (25.6) | 84.2 (34.0) | 63.7 (26.9) |
| Mean % change at 13 weeks | 4.4% | 3.7%† | −0.5%* |
| Aβ | |||
| Completer population, n | 17 | 17 | 15 |
| Mean (SD) baseline levels (pg/mL) | 381.7 (141.4) | 347.5 (137.9) | 317.7 (125.7) |
| Mean % change at 13 weeks | −9.0% | 4.7% | 17.4%* |
Negative changes suggests that protein levels decreased after 13 weeks of treatment
p < 0.05 versus rivastigmine, using an ANOVA model with treatment as the factor and baseline value as the covariate;
p < 0.05 versus baseline at 13 weeks, using one-way t-test
Acknowledgments
This study was sponsored by Novartis Pharmaceuticals Corporation. Swedish Research Council (project no 05817), KI foundations; L-H Osterman; and Stohne’s foundations are acknowledged (for support of A.N. and T.D.S.). Alpha-Plus Medical Communications Ltd (UK) provided editorial assistancewith the production of the manuscript.
Disclosures: AN, TD-S and MM were responsible for the enzyme analysis and received research sponsorship from Novartis. HS was a study investigator; her institutes received research sponsorship from Novartis for this study. EP was a consultant for methods of CSF collection. GE and RL are full-time employees of Novartis.
References
- 1.Weihe E, Schutz B, Hartschuh W, Anlauf M, Schafer MK, Eiden LE. Coexpression of cholinergic and noradrenergic phenotypes in human and nonhuman autonomic nervous system. J Comp Neurol. 2005;492:370–379. doi: 10.1002/cne.20745. [DOI] [PMC free article] [PubMed] [Google Scholar]
- 2.Daniels MP. Intercellular communication that mediates formation of the neuromuscular junction. Mol Neurobiol. 1997;14:143–170. doi: 10.1007/BF02740654. [DOI] [PubMed] [Google Scholar]
- 3.Lane RM, Kivipelto M, Greig NH. Acetylcholinesterase and its inhibition in Alzheimer disease. Clin Neuropharmacol. 2004;27:141–149. doi: 10.1097/00002826-200405000-00011. [DOI] [PubMed] [Google Scholar]
- 4.Ben-Shaul Y, Bergman H, Soreq H. Acetylcholinesterase, cholinergic signaling and Parkinson’s disease. In: Hanin I, Cacabelos R, Fisher A, editors. Recent Progress in Alzheimer’s and Parkinson’s diseases. Taylor & Francis; London and New York: 2005. pp. 33–44. [Google Scholar]
- 5.Tracey KJ, Czura CJ, Ivanova S. Mind over immunity. FASEB J. 2001;15:1575–1576. doi: 10.1096/fj.01-0148hyp. [DOI] [PubMed] [Google Scholar]
- 6.Grisaru D, Sternfeld M, Eldor A, Glick D, Soreq H. Structural roles of acetylcholinesterase variants in biology and pathology. Eur J Biochem. 1999;264:672–686. doi: 10.1046/j.1432-1327.1999.00693.x. [DOI] [PubMed] [Google Scholar]
- 7.Darvesh S, Grantham DL, Hopkins DA. Distribution of butyrylcholinesterase in the human amygdala and hippocampal formation. J Comp Neurol. 1998;393:374–390. [PubMed] [Google Scholar]
- 8.Mesulam M, Guillozet A, Shaw P, Quinn B. Widely spread butyrylcholinesterase can hydrolyze acetylcholine in the normal and Alzheimer brain. Neurobiol Dis. 2002;9:88–93. doi: 10.1006/nbdi.2001.0462. [DOI] [PubMed] [Google Scholar]
- 9.Meshorer E, Soreq H. Virtues and woes of AChE alternative splicing in stress-related neuropathologies. Trends Neurosci. 2006;29:216–224. doi: 10.1016/j.tins.2006.02.005. [DOI] [PubMed] [Google Scholar]
- 10.Kovarik Z, Simeon-Rudolf V. Interaction of human butyrylcholinesterase variants with bambuterol and terbutaline. J Enzyme Inhib Med Chem. 2004;19:113–117. doi: 10.1080/14756360410001667300. [DOI] [PubMed] [Google Scholar]
- 11.Massoulie J, Bon S. The C-terminal T peptide of cholinesterases: structure, interactions, and influence on protein folding and secretion. J Mol Neurosci. 2006;30:233–236. doi: 10.1385/JMN:30:1:233. [DOI] [PubMed] [Google Scholar]
- 12.Ben Aziz-Aloya R, Sternfeld M, Soreq H. Promoter elements and alternative splicing in the human ACHE gene. Prog Brain Res. 1993;98:147–153. doi: 10.1016/s0079-6123(08)62392-4. [DOI] [PubMed] [Google Scholar]
- 13.Liao J, Heider H, Sun MC, Brodbeck U. Different glycosylation in acetylcholinesterases from mammalian brain and erythrocytes. J Neurochem. 1992;58:1230–1238. doi: 10.1111/j.1471-4159.1992.tb11333.x. [DOI] [PubMed] [Google Scholar]
- 14.Poirier J. Evidence that the clinical effects of cholinesterase inhibitors are related to potency and targeting of action. Int J Clin Pract Suppl. 2002:6–19. [PubMed] [Google Scholar]
- 15.Weinstock M. Selectivity of cholinesterase inhibition. Clinical implications for the treatment of Alzheimer’s disease. CNS Drugs. 1999;12:307–323. [Google Scholar]
- 16.Davidsson P, Blennow K, Andreasen N, Eriksson B, Minthon L, Hesse C. Differential increase in cerebrospinal fluidacetylcholinesterase after treatment with acetylcholinesterase inhibitors in patients with Alzheimer’s disease. Neurosci Lett. 2001;300:157–160. doi: 10.1016/s0304-3940(01)01586-5. [DOI] [PubMed] [Google Scholar]
- 17.Nordberg A, Amberla K, Shigeta M, Lundqvist H, Viitanen M, Hellström-Lindahl E, et al. Long-term tacrine treatment in three mild Alzheimer patients: effects on nicotinic receptors, cerebral blood flow, glucose metabolism, EEG, and cognitive abilities. Alzheimer Dis Assoc Disord. 1998;12:228–237. doi: 10.1097/00002093-199809000-00017. [DOI] [PubMed] [Google Scholar]
- 18.Darreh-Shori T, Almkvist O, Guan ZZ, Garlind A, Strandberg B, Svensson AL, et al. Sustained cholinesterase inhibition in AD patients receiving rivastigmine for 12 months. Neurology. 2002;59:563–572. doi: 10.1212/wnl.59.4.563. [DOI] [PubMed] [Google Scholar]
- 19.Diagnostic Criteria from DSM-IV. American Psychiatric Association; 1994. [Google Scholar]
- 20.McKhann G, Drachman D, Folstein M, Katzman R, Price D, Stadian EM. Clinical diagnosis of Alzheimer’s disease: report of the NINCDS-ADRDA Work Group under the auspices of Department of Health and Human Services Task Force on Alzheimer’s Disease. Neurology. 1984;34:939–944. doi: 10.1212/wnl.34.7.939. [DOI] [PubMed] [Google Scholar]
- 21.Ellman GL, Courtney KD, Andres V, Jr, Feather-Stone RM. A new and rapid colorimetric determination of acetylcholinesterase activity. Biochem Pharmacol. 1961;7:88–95. doi: 10.1016/0006-2952(61)90145-9. [DOI] [PubMed] [Google Scholar]
- 22.Farlow MR, Enz A, Steadman J, Koumaras B, Gunay I. The effects of rivastigmine, donepezil, and galantamine on cholinesterase activity in CSF of Alzheimer’s disease patients. Poster presented at the Annual Meeting of the American Psychiatric Association; Toronto, Canada. 2006. [Google Scholar]
- 23.Darreh-Shori T, Kadir A, Almkvist O, Grut M, Wall A, Blomquist G, et al. Inhibition of acetylcholinesterase in CSF versus brain assessed by 11C-PMP PET in AD patients treated with galantamine. Neurobiol Aging. 2008;29:168–84. doi: 10.1016/j.neurobiolaging.2006.09.020. [DOI] [PubMed] [Google Scholar]
- 24.Darreh-Shori T, Meurling L, Pettersson T, Hugosson K, Hellstrom-Lindahl E, Andreasen N, et al. Changes in the activity and protein levels of CSF acetylcholinesterases in relation to cognitive function of patients with mild Alzheimer’s disease following chronic donepezil treatment. J Neural Transm. 2006;113:1791–1801. doi: 10.1007/s00702-006-0526-2. [DOI] [PubMed] [Google Scholar]
- 25.Darreh-Shori T, Hellstrom-Lindahl E, Flores-Flores C, Guan ZZ, Soreq H, Nordberg A. Long-lasting acetylcholinesterase splice variations in anticholinesterase-treated Alzheimer’s disease patients. J Neurochem. 2004;88:1102–1113. doi: 10.1046/j.1471-4159.2003.02230.x. [DOI] [PubMed] [Google Scholar]
- 26.Peskind E, Nordberg A, Darreh-Shori T, Soininen H. Safety of lumbar puncture procedures in patients with Alzheimer’s disease. Curr Alzheimer Res. doi: 10.2174/156720509788486509. submitted. [DOI] [PMC free article] [PubMed] [Google Scholar]
- 27.Lane RM, Potkin SG, Enz A. Targeting acetylcholinesterase and butyrylcholinesterase in dementia. Int J Neuropsychopharmacol. 2006;9:101–124. doi: 10.1017/S1461145705005833. [DOI] [PubMed] [Google Scholar]
- 28.Amici S, Lanari A, Romani R, Antognelli C, Gallai V, Parnetti L. Cerebrospinal fluid acetylcholinesterase activity after long-term treatment with donepezil and rivastigmine. Mech Ageing Dev. 2001;122:2057–2062. doi: 10.1016/s0047-6374(01)00314-1. [DOI] [PubMed] [Google Scholar]
- 29.Garcia-Ayllon MS, Silveyra MX, Andreasen N, Brimijoin S, Blennow K, Sáez-Valero J. Cerebrospinal fluid acetylcholinesterase changes after treatment with donepezil in patients with Alzheimer’s disease. J Neurochem. 2007;101:1701–1711. doi: 10.1111/j.1471-4159.2007.04461.x. [DOI] [PubMed] [Google Scholar]
- 30.Stefanova E, Blennow K, Almkvist O, Hellstrom-Lindahl E, Nordberg A. Cerebral glucose metabolism, cerebrospinal fluidbeta-amyloid1–42 (CSF-Abeta42), tau and apolipoprotein E genotype in long-term rivastigmine and tacrine treated Alzheimer disease (AD) patients. Neurosci Lett. 2003;338:159–163. doi: 10.1016/s0304-3940(02)01384-8. [DOI] [PubMed] [Google Scholar]
- 31.Ofek K, Krabbe KS, Evron T, Debecco M, Nielsen AR, Brunnsgaad H, et al. Cholinergic status modulations in human volunteers under acute inflammation. J Mol Med. 2007;85:1239–1251. doi: 10.1007/s00109-007-0226-x. [DOI] [PubMed] [Google Scholar]
- 32.Pollak Y, Gilboa A, Ben-Menachem O, Ben-Hur T, Soreq H, Yirmiya R. Acetylcholinesterase inhibitors reduce brain and blood interleukin-1beta production. Ann Neurol. 2005;57:741–745. doi: 10.1002/ana.20454. [DOI] [PubMed] [Google Scholar]
- 33.Grisaru D, Pick M, Perry C, Sklan EH, Almog R, Goldberg I, et al. Hydrolytic and nonenzymatic functions of acetylcholinesterase comodulate hemopoietic stress responses. J Immunol. 2006;176:27–35. doi: 10.4049/jimmunol.176.1.27. [DOI] [PubMed] [Google Scholar]
- 34.Fukuyama R, Izumoto T, Fushiki S. The cerebrospinal fluid level of glial fibrillary acidic protein is increased in cerebrospinal fluid from Alzheimer’s disease patients and correlates with severity of dementia. Eur Neurol. 2001;46:35–38. doi: 10.1159/000050753. [DOI] [PubMed] [Google Scholar]
- 35.Sternfeld M, Shoham S, Klein O, Flores-Flores C, Evron T, Idelson GH, et al. Excess “read-through” acetylcholinesterase attenuates but the “synaptic” variant intensifies neurodeterioration correlates. Proc Natl Acad Sci USA. 2000;97:8647–8652. doi: 10.1073/pnas.140004597. [DOI] [PMC free article] [PubMed] [Google Scholar]
- 36.Alvarez A, Alarcon R, Opazo C, Campos EO, Munoz FJ, Calderón FH, et al. Stable complexes involving acetylcholinesterase and amyloid-beta peptide change the biochemical properties of the enzyme and increase the neurotoxicity of Alzheimer’s fibrils. J Neurosci. 1998;18:3213–3223. doi: 10.1523/JNEUROSCI.18-09-03213.1998. [DOI] [PMC free article] [PubMed] [Google Scholar]
- 37.Wright CI, Geula C, Mesulam MM. Neurological cholinesterases in the normal brain and in Alzheimer’s disease: relationship to plaques, tangles, and patterns of selective vulnerability. Ann Neurol. 1993;34:373–384. doi: 10.1002/ana.410340312. [DOI] [PubMed] [Google Scholar]
- 38.Rees TM, Berson A, Sklan EH, Younkin L, Younkin S, Brimijoin S, et al. Memory deficits correlating with acetylcholinesterase splice shift and amyloid burden in doubly transgenic mice. Curr Alzheimer Res. 2005;2:291–300. doi: 10.2174/1567205054367847. [DOI] [PubMed] [Google Scholar]
- 39.von Bernhardi R, Ramirez G, De Ferrari GV, Inestrosa NC. Acetylcholinesterase induces the expression of the beta-amyloid precursor protein in glia and activates glial cells in culture. Neurobiol Dis. 2003;14:447–457. doi: 10.1016/j.nbd.2003.08.014. [DOI] [PubMed] [Google Scholar]
- 40.Inestrosa NC, Alvarez A, Dinamarca MC, Perez-Acle T, Colombres M. Acetylcholinesterase-amyloid-beta-peptide interaction: effect of Congo Red and the role of the Wnt pathway. Curr Alzheimer Res. 2005;2:301–306. doi: 10.2174/1567205054367928. [DOI] [PubMed] [Google Scholar]
- 41.Siek GC, Katz LS, Fishman EB, Korosi TS, Marquis JK. Molecular forms of acetylcholinesterase in subcortical areas of normal and Alzheimer disease brain. Biol Psychiatry. 1990;27:573–580. doi: 10.1016/0006-3223(90)90524-6. [DOI] [PubMed] [Google Scholar]
- 42.Kadir A, Darreh-Shori T, Almkvist O, Wall A, Grut M, Strandberg B, et al. PET imaging of the in vivo brain acetylcholinesterase activity and nicotine binding in galantamine-treated patients with AD. Neurobiol Aging. 2008;29:1204–1217. doi: 10.1016/j.neurobiolaging.2007.02.020. [DOI] [PubMed] [Google Scholar]
- 43.Mann DM. Pathological correlates of dementia in Alzheimer’s disease. Neurobiol Aging. 1994;15:357–360. doi: 10.1016/0197-4580(94)90033-7. discussion 379–380. [DOI] [PubMed] [Google Scholar]
- 44.Touchon J, Bergman H, Bullock R, Rapatz G, Nagel J, Lane R. Response to rivastigmine or donepezil in Alzheimer’s patients with symptoms suggestive of concomitant Lewy body pathology. Curr Med Res Opin. 2006;22:49–59. doi: 10.1185/030079906x80279. [DOI] [PubMed] [Google Scholar]
- 45.Bar-On P, Millard CB, Harel M, Dvir H, Enz A, Sussman JL, et al. Kinetic and structural studies on the interaction of cholinesterases with the anti-Alzheimer drug rivastigmine. Biochemistry. 2002;41:3555–3564. doi: 10.1021/bi020016x. [DOI] [PubMed] [Google Scholar]
- 46.Johnson G, Moore SW. The peripheral anionic site of acetylcholinesterase: structure, functions and potential role in rational drug design. Curr Pharm Des. 2006;12:217–225. doi: 10.2174/138161206775193127. [DOI] [PubMed] [Google Scholar]
- 47.Silman I, Sussman JL. Acetylcholinesterase: ‘classical’ and ‘non-classical’ functions and pharmacology. Curr Opin Pharmacol. 2005;5:293–302. doi: 10.1016/j.coph.2005.01.014. [DOI] [PubMed] [Google Scholar]
- 48.Pettigrew LC, Bieber F, Lettieri J, Wermeling DP, Schmitt FA, Tikhtman AJ, et al. Pharmacokinetics, pharmacodynamics, and safety of metrifonate in patients with Alzheimer’s disease. J Clin Pharmacol. 1998;38:236–245. doi: 10.1002/j.1552-4604.1998.tb04421.x. [DOI] [PubMed] [Google Scholar]
- 49.Kadir A, Andreasen N, Almkvist O, Wall A, Forsberg A, Engler H, et al. Effect of phenserine treatment on brain functional activity and amyloid in Alzheimer’s disease. Ann Neurol. 2008;63:621–31. doi: 10.1002/ana.21345. [DOI] [PubMed] [Google Scholar]
- 50.Layer PG, Allebrandt K, Andermann P, Bodur E, Boopathy R, Bytyqi AH, et al. On the multifunctionality of cholinesterases. Chem Biol Interact. 2005;157–158:37–41. doi: 10.1016/j.cbi.2005.10.006. [DOI] [PubMed] [Google Scholar]
- 51.Kaufer D, Friedman A, Seidman S, Soreq H. Anticholinesterases induce multigenic transcriptional feedback response suppressing cholinergic neurotransmission. Chem Biol Interact. 1999;119–120:349–360. doi: 10.1016/s0009-2797(99)00046-0. [DOI] [PubMed] [Google Scholar]
- 52.Nitsch RM, Rossner S, Albrecht C, Mayhaus M, Enderich J, Schliebs R, et al. Muscarinic acetylcholine receptors activate the acetylcholinesterase gene promoter. J Physiol Paris. 1998;92:257–264. doi: 10.1016/s0928-4257(98)80029-6. [DOI] [PubMed] [Google Scholar]
- 53.Bond CE, Patel P, Crouch L, Tetlow N, Day T, Abu-Hayyeh S, et al. Astroglia up-regulate transcription and secretion of ‘readthrough’ acetylcholinesterase following oxidative stress. Eur J Neurosci. 2006;24:381–386. doi: 10.1111/j.1460-9568.2006.04898.x. [DOI] [PubMed] [Google Scholar]
- 54.Bullock R, Touchon J, Bergman H, Gambina G, He Y, Rapatz G, et al. Rivastigmine and donepezil treatment in moderate to moderately-severe Alzheimer’s disease over a 2-year period. Curr Med Res Opin. 2005;21:1317–1327. doi: 10.1185/030079905X56565. [DOI] [PubMed] [Google Scholar]
- 55.Blesa R, Bullock R, He Y, Bergman H, Gambina G, Meyer J, et al. Effect of butyrylcholinesterase genotype on the response to rivastigmine or donepezil in younger patients with Alzheimer’s disease. Pharmacogenet Genomics. 2006;16:771–774. doi: 10.1097/01.fpc.0000220573.05714.ac. [DOI] [PubMed] [Google Scholar]