

Abstract
Background:
Glucometers allow self-monitoring of blood glucose in a convenient manner. With the availability of various glucometers, there is a persistent attempt to improve the accuracy and the precision of these glucometer readings, so as to match the laboratory values of blood glucose.
Objective:
We compared the glucometers used in hospital and out-patient settings with the laboratory reference method.
Materials and Methods:
We analyzed a total of 105 blood samples collected from in-patient and out-patient from our tertiary care hospital. Venous blood samples were collected and checked on six glucometers and the same blood sample was sent to the laboratory for glucose estimation. The laboratory value was used as a reference for comparison. The accuracy was evaluated by the ISO criteria. The results were evaluated by Bland Altman graphs, correlation coefficients, scatter plots and Clarke's error grid analysis.
Results:
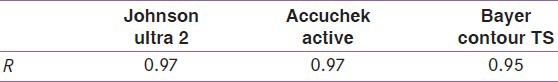
We observed good correlation between bed side glucometer and laboratory automated analyzer. Among the in-patient glucometers Breeze 2, Performa and SureStep, the correlation coefficient was 0.97, 0.96 and 0.88 respectively. Among the outpatient glucometers One touch ultra 2, Active and Contour, the correlation coefficient was 0.97, 0.97 and 0.95 respectively.
Conclusions:
There is a good correlation between different glucometers and laboratory values especially in the out-patient settings. Among all in-patient glucometers, SureStep by Johnson and Johnson had least correlation coefficient, whereas all three out-patient glucometers correlated well with the laboratory values.
Keywords: Glucometer evaluation, outpatient glucose testing, self-monitoring of blood glucose
INTRODUCTION
Diabetes Mellitus is a non-communicable disease reaching epidemic proportions globally. Both type 1 and type 2 diabetes show a direct relationship between the glycemic control and the risk of systemic complications. The American Diabetes Association (ADA) promotes self-monitoring of blood glucose (SMBG) to allow diabetic patients to achieve and maintain specific glycemic goals.
ADA recommends that all insulin-treated patients perform SMBG to (a) achieve and maintain glycemic control, (b) prevent and detect hypoglycemia, (c) adjust changes in lifestyle. SMBG is also used in establishing the need for insulin therapy in gestational diabetes mellitus.
With the introduction of glucometers, there has been an ongoing, competition-driven development in both meter and strip technology, which has allowed for greater accuracy and reliability of results. However, despite the advances in technology, there is significant variation among these monitoring devices, which has necessitated the development of performance guidelines by organizations such as the ADA[1,2] and the International Standardization Organization (ISO). The ISO guidelines recommend that the accuracy criteria for values <100 mg/dl to ±10 mg/dl and ±20% for values ≥100 mg/dl. However, the ADA recommends a ±5% variation for all values.[3,4]
Glucometers which are available in hospital settings are different from the portable glucometers used by patients at home and are not available in the open market due to marketing policies. The methods used for the estimation of blood glucose levels are similar in both the hospital based and out-patient glucometers. However the hospital based glucometers are modified taking into consideration various other parameters such as pH, oxygenation, temperature, humidity, hematocrit, hyperlipidemia, etc., Different glucometers use different principles for estimation of blood glucose levels. Some use glucose oxidase-peroxidase (GOD-POD) enzyme while some use the glucose dehydrogenase (GDH) enzyme for the estimation of blood glucose. The cost of the various glucometers and their strips also vary. We have chosen six commonly used glucometers (three hospital based and three outpatient based) and compared their reading with the laboratory values. The laboratory estimation of plasma glucose levels is based on GOD-POD method.
MATERIALS AND METHODS
This audit was conducted at P.D. Hinduja National Hospital, a 350-bedded tertiary care hospital located in Mumbai. The primary objective of the study was to compare the accuracy and efficacy of six glucometers commonly used in the hospital and out-patient settings. Three hospital based glucometers-Breeze 2 by Bayer, Accuchek Performa by Roche, SureStep by Johnson and Johnson and three from the out-patient setting glucometers-Contour TS by Bayer, Accuchek Active by Roche, One touch ultra 2 by Johnson and Johnson were compared with the laboratory readings.
A total of 105 patients were randomly selected from out-patient and inpatients settings. Efforts were made to cover all ranges of plasma glucose in the samples that were collected. Glucose levels were estimated in fasting and post prandial state from diabetic and non-diabetic patients. Upon phlebotomy, the whole blood venous sample was dropped in six different glucometers and the same venous sample was sent to the laboratory for analysis of glucose levels. The blood sample was analyzed within sixty minutes of collection by the reference laboratory GOD-POD method (Synchron Lx Systems). The calibration and the use of the glucometer strips were done according to the manufacturer instructions.
The Johnson and Johnson One-touch SureStep® and one touch Ultra 2 test strips employs a dry reagent technology based on the GOD method, which is specific for D-glucose. When a small drop of whole blood is applied to a SureStep® strip, GOD on the strip triggers the oxidation of glucose in the blood sample producing gluconic acid and hydrogen peroxide. POD on the test strip then causes the hydrogen peroxide to react with dyes to produce a blue color in the presence of oxygen. This blue color is visible through the confirmation dot on the back of the test strip. The color intensity of this dot, which is directly proportional to the level of glucose is measured and reported as a plasma-calibrated glucose result. The manufacturer's packaging insert stated that this strip method system was compared with that obtained from the YSI 2700 glucose analyzer to obtain the calibration curve.
The Accuchek Performa® and Active (Roche Diagnostics) is a new generation blood glucose strip that uses both AC and DC current to measure blood glucose levels in capillary blood. It utilizes GDH via a pyrroloquinoline mediator to measure glucose levels in the sample, which are in turn reported based on internal strip specific calibration curves. This calibration curve has been constructed using a plasma (glucose hexokinase) reference method.
The Breeze 2 and Contour TS (Bayer Health Care) is a third generation glucose monitoring system. The Breeze 2 uses autodiscs which uses GOD enzymes to measure glucose. It requires 1 μl of blood with auto calibration. The Contour TS uses the GDH-flavin adenine dinucleotide chemistry with capillary filling test strips. Both these meters use the electrode biosensor method for glucose analysis. The strip contained GOD and an electron transfer mediator, ferrocene, which replaced oxygen in the original GOD reaction; the reduced mediator was reoxidized at the electrode to generate a current detected by an amperometric sensor.
The laboratory uses a Synchron system which determines glucose concentration by an oxygen rate method employing a Bechman Coulter oxygen electrode. A precise volume of the sample is injected in a reaction cup containing a GOD solution in a fixed proportion (ratio: 1 part sample: 76 parts reagent). The peak rate of oxygen consumption is directly proportional to the concentration of glucose in the sample.
RESULTS
A total of 105 patients were included in this study. Of these 63 were males and 42 were females. The mean age was 44.8 years (range 20-70 years). The standard deviation for in-patient and out-patient glucometers is summarized in Tables 1 and 2 respectively.
Table 1.
Standard deviation of inpatient glucometers

Table 2.
Standard deviation of outpatient glucometers

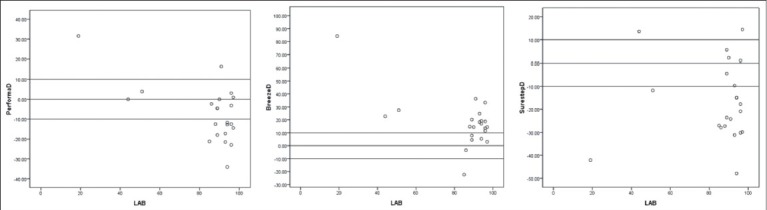
The accuracy of glucometers was determined using correlation coefficient [Graphs 1 and 2] and Bland Altman scatter plots [Graphs 3-8]. The correlation coefficient data of in-patient and out-patient glucometers is shown in Tables 3 and 4 respectively.
Graph 1.
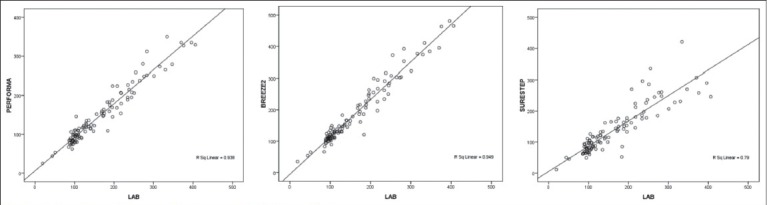
Correlation of Performa, Breeze 2 and SureStep with laboratory
Graph 2.
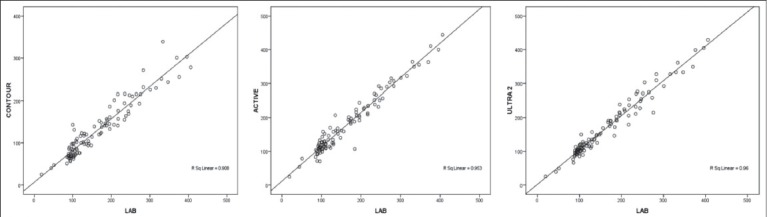
Correlation of Contour, Active and Ultra 2 with laboratory
Graph 3.
Scatter plot of Performa, Breeze 2 and SureStep with laboratory for values <100
Graph 8.
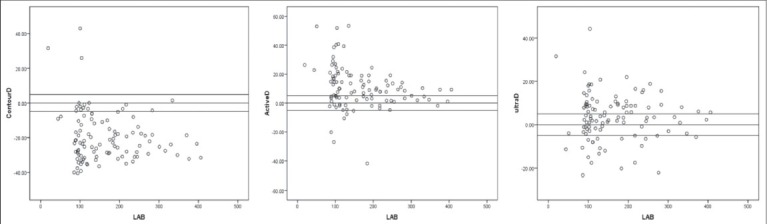
Scatter plot of Contour TS, Active and Ultra 2 with laboratory with 5% variability
Table 3.
Correlation coefficient of inpatient glucometers
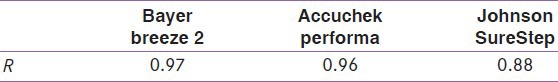
Table 4.
Correlation coefficient of outpatient glucometers
The extent to which the glucometers deviated from the reference method is represented in the Bland Altman scatter diagram. The sub analysis was performed to laboratory values <100 mg/dl [Graphs 3 and 4] and ≥100 mg/dl [Graphs 5 and 6].
Graph 4.
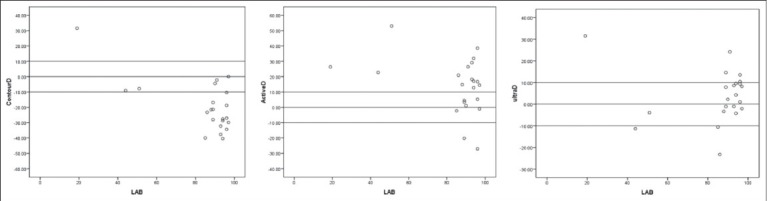
Scatter plot of with laboratory Contour TS, Active and Ultra 2 for values <100
Graph 5.
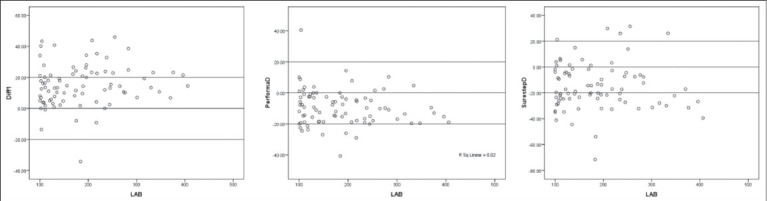
Scatter plot of Breeze 2, Performa and SureStep with laboratory for values ≥100
Graph 6.
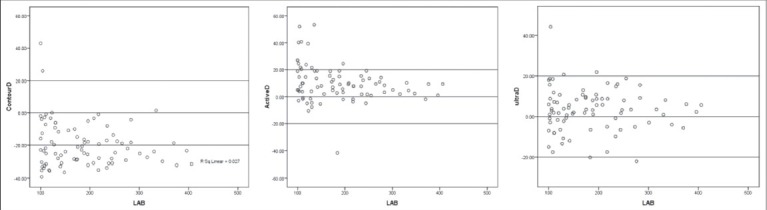
Scatter plot of Contour TS, Active and Ultra 2 with laboratory for values ≥100
ADA allows only 5% variability when compared to the laboratory values. We analyzed our data using this criterion and found that it was not practical as it was too stringent and most of the values were falling outside the valid range [Graphs 7 and 8].
Graph 7.
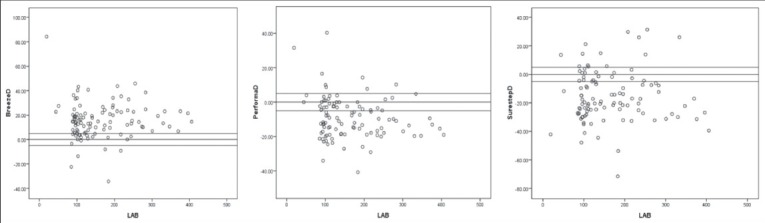
Scatter plot of Breeze 2, Performa and SureStep with laboratory with 5% variability
Clarke error grid analyses
This is an internationally recognized way of evaluating the compatibility of a blood glucose self-monitoring system with a laboratory reference.[5] Evaluation is based on comparison of clinical consequences using the test strip method and the reference. This analysis partitions the total blood glucose range into zones, based on the effects of glucose variations on diabetes treatment.
Zone A: Results to clinically correct treatment decisions either in hypoglycemia or hyperglycemia range.
Zone B: >20% deviation from the reference; represents values that would lead to benign or no treatment error.
Zone C: Represents values would lead to treatment decisions opposite to that called for by the blood glucose levels.
Zone D: Represent a failure to detect and treat errors.
Zone E: Is a clinically more serious error zone, glucose meter generated values that failed to detect hypoglycemia or hyperglycemia. Values are opposite the reference values resulting in corresponding treatment decisions opposite to those needed.
In our study, we found the following results in the error grid analysis [Tables 5 and 6].
Table 5.
Error grid analysis of inpatient glucometers
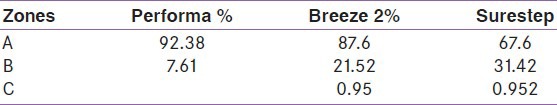
Table 6.
Error grid analysis of outpatient glucometers
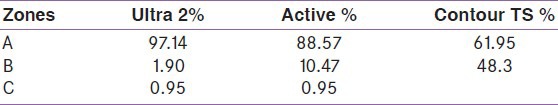
All the glucometer readings were in Zone A, B or C and none in Zone D or E. However among the indoor glucometers, Accucheck performa had maximum readings in Zone A and none in Zone C, D or E. Similarly among the outdoor glucometers, Johnsons One Touch Ultra had maximum readings in Zone A [Graphs 9 and 10].
Graph 9.
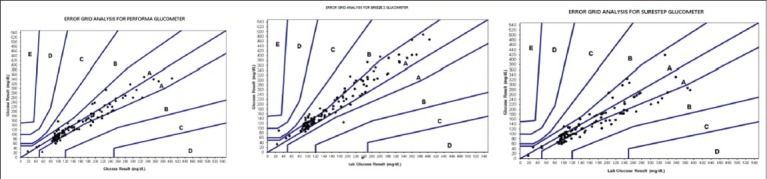
Clarke error grid analysis of Breeze 2, Performa and SureStep
Graph 10.
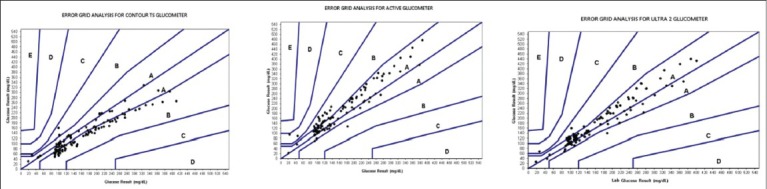
Clarke error grid analysis of Contour TS, Active and Ultra 2
DISCUSSION
Self-monitoring of blood glucose using reagent impregnated strips is a simple and integral component of Diabetes care and management. The precision and accuracy of glucometers have improved over the years. However there are still concerns regarding the standardization of the glucometers. We chose to analyze these glucometers with the ISO criteria, as among the various guidelines it seemed to be more practical. Precision of 5% as proposed by ADA appears to be impractical to achieve. It can be adjudicated from our results that the glucometers available for out-patient care are far better in terms of accuracy and precision as compared to glucometers available for in-patient care at least in research settings. The limitations of this study are that other parameters that alter or affect the glucometer readings such as hematocrit, temperature, hypoxia etc., were not studied. Furthermore the study sample was small. Validation of glucometers allows medical personnel and patients to choose the glucometers more objectively, thereby improving the quality-of-care.
ACKNOWLEDGMENT
We thank and acknowledge the contribution of our Diabetes Nurse Educator Ms. Vishaka Korgaonkar in helping us collect the data. We would also like to thank Bayer, Johnson and Johnson and Roche Diagnostic for providing us free glucometers and strips, which were returned to them upon completion of the study.
Footnotes
Source of Support: Nil
Conflict of Interest: None declared
REFERENCES
- 1.American Diabetes Association. Self-monitoring of blood glucose. Diabetes Care. 1994;17:81–6. doi: 10.2337/diacare.17.1.81. [DOI] [PubMed] [Google Scholar]
- 2.Rockville: Food and Drug Administration; 1989. U.S. Food and Drug Administration. Review criteria for assessment of portable invasive blood glucose monitoring in vitro diagnostic devices which use glucose oxidase, dehydrogenase, or hexokinase methodology. [Google Scholar]
- 3.Geneva: International Organization for Standardization; 2002. International Organization for Standardization. Determination of performance criteria for in vitro blood glucose monitoring systems for management of human diabetes mellitus. ISO 15197. [Google Scholar]
- 4.Geneva: International Organization for Standardization; 2007. International Organization for Standardization. International vocabulary of metrology-Basic and general concepts and associated terms (VIM). ISO/IEC Guide 99. [Google Scholar]
- 5.Clarke WL, Cox D, Gonder-Frederick LA, Carter W, Pohl SL. Evaluating clinical accuracy of systems for self-monitoring of blood glucose. Diabetes Care. 1987;10:622–8. doi: 10.2337/diacare.10.5.622. [DOI] [PubMed] [Google Scholar]