

Abstract
Fat appetite is determined not only by orosensory (flavor) stimuli but also by the post-oral actions of dietary fat, which promote increased attraction to the flavors of high-fat foods. Experiment 1 presents a concentration-response analysis of how intragastric (IG) fat self-infusions stimulate intake and condition flavor preferences in C57BL/6J mice trained 1 h/day. Separate groups of food-restricted mice consumed a flavored saccharin solution (the CS−) paired with IG self-infusions of water (Test 0) followed by a different flavored solution (the CS+) paired with IG self-infusions of 1.6, 3.2, 6.4 or 12.8% Intralipid (IL, soybean oil) (Tests 1–3). Following additional CS− and CS+ training sessions, a two-bottle CS+ vs. CS− choice test was conducted without infusions. Infusions of 3.2 – 12.8% IL stimulated CS+ licking in the first test session and more so in subsequent test sessions, and also conditioned significant CS+ preferences. These effects were similar to those previously observed with isocaloric glucose infusions (8–32%). IG infusion of 1.6% IL stimulated intake slightly but did not condition a CS+ preference comparable to the actions of isocaloric 4% glucose. Experiment 2 compared these subthreshold IL and glucose concentrations with that of an 1.6% IL + 4% glucose infusion. This mixture stimulated 1-h CS+ licking more rapidly but generated a preference similar to that of 1.6% IL. In 23 h/day tests, however, the IL + glucose mixture stimulated greater CS+ intakes and preferences than did 1.6% IL or 4% glucose. These findings show that fat, like glucose, rapidly generates concentration-dependent post-oral signals that stimulate intake and enhance preferences for energy-rich foods in mice.
Keywords: Post-oral fat conditioning, Intralipid, Glucose, Intragastric, Appetition
1. Introduction
The appetite for and obesity-promoting effects of high-fat diets have been extensively studied in animal models [7,13]. The overeating produced by such diets is often attributed to their palatable flavor combined with the reduced satiating actions of fat relative to other nutrients [13]. However, this description is missing an important component: the post-oral process by which high-fat diets acquire their preferred-food status. It is now well documented that the post-oral actions of fat can also stimulate food intake and induce flavor preferences through a process we refer to as appetition to distinguish it from the satiation process that suppresses feeding [31,32]. In numerous studies we and others reported that intragastric (IG) infusions of a fat emulsion paired with a novel flavored solution (conditioned stimulus, CS+) produced a preference over that of another flavor (the CS−) paired with IG water infusions [2,3,16,18,19,22,26,29,36,37]. In most experiments the rodents were trained in multiple one-bottle sessions (0.5 or 23 h/day) with each CS flavor paired with its appropriate IG infusion before a two-bottle flavor preference test was conducted. Consequently, these studies revealed little information on the initial detection of the fat in the gut and the rapidity of the appetition conditioning process. In one study we investigated the acquisition of nutrient-based flavor preferences by giving rats repeated training cycles, each comprising one CS+ and one CS− one-bottle session followed by a two-bottle choice test. Rats infused IG with 16% glucose displayed a CS+ preference in the very first choice test whereas rats trained with IG infusions of isocaloric corn oil did not display a significant preference until the fourth test [5]. These and other conditioning results indicate that the nature of the post-oral reward may differ among nutrients [31].
Recently we developed a sensitive procedure to study post-oral appetition in mice [38]. Food-restricted mice are given several daily sessions (1 h) with a CS− solution paired with IG self-infusions of water before being switched to a CS+ solution paired with IG nutrient self-infusions for three sessions. This is then followed by a two-bottle choice test with the CS+ vs. CS− no longer paired with IG infusions. A critical aspect of this procedure is that the CS flavors are presented in dilute saccharin solutions (0.025%) that produce low baseline licking rates so that nutrient-stimulation of intake is readily detected. In an initial experiment with C57BL/6J (B6) mice, IG self-infusion of 16% glucose stimulated licking of the CS+ solution within 15 min in the first session and increased total 1-h licks by 44% above CS− levels. In subsequent CS+ sessions the mice showed increased rates of licking from the very first minute indicating a conditioned response to the CS+ flavor. The mice also preferred the CS+ to the CS− by 72% in the two-bottle test without infusions. Comparable results were obtained with another group of B6 mice that self-infused an isocaloric soybean oil emulsion (Intralipid) as they drank the CS+ solution. These mice showed a less dramatic but more prolonged increase in CS+ licking in the first test session, which resulted in a 57% increase in total 1-h licks. Lick rates were further stimulated in subsequent sessions and the mice displayed a 70% CS+ preference in the two-bottle test. Thus, at the isocaloric concentration tested (0.64 kcal/g), glucose and fat have similar post-oral appetition effects in B6 mice.
In a subsequent concentration-response study we compared the appetite-stimulating effects of IG glucose self-infusions at concentrations of 2 – 32% [39]. The 2% glucose infusion failed to stimulate CS+ licking or preference, while the 4% infusion was minimally effective in that it stimulated CS+ licking slightly but did not condition a preference. The 8% and 16% glucose infusions rapidly stimulated CS+ licking in the first and subsequent sessions. In contrast, the 32% glucose infusions did not stimulate total 1-h licks but produced a dramatic increase in early licking rates and conditioned the strongest CS+ preference (91%). The failure of the 32% infusions to increase total CS+ intakes was attributed to the satiating action of the concentrated glucose solution. In support of this interpretation, total 1-h intakes of glucose solute increased monotonically with glucose concentration.
Experiment 1 of the present study extends our comparative analysis of glucose and fat appetition by determining the flavor conditioning response of B6 mice to Intralipid concentrations isocaloric to glucose infusions that stimulate CS+ licking. The results revealed strikingly similar outcomes, both in stimulation of intake during 1-h tests and in the strength of the conditioned flavor preference. Experiment 2 then determined if IG glucose and fat produce additive effects on stimulating CS+ intake and conditioning a preference. This was accomplished by comparing licking responses in separate groups of mice self-infusing marginally effective isocaloric concentrations of 4% glucose or 1.6% IL with that of mice self-infusing a 1.6% IL + 4% glucose mixture.
2. Experiment 1
2.1. Methods
2.1.1. Subjects
Adult male C57BL/6J (B6) mice (10 wk old) bred in the laboratory from Jackson Laboratories (Bar Harbor, ME) stock were singly housed in plastic tub cages kept in a test room maintained at 22°C with a 12:12-h light-dark cycle. The mice were maintained on chow (LabDiet 5001; PMI Nutrition International, Brentwood, MO) prior to food restriction. During testing they were fed fixed-size chow pellets (0.5 or 1 g, Bio-Serv, Frenchtown, NJ), which allowed for precise adjustment of daily food rations. Experimental protocols were approved by the Institutional Animal Care and Use Committee at Brooklyn College and were performed in accordance with the National Institutes of Health Guidelines for the Care and Use of Laboratory Animals.
2.1.2. Surgery
Mice were fitted with IG catheters (0.84 mm OD x 0.36 mm ID, Micro-Renathane tubing, MRE-033, Braintree Scientific, Braintree, MA) while anesthetized with isoflurane (2%) inhalation as previously described [30]. About 10 days after surgery the mice were briefly (5 min) anesthetized with isoflurane, and tubing was attached to the gastric catheter and then passed through an infusion harness with a spring tether (CIH62, Instech Laboratories, Plymouth Meeting, PA). The tubing was then attached to an infusion swivel mounted on a counterbalanced lever (Instech Laboratories). The body weight of each mouse was measured before and after it was fitted with the infusion tether/swivel system; daily body weights were monitored by weighing the mouse with the attached infusion tether/swivel system. Each animal was then returned to a tub cage and the swivel counterbalanced lever was attached above the cage.
2.1.3. Apparatus
IG infusion tests were conducted in plastic test cages [30]. The sipper spouts were interfaced via electronic lickometers (Med Electronics, St. Albans, VT) to a computer, which operated a syringe pump (A-99; Razel Scientific, Stamford, CT) that infused liquid into the gastric catheters as the animals licked. The pump rate was nominally 0.5 ml/min, but the animal controlled the overall infusion rate and volume by its licking response. In particular, the computer accumulated licks during 3-sec bins and activated the pump for 3 sec when a criterion number of licks was recorded. The oral-to-infusion intake ratio was maintained at ~1:1 by adjusting the lick criterion for each mouse. Daily oral fluid intakes were measured to the nearest 0.1 g, and IG infusions were recorded to the nearest 0.5 ml.
2.1.4. Test solutions
The CS solutions contained 0.025% sodium saccharin (Sigma Chemical Co., St. Louis, MO) flavored with 0.02% ethyl acetate or propyl acetate (Sigma). The CS− solution was paired with IG infusion of water while the CS+ solution was paired with IG infusion of Intralipid (soybean oil emulsion, 2 kcal/ml, Baxter, Deerfield, IL) diluted with water [38]. Separate groups of mice were infused with 1.6% (n=11), 3.2% (n=10), 6.4% (n=11), or 12.8% (n=11) Intralipid. These concentrations, containing 0.16, 0.32, 0.64 and 1.28 kcal/ml, were chosen to match the energy concentrations in the glucose series, starting with the minimally effective 4% glucose infusion [39]. For about half the animals in each group the CS− solution contained ethyl acetate and the CS+ solution contained propyl acetate; the flavors were reversed for the remaining animals.
2.1.5. Procedure
The mice were trained (1 h/day) in the test cages for two sessions with unflavored 0.025% sodium saccharin solution while water deprived and then for four sessions while food-restricted to 85–90% of their ad libitum body weight; saccharin intakes were paired with matched volume infusions of water. The mice were then given three 1-h test sessions with a CS− saccharin solution paired with IG water infusions followed by three sessions with the CS+ saccharin solution paired with IG infusions of the appropriate Intralipid concentration. The mice were then given four alternating sessions with the CS−, CS+, CS− and CS+, in that order, with each solution paired with its respective infusion (IG water or IG Intralipid). In the final CS− and CS+ sessions the mice were given a second sipper tube containing water not paired with IG infusions to familiarize them to the presence of two sipper tubes in the subsequent two-bottle test. The two-bottle test, with the CS+ and CS− solutions no longer paired with IG infusions, was conducted over four 1 h/day sessions. The positions of the CS+ and CS− bottles alternated daily during two-bottle testing.
2.1.6. Data Analysis
CS− licks and total intakes (oral + IG infusate) during the last two 1 h/day sessions were averaged. The data from these two sessions, referred to as Test 0, and the licks and intakes during the three CS+ sessions (Tests 1–3) were analyzed using a mixed model analysis of variance (ANOVA) with a group factor (IG Intralipid Concentration) and repeated measure factor (Tests 0–3). The mean licks of CS− and CS+ during the alternating sessions were compared in a separate ANOVA. Additional analyses are described in the results.
Mean cumulative lick curves were generated for Tests 0–3, and licking rates were also expressed as licks per 10-min bin for each test. The lick bin data were analyzed separately for each group with repeated measure ANOVA (Test x Bin) with each CS+ test compared to Test 0. If there was a Test x Bin interaction, simple main effects tests compared each Test 0 bin with each Test 1–3 bin.
2.2. Results
The mice increased their 1-h licks and total intakes when shifted from the CS− to the CS+ (Figure 1A). The groups did not differ in their CS− licks paired with IG water self-infusions (Test 0) and all four groups increased their 1-h licks when switched to the CS+ (P < 0.001) but to different degrees [Tests 1–3; Group x Test interaction, F(9,117) = 5.52, P < 0.001]. A comparison of the CS+ Tests 1–3 licks indicated that, overall, the 3.2% (1451.8 licks) and 6.4% (1550.4) groups licked more than did the 1.6% (971.0) and 12.8% (924.6) groups [F(3,39) = 10.76, P < 0.001]. Within group analyses revealed that the 1.6% group licked more in CS+ Tests 2–3 than Tests 0 and 1; the 3.2% and 6.4% groups licked more in CS+ Tests 2–3 than Tests 0 and 1 and more in Test 1 than Test 0; the 12.8% group licked more in CS+ Test 3 than in Tests 0–2 and more in CS+ Tests 1–2 than in CS− Test 0.
Figure 1.

Experiment 1. A. Mean (+sem) 1-h total licks are plotted for one-bottle Tests 0–3. The mice drank (1 h/day) a CS− flavored saccharin solution paired with IG water self-infusions in Test 0 before being switched to a CS+ flavored saccharin solution paired with IG Intralipid self-infusions in Tests 1–3. The four IG groups were infused with 1.6%, 3.2%, 6.4% and 12.8% Intralipid. Significant differences (P < 0.05) between Test 0 vs. Test 1 licks are indicated by a carat, between Tests 0–1 and Tests 2–3 licks by an asterisk, and between Tests 0–2 and Test 3 licks by a double asterisk. B. Mean (+sem) 1-h total licks are plotted for CS+ and CS− flavored saccharin solutions during the two-bottle preference test for the 1.6% – 12.8% IG Intralipid groups. CS+ and CS− intakes were not paired with IG infusions during the test. Number atop bar represents mean percent preference for the CS+ solution. Significant differences (P < 0.05) between CS+ and CS− licks are indicated by an asterisk.
The 1-h total intake data (CS solution + IG infusion g/h) revealed a similar pattern of results [Group x Test interaction, F(9,117) = 4.45, P < 0.001]. Significant increases in intakes (g/h) from CS− Test 0 to CS+ Tests 1–3 were observed with the 1.6% (2.4 to 3.3), 3.2% (2.3 to 3.9), 6.4% (2.0 to 4.0), and 12.8% (2.2 to 2.9) groups (P < 0.01). The CS− intakes of the groups did not differ in Test 0, whereas the CS+ intakes in Tests 1–3 were greater in the 1.6%, 3.2% and 6.4% groups, which did not differ statistically, than in the 12.8% group. However, when intakes in CS+ Tests 1–3 were expressed as Intralipid calories infused (kcal/h), the group intakes were directly related to concentration: 12.8% (1.84 kcal) > 6.4% (1.26) > 3.2% (0.63) > 1.6% (0.23 kcal) [F(3,39) = 100.1, P < 0.0001].
In the alternating CS sessions, the groups differed in their CS+ and CS− licks [Group x CS interaction, F(3,39) = 4.05, P = 0.013]. The 6.4% licked more (P < 0.05) for the CS+ than CS− (1688.7 vs. 1497.2 licks/h) and the 12.8% group licked less (P < 0.05) for the CS+ than CS− (1319.9 vs. 1481.4 licks/h). The remaining groups did not differ in CS+ vs. CS− licks (1.6%: 1027.8 vs. 957.2; 3.2%: 1584.2 vs. 1490.4 licks/h). The Group main effect [F(3,39) = 4.76, p < 0.01] reflected fewer licks by the 1.6% group than those of the 3.2%, 6.4% and 12.8% groups. The same effects were found in the analysis of intakes in the alternating sessions, with the exception that the 1.6% group did not differ from the 12.8% group.
The licks and total intakes of CS+ and CS− in the two-bottle preference test varied with Intralipid training concentration (Figure 1B). The 3.2%, 6.4%, and 12.8% groups licked significantly more for the CS+ than CS− (P < 0.001), while the CS licks of the 1.6% group did not differ [Group x CS interaction, F(3,39) = 16.66, P < 0.001]. Furthermore, CS+ licks increased with concentration from 1.6% to 3.2%, 6.4%, and 12.8% (P < 0.001), while CS− licks did not differ with concentration. Analysis of the CS+ and CS− intakes during the two-bottle tests revealed a similar pattern of results [Group x Test interaction, F(3,39) = 19.33, P < 0.0001]. The groups also differed in their percent CS+ licks [F(3,39) = 14.66, P < 0.001] and the 6.4% and 12.8% groups displayed the highest preferences (85% and 83%) followed by the 3.2% group (67%) and then the 1.6% group at 55%.
The one-bottle lick data for CS− Test 0 and CS+ Tests 1–3 were analyzed further to identify when licking was elevated within the CS+ sessions. Figure 2 presents the CS− and CS+ licks from Tests 0 to 3 expressed as licks/10-min bin and as cumulative lick curves. Statistical analysis was performed on the 10-min data and the cumulative lick curves are included to show the evolution of the licking response during the 1-h sessions. The 1.6% group licked more per 10-min bin in CS+ Tests 2–3 than in CS− Test 0 [F(3,30) = 22.1, P < 0.0001]. Compared to Test 0, the 1.6% group licked more (p < 0.001) in bins 1 and 2 of Tests 2 and 3 (Test x Bin interaction, F(15,150) = 2.82, P < 0.001). The 3.2% group licked more per 10-min bin in CS+ Tests 1–3 than in CS− Test 0 [F(3,27) = 26.7, P < 0.0001]. In the comparison of Tests 0 and 1, there was a main effect of Test (F(1,9) = 12.8, P < 0.01; the interaction was marginal (F(5,45) = 2.08, P = 0.08) but individual tests indicated that bins 2, 5 and 6 differed (p < 0.01). Compared to Test 0, the 3.2% group licked more (p < 0.001) in bins 1–3 of Test 2 and bins 1–2 of Test 3 (Test x Bin interaction, F(15,135) = 9.71, P < 0.0001). The 6.4% group licked more per 10-min bin in CS+ Tests 1–3 than in CS− Test 0 [F(3,30) = 27.4, P < 0.0001]. In the comparison of Tests 0 and 1, there was a main effect of Test (F(1,10) = 25.1, P < 0.001) but no interaction. Compared to Test 0, the 6.4% group licked more (p < 0.01) in all 6 bins of Tests 2 and 3 (Test x Bin interaction, F(15,150) = 6.79, P < 0.0001). The 12.8% group licked more per 10-min bin in CS+ Tests 1–3 than in CS− Test 0 [F(3,30) = 15.1, P < 0.0001]. In the comparison of Tests 0 and 1, there was a main effect of Test (F(1,10) = 10.1, P < 0.01) but no interaction. Compared to Test 0, the 12.8% group licked more (p < 0.05) in bin 1 of Test 2 and bins 1 and 6 of Test 3 (Test x Bin interaction, F(15,150) = 7.05, P < 0.0001). Thus the 3.2%, 6.4%, and 12.8% groups showed more licking overall in Test 1 than Test 0, but no 10-min bins in Test 1 significantly exceeded those of Test 0. In Tests 2 and 3, these groups all licked more in the first 10-min bin than in Test 0, and showed varying elevations in the subsequent bins.
Figure 2.
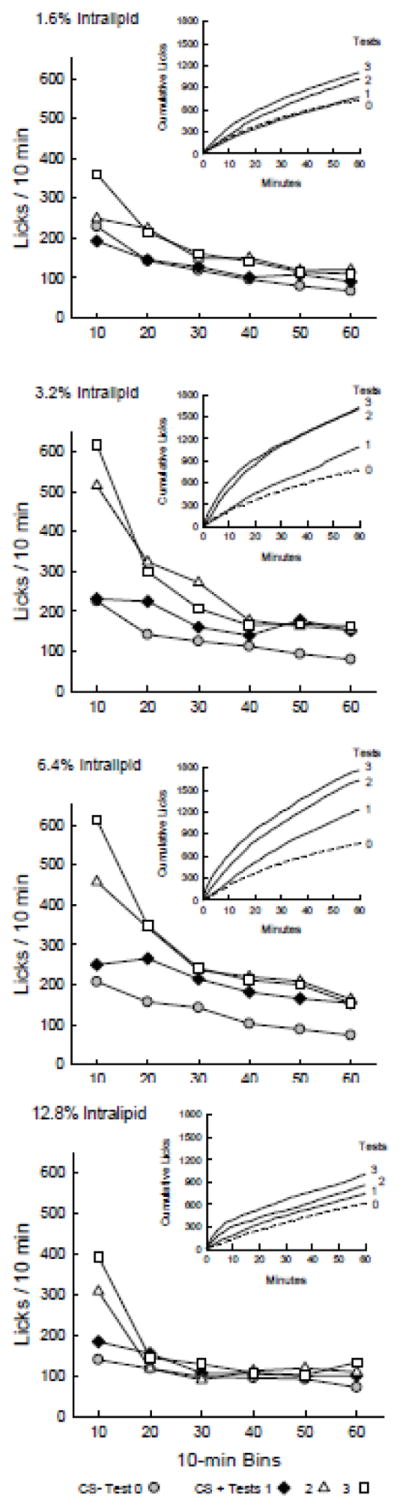
Experiment 1. Licks per 10-min bin are plotted for Test 0 with CS− flavored saccharin solution paired with IG water self-infusions, and for Tests 1 – 3 with CS+ flavored saccharin solution paired with IG Intralipid self-infusions. Graph insets plot cumulative lick curves for Tests 0–3. A. 1.6% IG Intralipid group. Analysis of the 10-min data revealed no differences in licks per bin between CS+ Tests 1–3 and CS− Test 0. B. 3.2% IG Intralipid group. The mice licked more (P < 0.05) for CS+ in bins 1–3 of Test 2 and bins 1–2 of Test 3 than in Test 0. C. 6.4% IG Intralipid group. The mice licked more (P < 0.05) for CS+ in bins 1–6 of Tests 2 and 3 than in Test 0. D. 12.8% Intralipid group. The mice licked more (P < 0.05) for CS+ in bin 1 of Test 2 and bins 1 and 6 of Test 3 than in Test 0.
3. Experiment 2
The first experiment revealed that self-infusions of 1.6% Intralipid were effective at increasing CS+ licking, but significant increases did not occur until CS+ Test 2 and they were relatively small. This dilute concentration also did not generate a preference for the CS+ relative to the CS−. This pattern resembles that of the isocaloric 4% glucose infusions in our prior concentration-response study [39]. In contrast, self-infusions of isocaloric 3.2% Intralipid and 8% glucose, both stimulated CS+ licking in Tests 1–3 and conditioned significant CS+ preferences. Experiment 2A asked whether the minimally effective 1.6% IL and 4% glucose would produce additive appetition effects when infused together in 1 h/day sessions. This provides a way of testing whether the two nutrients generate common reward signals. If they do, the 1.6% IL + 4% glucose infusions should stimulate CS+ licking in Tests 1–3 and produce a CS+ preference similar to those observed with 3.2% Intralipid and 8% glucose infusions. Experiment 2B extended this analysis to 23 h/day sessions.
3.1 Experiment 2A
In the first part of Experiment 2, we conducted 1-h tests in the same manner as in Experiment 1 using naïve B6 mice. Separate groups of mice were infused with 1.6% Intralipid (IL, n = 9), 4% glucose (G, n = 9), or 1.6% Intralipid + 4% glucose (IL+G, n = 11).
3.2 Results
Analysis of the 1-h lick data (Figure 3A) revealed that the groups did not differ in their CS− licks paired with IG water self-infusions (Test 0) or in their CS+ licks paired with IG nutrient self-infusions [Tests 1–3; Group x Test interaction ns]. Overall, the mice licked more in Tests 2 and 3 than in Tests 0 and 1 [F(3,78) = 34.62, P < 0.0001]. Within group analyses revealed that the IL group licked more in CS+ Tests 2–3 than Tests 0 and 1; the G group licked more in CS+ Tests 2–3 than Test 0, and the IL+G group licked more in CS+ Tests 2–3 than Tests 0 and 1 and more in Test 1 than Test 0. The 1-h total intake data (CS solution + IG infusion g/h) revealed a similar pattern of results; the mice consumed more in CS+ Tests 1–3 (3.0–3.2 g) than in Test 0 (2.7 g) [F(3,78) = 11.54, P < 0.0001]. When intakes in CS+ Tests 1–3 were expressed as energy infused, the IL+G group consumed twice as much as the G and IL groups (0.55 vs. 0.25 and 0.27 kcal/h) [F(2,26) = 87.8, P < 0.0001]. In the alternating sessions, the mice licked more for CS+ than for CS− (1293.7 vs. 1179.1 licks/h) [F(1,26) = 7.01, P < 0.05], and the groups did not differ.
Figure 3.

Experiment 2A. A. Mean (+sem) 1-h total licks are plotted for one-bottle Tests 0–3. The mice drank (1 h/day) a CS− flavored saccharin solution paired with IG water self-infusions in Test 0 before being switched to a CS+ flavored saccharin solution paired with IG nutrient self-infusions in Tests 1–3. The three IG groups were infused with 4% glucose, 1.6% Intralipid, and 1.6% Intralipid + 4% glucose. B. Mean (+sem) 1-h total licks are plotted for CS+ and CS− flavored saccharin solutions during the two-bottle preference test for the 4% glucose, 1.6% Intralipid, and 1.6% Intralipid + 4% glucose IG groups. CS+ and CS− intakes were not paired with IG infusions during the test. Number atop bar represents mean percent preference for the CS+ solution. Significant differences (P < 0.05) between Test 0 vs. Tests 1–3 licks and between CS+ and CS− licks are indicated by an asterisk.
Analysis of the two-bottle test data revealed greater licking for CS+ than for CS−[F(1,26) = 19.85, P < 0.001] and a marginal Group x CS interaction [F(2,26) = 2.80, P = 0.08] (Figure 3B). Individual tests indicated that the IL+G and IL groups, but not the G group, licked more for CS+ than CS− in the tests. The intake data showed a similar pattern of results. The groups also differed in their percent CS+ licks; the 61% in the IL+G group exceeded the 52% of the G group, with the 56% IL group intermediate [F(2,26) = 3.64, P < 0.05].
The one-bottle lick data for CS− Test 0 and CS+ Tests 1–3 were analyzed further to identify when licking was elevated within the CS+ sessions (Figure 4). Compared to Test 0, the G group licked more (p < 0.01) in bin 1 of Test 2 and bins 1–2 of Test 3 (Test x Bin interaction, F(15,120) = 7.02, P < 0.0001). Compared to Test 0, the IL group licked more (p < 0.01) in bins 1 and 2 of Tests 2 and 3 (Test x Bin interaction, F(15,120) = 4.84, P < 0.0001). Compared to Test 0, the IL+G group licked more (p < 0.001) in bins 2 and 3 of Test 1, and in bins 1 and 2 of Tests 2 and 3 (Test x Bin interaction, F(15,150) = 14.5, P < 0.0001).
Figure 4.
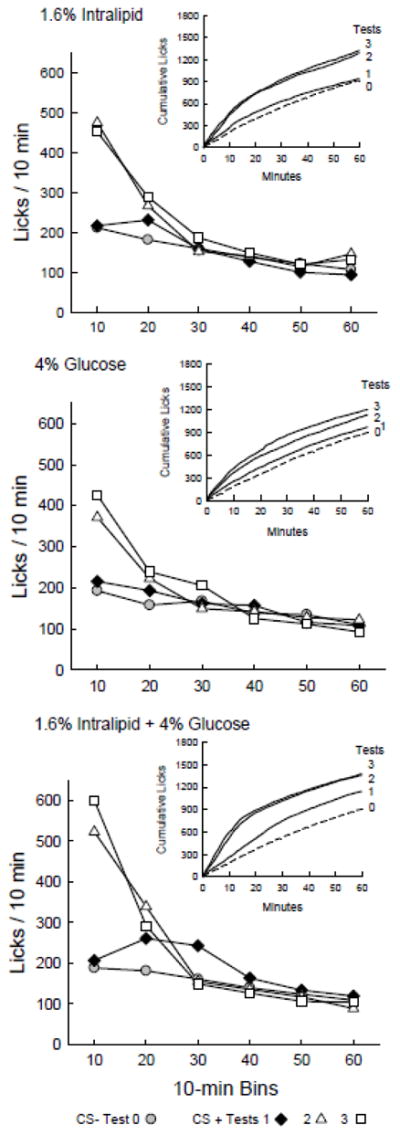
Experiment 2A. Licks per 10-min bin are plotted for Test 0 with CS− flavored saccharin solution paired with IG water self-infusions, and for Tests 1 – 3 with CS+ flavored saccharin solution paired with IG nutrient self-infusions. Graph insets plot cumulative lick curves for Tests 0–3. A. 4% IG Glucose group. The mice licked more (P < 0.05) for CS+ in bin 1 of Test 2 and bins 1–2 of Test 3 than in CS− Test 0. B. 1.6% IG Intralipid group. The mice licked more (P < 0.05) for CS+ in bins 1 and 2 of Tests 2 and 3 than in Test 0. C. 1.6% Intralipid + 4% Glucose group. The mice licked more (P < 0.05) for CS+ in bins 2 and 3 of Test 1, bins 1–2 of Test 2 and bins 1–3 of Test 3 than in Test 0.
The 10-min bin data for Tests 0–3 of the IL+G group were compared with that of the 3.2% IL group from Experiment 1. The only significant effect involving groups was an interaction with Test (F(3,57) = 4.44, P < 0.01). This reflected a difference in Test 0 only, in which the 3.2% IL group licked more CS− in the first bin than the IL+G group. Thus the overall pattern of licking in the CS+ tests did not differ between groups trained with 1.6%IL + 4%G and isocaloric 3.2% IL.
3.3 Experiment 2B
The 1-h session data suggested that adding 4% glucose to 1.6% Intralipid had minimal effects on appetition. The present experiment determined if extending the session length to 23 h/day would enhance the additive effects of the mixed nutrient infusion. This has proven effective in prior studies with relatively weak nutrient infusions [1,39].
The mice from Experiment 2A were retrained with new CS flavors in 23-h sessions, with each group receiving the same infusion as in Experiment 2A: 1.6% Intralipid (IL, n = 9), 4% glucose (G, n = 8), or 1.6% Intralipid + 4% glucose (IL+G, n = 11). The mice were given ad libitum access to chow in their home cages for 2 days, and then were housed in the infusion cages with ad libitum chow. For 3 days they were infused with water when they drank water. Then they were given two cycles of training and testing. In the first, they were given 6 alternating one-bottle days with CS− paired with water infusion on days 1, 3 and 5, and CS+ paired with 1.6% Intralipid, 4% glucose, or 1.6% Intralipid + 4% glucose on days 2, 4 and 6. After a day with water paired with water infusion, they were given a 2-day two bottle test with CS+ and CS−, still paired with their respective infusions. The second cycle followed immediately and was similar except that training was only 4 days of alternating CS− and CS+. The CS solutions contained 0.025% saccharin and 0.05% cherry or grape Kool-Aid (unsweetened mix; Kraft Foods, White Plains, NY); the flavors were counterbalanced so that cherry was the CS+ for half the mice and was grape for the remaining mice.
To simplify presentation, statistical analysis is presented for the training data averaged over the two training cycles (5 days with each CS) and the cycle 2 two-bottle test which yielded the strongest preferences.
3.4 Results
As shown in Figure 5, during one-bottle training the IL+G group consumed more (oral + IG) on CS+ days than CS− days whereas the CS intakes of the IL and G groups did not differ (Group x CS interaction [F(2,25) = 3.90, P < 0.05]. In addition, the groups differed in their CS+ intakes (p < 0.05) but not their CS− intakes. When expressed as energy consumed, the intake of the IL+G group exceeded that of the G and IL groups on CS+ training days (3.6 vs. 1.6 vs. 1.3 kcal/d). In the final two-bottle test (Fig. 5), The IL+G group consumed significantly more (p < 0.001) CS+ than CS−, whereas this difference was marginal (p = 0.054) for the G group and not significant for the IL group [Group x CS interaction, F(2,25) = 4.72, p < 0.05]. The percent CS+ intake of the IL+G group exceeded that of the IL group (p < 0.05), and the G group was intermediate [F(2,25) = 4.44, p < 0.05].
Figure 5.
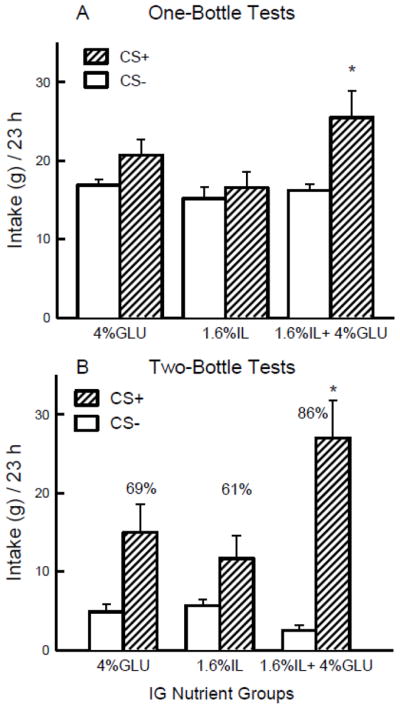
Experiment 2B. A. Mean (+sem) 23-h total intakes (oral + infused) are plotted for one-bottle CS− and CS+ training. The mice drank (23 h/day) a CS− flavored saccharin solution paired with IG water self-infusions on odd-numbered days and a CS+ flavored saccharin solution paired with IG nutrient self-infusions on even-numbered days, for a total of 5 CS− and 5 CS+ days in two training cycles. The three IG groups were infused with 4% glucose, 1.6% Intralipid, and 1.6% Intralipid + 4% glucose. B. Mean (+sem) 23-h total intakes are plotted for CS+ and CS− flavored saccharin solutions during the second two-bottle preference test for the 4% glucose, 1.6% Intralipid, and 1.6% Intralipid + 4% glucose IG groups. CS+ and CS− intakes remained paired with IG self-infusions during the test. Number atop bar represents mean percent preference for the CS+ solution. Significant differences (P < 0.05) between CS+ and CS− licks are indicated by an asterisk.
4. General Discussion
The first experiment revealed that the concentration of fat infused IG strongly affected post-oral appetition as measured by the stimulation of CS+ licking and CS+ preference. The second experiment indicated that combining minimally effective isocaloric concentrations of 1.6% Intralipid and 4% glucose together in the infusion enhanced stimulation of 1-h CS+ licking, relative to each nutrient alone, but did not significantly increase CS+ preference. However, when tests were extended to 23 h/day, the combined nutrient infusion stimulated CS+ intake and preference more than the individual nutrient infusions. These results expand the picture of the parallels and differences between the post-oral rewarding effects of fat and glucose, which can promote intake of and preference for high-energy foods.
4.1 Concentration-response effects
In Experiment 1, the enhancement of licking for the fat-paired CS+ occurred with Intralipid concentrations from 1.6% to 12.8%, but appeared more rapidly (beginning in Test 1) in the 3.2% –12.8% groups than the 1.6% group (beginning in Test 2), and generated more 1-h licks in the 3.2% and 6.4% groups than in the 1.6% and 12.8% groups. Within sessions, the 3.2% and 6.4% IL self-infusions stimulated early lick rates and produced the most persistent increase in lick rates. The 12.8% IL infusions stimulated licking only during the initial 10-min period and lick rates then rapidly declined to CS− levels. This can be attributed to the post-oral satiation action of the 12.8% IL. The fat energy self-infused during the 1-h sessions, however, was a direct function of concentration (0.23–1.84 kcal/h). The strength of preference for the CS+ flavor increased with concentration from 1.6% to 6.4%, with no further increase in preference for the 12.8% fat-paired flavor.
The 1-h lick results obtained with the 6.4% IL group replicate those of our original study [38]. However, the original 6.4% IL group displayed only a 70% CS+ preference, whereas the present 6.4% IL group displayed an 85% preference. This can be attributed to the procedural differences of the present study designed to enhance flavor discrimination. That is, the mice were tested with more concentrated CS flavors (0.02% rather than 0.01%) and were given alternating CS+ and CS− sessions prior to the two-bottle tests. In another recent study we obtained 81–84% CS+ preferences in 6.4% IL groups trained as in Experiment 1 [33].
Comparison of the 1.6–12.8% Intralipid groups with the isocaloric 4–32% glucose groups in our 2013 study [39] showed more similarities than differences between sugar and fat infusions. Like the 4% glucose group, mice trained with 1.6% IL did not respond in CS+ Test 1 but showed increased licking in CS+ Tests 2–3 (and this pattern was also found in the 1.6% IL group of Experiment 2). Neither the 1.6% IL or 4% glucose infusions produced strong or significant CS+ preferences. The 3.2% and 6.4% IL groups, like the corresponding 8% and 16% glucose groups, showed Test 1 stimulation and CS+ preferences that increased with concentration. The 12.8% IL group showed increases in 1-h licks in CS+ Tests 1–3, unlike the 32% glucose group, which failed to increase their 1-h CS+ licks. On the other hand, the CS+ preference of the 12.8% IL group was somewhat less than that of the 32% glucose group (83 vs. 91%).
A particularly striking similarity between the IL and glucose data is that the 1.6 – 12.8% IL and 4 – 32% glucose infusions produced nearly identical concentration-dependent increases in 1-h energy intakes (from ~0.2 to ~1.8 kcal/day; Figure 6). In marked contrast to these findings, Ferreira et al. [11] recently reported that B6 mice self-infused nearly constant amounts of IG calories (~ 2.5 kcal/hr) when tested with different Intralipid or glucose concentrations. Their mice, however, infused much more concentrated solutions (5–30% IL or 12.5–75% glucose) as they licked a dry sipper tube. Our mice licked a sipper tube containing a CS+ solution which diluted the infused nutrients to net concentrations of 0.8 – 6.4% IL and 2 – 16% glucose. Given these major procedural differences, the findings of the two studies are not directly comparable.
Figure 6.
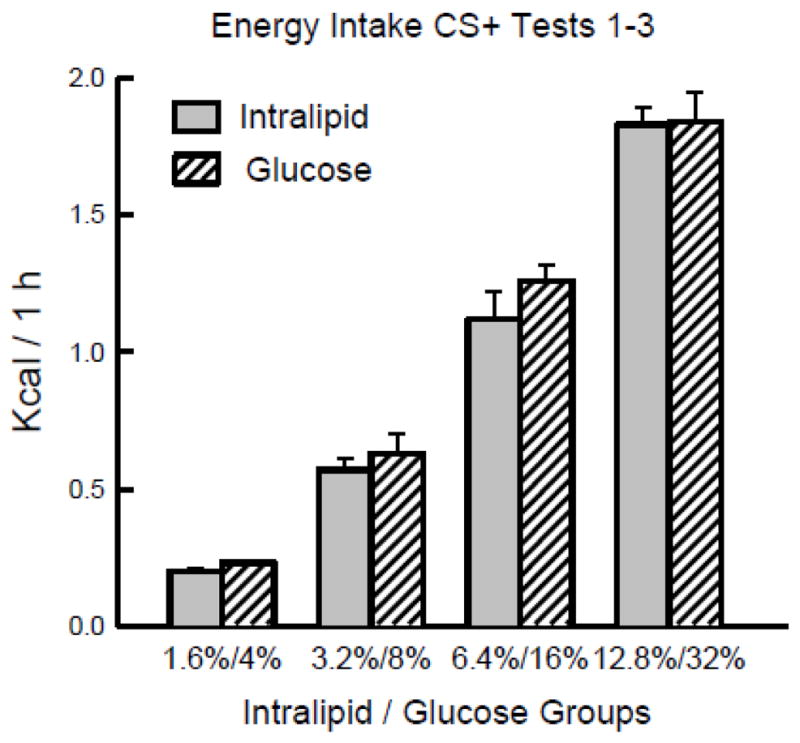
Mean (+sem) 1-h total kcal from infusions on CS+ days 1–3 are plotted for the 1.6%, 3.2%, 6.4% and 12.8% Intralipid groups of Experiment 1, and for the isocaloric 4%, 8%, 16% and 32% glucose groups of a previous experiment [39].
4.2 Direct comparison of low concentrations of glucose and fat
The similarity in the appetition effects we observed with isocaloric IL and glucose infusions could be interpreted as indicating that the important aspect of the infusions is the amount of energy delivered. However, if that were so, and the source of the energy were not relevant, then in Experiment 2 the mixed 1.6% IL + 4% glucose infusion should have been more effective than the 1.6% IL or 4% glucose infusions and should have mimicked the effects of 3.2% and 8% glucose. Instead, we found that adding 4% glucose to 1.6% Intralipid produced only a slightly greater stimulation of CS+ licking than 1.6% IL alone. The IL+G group did show increased CS+ licking in Test 1, whereas this did not appear until Test 2 for the IL and G groups. In contrast the 3.2% IL and 8% glucose groups [39] showed greater increases in CS+ licking in Test 1 than did the IL+G group. Preference for the CS+ was no stronger for the IL+G group (61%) than for the 1.6%IL group alone (56%) and less than that observed in the isocaloric 3.2% IL (67%, Experiment 1) or 8% glucose group (70%, [39]).
In Experiment 2, the 1.6% IL group drank somewhat more than the identically treated 1.6% group of Experiment 1, and their 56% preference was significant but the 1.6% group’s 55% preference was not. Both the low preference and the minimal stimulation of CS+ licking observed in the two 1.6% IL groups indicates that this concentration is at or just below the threshold for post-oral fat appetition. This is further indicated by the failure of the 1.6% IL infusions to stimulate CS+ intake or condition a significant preference in the 23 h/day sessions of Experiment 2B.
In contrast to 1.6% IL, the flavor conditioning produced by the 4% glucose infusions was increased from 52% to 69% by extending the IG self-infusion sessions from 1 h to 23 h/day. This outcome replicates the previous finding [39] that extending IG sessions from 1 h/day to 20 h/day sessions enhanced CS+ flavor conditioning of 4% glucose from 52% to 68%. These mice were maintained with restricted access to food, unlike the present 4% glucose group, which indicates that prolonged sessions can enhance response to a marginal infusion concentration without relying on energy deficit. Rather, the effectiveness of long sessions is probably due to the repeated association of the CS+ flavor with nutrient infusion throughout the day, creating multiple training “trials”.
The conditioning effectiveness of the IL+G infusion was the most improved by increasing the training sessions to 23 h/day; the mice in this group increased their CS+ preference from 61% with 1-h sessions to 86% with 23 h sessions. Thus, the predicted additive (or near-additive) effect of combining low concentrations of IL and glucose was obtained with 23-h sessions but not with 1-h sessions. Perhaps the fat in the IL+Glucose mixture delayed the gastric emptying of the sugar so that the appetition actions of the glucose were reduced during the 1-h training sessions (see [24]). On the other hand, the gastric emptying of the fat in the IL+G infusate may not be much different from that of IL alone. This is because the Intralipid should lose its emulsification in the acid environment of the stomach and separate into lipid and aqueous phases, with the latter emptying more quickly (see [12]). Detailed studies of fat and sugar gastric emptying in mice infused with Intralipid and glucose alone and in mixtures are needed to resolve this issue.
4.3 Mechanisms of post-oral fat detection and reward signaling
As mentioned in section 4.2, the similar appetition responses displayed by B6 mice to isocaloric IG infusions of Intralipid and glucose would appear to suggest flavor conditioning is mediated by the energy value of the nutrients, as claimed in early studies [20]. However, this interpretation is not supported by the marked differences obtained with other isocaloric nutrient infusions [4,31]. In particular, using the training procedures of the present study, we observed that IG infusions of 8 or 12% fructose failed to stimulate CS+ licking or a CS+ preference compared to the strong appetition effects of isocaloric glucose infusions [40]. The same study revealed that IG infusions of a non-metabolizable glucose analog, alpha-methyl-D-glucopyranoside, were nearly as effective as glucose in stimulating CS+ intake and preferences. These and other findings suggested that glucose appetition is mediated, at least in part, by the intestinal glucose sensor and transporter SGLT1 and perhaps SGLT3 [40].
With respect to post-oral fat appetition, recent findings implicate the involvement of the fatty acid sensors GPR40 and GPR120 found in intestinal enteroendocrine cells [33]. Knockout (KO) mice that lacked one or both of these G-protein coupled receptors displayed reduced CS+ licking and preference responses to IG infusions of 6.4% IL. The loss of sensory capability in the KO mice may be the functional equivalent of diluting the fat infusions in the present findings. The self-infusions of 1.6%, 3.2% and 6.4% Intralipid conditioned CS+ preferences of 55%, 67% and 85% in B6 mice, which are similar to the CS+ preferences of 58%, 72% and 81–84% displayed by GPR40+GPR120 KO, GPR40 KO and B6 mice trained with 6.4% Intralipid [33].
The appetition signal generated by these fatty acid sensors is not known. It does not appear to involve a gut-brain neural pathway since vagal deaff erentation did not prevent post-oral fat conditioning in rats [17,28]. Instead, a humoral or hormonal signal is implicated although there are no clear candidates for this role thus far. The hormones stimulated by activation of the GPR40 and GPR120 sensors (CCK, GIP, GLP-1) [6] are not involved in stimulation of food intake; rather, CCK and GLP-1 both reduce intake [21]. Likewise, the fat digestion product oleoylethanolamide stimulates peroxisome proliferator-activated receptor alpha, but signals satiety rather than enhancing intake [27]. Appetite stimulation by ghrelin is also unlikely to be involved, as GPR120 fat detection suppresses rather than promotes ghrelin release [15]. Central ghrelin receptors, however, are implicated in fat reinforcement given that fat-conditioned place preference is inhibited in ghrelin receptor KO mice or wildtype mice treated with a receptor antagonist [25]. A role for endocannabinoids in the stimulation of dietary fat intake has been proposed based on orosensory fat stimulation in sham-feeding rats [9,10]. A proposed mechanism is localized suppression of CCK by jejunal cells with endocannabinoid receptors as well as GPR40 and GPR120 and other receptors [34]. The relationship of these findings to the present data, in which post-oral fat stimulation enhances intake and preference, remains unclear.
As previously proposed for glucose-induced appetition [39], fat appetition may be mediated by a novel intestinal hormone. In theory, just as glucose and fatty acids release common satiation hormones (e.g., GLP-1) via their actions on SGLT1/SGLT3 and GPR40/GPR120, respectively, they may also release a common appetition hormone that stimulates ingestion at the start of a meal. If this is the case, then infusions containing both fat and glucose would be expected to have additive appetition effects. This was observed in 23-h test sessions but not 1-h sessions, for reasons that remain to be determined. While the gut-brain fat signaling pathway remains to be identified, recent studies by de Araujo and coworkers [11,35] demonstrate that IG fat infusions activate the brain dopamine (DA) reward systems. Furthermore, pharmacological inhibition of DA D2 receptors disrupted IG fat self-infusions in B6 mice [11]. Using a conditioning protocol that provides oral and post-oral fat exposure, Bodnar and coworkers [8,14] reported that inhibition of DA D1 receptors blocked fat-conditioned flavor preferences in SWR mice although not in BALB/c mice or Sprague-Dawley rats; B6 mice were not included in these studies.
In summary, the present findings demonstrate that IG self-infusions of fat produce concentration-dependent increases in the intake of and preference for a flavored CS+ solution in B6 mice. The effects were quite comparable to those produced by IG self-infusions of isocaloric glucose infusions in mice [39]. This contrasts with the findings that glucose is more effective than fat in conditioning flavor preferences in rats [5]. Species (or strain) differences may be an important factor, although different training protocols were used in the rat and mouse studies. The appetition protocol used here and elsewhere [23,33,38–40] is a tool to probe the time course of initial post-oral detection, providing further insights about the nature of the cues that support flavor-nutrient learning. It can also be used to reveal the feeding stimulatory actions of candidate appetition hormones.
Highlights.
Post-oral actions of fat stimulate appetite in mice
Intragastric self-infusions of 3.2–12.8% Intralipid increased flavor solution intake
Flavor preferences, like intake stimulation, were concentration dependent
1.6% Intralipid infusions were minimally effective
These appetition effects were similar to those of isocaloric glucose self-infusions
Acknowledgments
This research was supported by grant DK-31135 from the National Institute of Diabetes and Digestive and Kidney Diseases. The authors thank Kwame McCartney and Martin Zartarian for their expert technical assistance.
Footnotes
Publisher's Disclaimer: This is a PDF file of an unedited manuscript that has been accepted for publication. As a service to our customers we are providing this early version of the manuscript. The manuscript will undergo copyediting, typesetting, and review of the resulting proof before it is published in its final citable form. Please note that during the production process errors may be discovered which could affect the content, and all legal disclaimers that apply to the journal pertain.
References
- 1.Ackroff K, Sclafani A. Flavor preferences conditioned by intragastric infusions of dilute Polycose solutions. Physiol Behav. 1994;55:957–62. doi: 10.1016/0031-9384(94)90086-8. [DOI] [PubMed] [Google Scholar]
- 2.Ackroff K, Rozental D, Sclafani A. Ethanol-conditioned flavor preferences compared with sugar- and fat-conditioned preferences in rats. Physiol Behav. 2004;81:699–713. doi: 10.1016/j.physbeh.2004.03.011. [DOI] [PubMed] [Google Scholar]
- 3.Ackroff K, Lucas F, Sclafani A. Flavor preference conditioning as a function of fat source. Physiol Behav. 2005;85:448–60. doi: 10.1016/j.physbeh.2005.05.006. [DOI] [PubMed] [Google Scholar]
- 4.Ackroff K. Learned flavor preferences: the variable potency of post-oral nutrient reinforcers. Appetite. 2008;51:743–6. doi: 10.1016/j.appet.2008.05.059. [DOI] [PMC free article] [PubMed] [Google Scholar]
- 5.Ackroff K, Dym C, Yiin Y-M, Sclafani A. Rapid acquisition of conditioned flavor preferences in rats. Physiol Behav. 2009;97:406–13. doi: 10.1016/j.physbeh.2009.03.014. [DOI] [PMC free article] [PubMed] [Google Scholar]
- 6.Breer H, Eberle J, Frick C, Haid D, Widmayer P. Gastrointestinal chemosensation: chemosensory cells in the alimentary tract. Histochem Cell Biol. 2012;138:13–24. doi: 10.1007/s00418-012-0954-z. [DOI] [PubMed] [Google Scholar]
- 7.Buettner R, Scholmerich J, Bollheimer LC. High-fat diets: modeling the metabolic disorders of human obesity in rodents. Obesity. 2007;15:798–808. doi: 10.1038/oby.2007.608. [DOI] [PubMed] [Google Scholar]
- 8.Dela Cruz JA, Icaza-Cukali D, Tayabali H, Sampson C, Galanopoulos V, Bamshad D, et al. Roles of dopamine D1 and D2 receptors in the acquisition and expression of fat-conditioned flavor preferences in rats. Neurobiol Learn Mem. 2012;97:332–7. doi: 10.1016/j.nlm.2012.01.008. [DOI] [PMC free article] [PubMed] [Google Scholar]
- 9.DiPatrizio NV, Astarita G, Schwartz G, Li X, Piomelli D. Endocannabinoid signal in the gut controls dietary fat intake. Proc Natl Acad Sci U S A. 2011;108:12904–8. doi: 10.1073/pnas.1104675108. [DOI] [PMC free article] [PubMed] [Google Scholar]
- 10.DiPatrizio NV, Joslin A, Jung KM, Piomelli D. Endocannabinoid signaling in the gut mediates preference for dietary unsaturated fats. FASEB J. 2013;108:12904–8. doi: 10.1096/fj.13-227587. [DOI] [PMC free article] [PubMed] [Google Scholar]
- 11.Ferreira JG, Tellez LA, Ren Z, Yeckel CW, de Araujo IE. Regulation of fat intake in the absence of flavor signaling. J Physiol. 2012;590:953–72. doi: 10.1113/jphysiol.2011.218289. [DOI] [PMC free article] [PubMed] [Google Scholar]
- 12.Friedman MI, Ramirez I, Tordoff MG. Gastric emptying of ingested fat emulsion in rats: implications for studies of fat-induced satiety. Am J Physiol. 1996;270:R688–92. doi: 10.1152/ajpregu.1996.270.3.R688. [DOI] [PubMed] [Google Scholar]
- 13.Hariri N, Thibault L. High-fat diet-induced obesity in animal models. Nutr Res Rev. 2010;23:270–99. doi: 10.1017/S0954422410000168. [DOI] [PubMed] [Google Scholar]
- 14.Kraft TT, Yakubov Y, Huang D, Fitzgerald G, Acosta V, Natanova E, et al. Dopamine D1 and opioid receptor antagonism effects on the acquisition and expression of fat-conditioned flavor preferences in BALB/c and SWR mice. Pharmacol Biochem Behav. 2013;110C:127–36. doi: 10.1016/j.pbb.2013.06.009. [DOI] [PubMed] [Google Scholar]
- 15.Lu X, Zhao X, Feng J, Liou AP, Anthony S, Pechhold S, et al. Postprandial inhibition of gastric ghrelin secretion by long-chain fatty acid through GPR120 in isolated gastric ghrelin cells and mice. Am J Physiol Gastrointest Liver Physiol. 2012;303:G367–76. doi: 10.1152/ajpgi.00541.2011. [DOI] [PMC free article] [PubMed] [Google Scholar]
- 16.Lucas F, Sclafani A. Flavor preferences conditioned by intragastric fat infusions in rats. Physiol Behav. 1989;46:403–12. doi: 10.1016/0031-9384(89)90011-5. [DOI] [PubMed] [Google Scholar]
- 17.Lucas F, Sclafani A. Capsaicin attenuates feeding suppression but not reinforcement by intestinal nutrients. Am J Physiol. 1996;270:R1059–R64. doi: 10.1152/ajpregu.1996.270.5.R1059. [DOI] [PubMed] [Google Scholar]
- 18.Lucas F, Sclafani A. The composition of the maintenance diet alters flavor-preference conditioning by intragastric fat infusions in rats. Physiol Behav. 1996;60:1151–7. doi: 10.1016/0031-9384(96)00136-9. [DOI] [PubMed] [Google Scholar]
- 19.Lucas F, Sclafani A. Differential reinforcing and satiating effects of intragastric fat and carbohydrate infusions in rats. Physiol Behav. 1999;66:381–8. doi: 10.1016/s0031-9384(98)00275-3. [DOI] [PubMed] [Google Scholar]
- 20.Mehiel R, Bolles RC. Learned flavor preferences based on caloric outcome. Anim Learn Behav. 1984;12:421–7. [Google Scholar]
- 21.Moran TH, Dailey MJ. Intestinal feedback signaling and satiety. Physiol Behav. 2011;105:77–81. doi: 10.1016/j.physbeh.2011.02.005. [DOI] [PMC free article] [PubMed] [Google Scholar]
- 22.Myers KP. Rats acquire stronger preference for flavors consumed towards the end of a high-fat meal. Physiol Behav. 2013;110–111:179–89. doi: 10.1016/j.physbeh.2013.01.004. [DOI] [PubMed] [Google Scholar]
- 23.Myers KP, Taddeo MS, Richards EK. Sensory-specific appetition: postingestive detection of glucose rapidly promotes continued consumption of a recently encountered flavor. Physiol Behav. 2013;121:125–33. doi: 10.1016/j.physbeh.2013.03.021. [DOI] [PubMed] [Google Scholar]
- 24.Parylak SL, Cottone P, Sabino V, Rice KC, Zorrilla EP. Effects of CB1 and CRF1 receptor antagonists on binge-like eating in rats with limited access to a sweet fat diet: lack of withdrawal-like responses. Physiol Behav. 2012;107:231–42. doi: 10.1016/j.physbeh.2012.06.017. [DOI] [PMC free article] [PubMed] [Google Scholar]
- 25.Perello M, Sakata I, Birnbaum S, Chuang JC, Osborne-Lawrence S, Rovinsky SA, et al. Ghrelin increases the rewarding value of high-fat diet in an orexin-dependent manner. Biol Psychiatry. 2010;67:880–6. doi: 10.1016/j.biopsych.2009.10.030. [DOI] [PMC free article] [PubMed] [Google Scholar]
- 26.Pérez C, Fanizza L, Sclafani A. Flavor preferences conditioned by intragastric nutrient infusions in rats fed chow or a cafeteria diet. Appetite. 1999;32:155–70. doi: 10.1006/appe.1998.0182. [DOI] [PubMed] [Google Scholar]
- 27.Piomelli D. A fatty gut feeling. Trends Endocrinol Metab. 2013;24:332–41. doi: 10.1016/j.tem.2013.03.001. [DOI] [PMC free article] [PubMed] [Google Scholar]
- 28.Sclafani A, Ackroff K, Schwartz GJ. Selective effects of vagal deafferentation and celiac-superior mesenteric ganglionectomy on the reinforcing and satiating action of intestinal nutrients. Physiol Behav. 2003;78:285–94. doi: 10.1016/s0031-9384(02)00968-x. [DOI] [PubMed] [Google Scholar]
- 29.Sclafani A, Glendinning JI. Sugar and fat conditioned flavor preferences in C57BL/6J and 129 mice: oral and postoral interactions. Am J Physiol. 2005;289:R712–20. doi: 10.1152/ajpregu.00176.2005. [DOI] [PubMed] [Google Scholar]
- 30.Sclafani A, Glass D, Margolskee RF, Glendinning JI. Gut T1R3 sweet taste receptors do not mediate sucrose-conditioned flavor preferences in mice. Am J Physiol. 2010;299:R1643–R50. doi: 10.1152/ajpregu.00495.2010. [DOI] [PMC free article] [PubMed] [Google Scholar]
- 31.Sclafani A, Ackroff K. The role of gut nutrient sensing in stimulating appetite and conditioning food preferences. Am J Physiol Regul Integr Comp Physiol. 2012;302:R1119–33. doi: 10.1152/ajpregu.00038.2012. [DOI] [PMC free article] [PubMed] [Google Scholar]
- 32.Sclafani A. Gut-brain nutrient signaling: appetition vs. satiation. Appetite. 2013;71:454–8. doi: 10.1016/j.appet.2012.05.024. [DOI] [PMC free article] [PubMed] [Google Scholar]
- 33.Sclafani A, Zukerman S, Ackroff K. GPR40 and GPR120 fatty acid sensors are critical for post-oral but not oral mediation of fat preferences in the mouse. Am J Physiol Reg Integ Physiol. 2013;305:R1490–7. doi: 10.1152/ajpregu.00440.2013. [DOI] [PMC free article] [PubMed] [Google Scholar]
- 34.Sykaras AG, Demenis C, Case RM, McLaughlin JT, Smith CP. Duodenal enteroendocrine I-cells contain mRNA transcripts encoding key endocannabinoid and fatty acid receptors. PLoS One. 2012;7:e42373. doi: 10.1371/journal.pone.0042373. [DOI] [PMC free article] [PubMed] [Google Scholar]
- 35.Tellez LA, Medina S, Han W, Ferreira JG, Licona-Limon P, Ren X, et al. A gut lipid messenger links excess dietary fat to dopamine deficiency. Science. 2013;341:800–2. doi: 10.1126/science.1239275. [DOI] [PubMed] [Google Scholar]
- 36.Tracy AL, Phillips RJ, Chi MM, Powley TL, Davidson TL. The gastrointestinal tract “tastes” nutrients: evidence from the intestinal taste aversion paradigm. Am J Physiol. 2004;287:R1086–R100. doi: 10.1152/ajpregu.00047.2004. [DOI] [PubMed] [Google Scholar]
- 37.Yiin Y-M, Ackroff K, Sclafani A. Flavor preferences conditioned by intragastric nutrient infusions in food restricted and free-feeding rats. Physiol Behav. 2005;84:217–31. doi: 10.1016/j.physbeh.2004.11.008. [DOI] [PubMed] [Google Scholar]
- 38.Zukerman S, Ackroff K, Sclafani A. Rapid post-oral stimulation of intake and flavor conditioning by glucose and fat in the mouse. Am J Physiol. 2011;301:R1635–R47. doi: 10.1152/ajpregu.00425.2011. [DOI] [PMC free article] [PubMed] [Google Scholar]
- 39.Zukerman S, Ackroff K, Sclafani A. Post-oral glucose stimulation of intake and conditioned flavor preference in C57BL/6J mice: A concentration-response study. Physiol Behav. 2013;109:33–41. doi: 10.1016/j.physbeh.2012.11.004. [DOI] [PMC free article] [PubMed] [Google Scholar]
- 40.Zukerman S, Ackroff K, Sclafani A. Post-oral appetite stimulation by sugars and non-metabolizable sugar analogs in mice: role of intestinal SGLT sugar sensors. Am J Physiol. 2013;305:R840–53. doi: 10.1152/ajpregu.00297.2013. [DOI] [PMC free article] [PubMed] [Google Scholar]