

Abstract
Exonucleolytic editing of incorrectly incorporated nucleotides by replicative DNA polymerases (DNAPs) plays an essential role in the fidelity of DNA replication. Editing requires that the primer strand of the DNA substrate be transferred between the DNAP polymerase and exonuclease sites, separated by a distance that is typically on the order of ∼30 Å. Dynamic transitions between functional states can be quantified with single-nucleotide spatial precision and submillisecond temporal resolution from ionic current time traces recorded when individual DNAP complexes are held atop a nanoscale pore in an electric field. In this study, we have exploited this capability to determine the kinetic relationship between the translocation step and primer strand transfer between the polymerase and exonuclease sites in complexes formed between the replicative DNAP from bacteriophage Φ29 and DNA. We demonstrate that the pathway for primer strand transfer from the polymerase to exonuclease site initiates prior to the translocation step, while complexes are in the pre-translocation state. We developed a mathematical method to determine simultaneously the forward and reverse translocation rates and the rates of primer strand transfer in both directions between the polymerase and the exonuclease sites, and we have applied it to determine these rates for Φ29 DNAP complexes formed with a DNA substrate bearing a fully complementary primer–template duplex. This work provides a framework that will be extended to determine the kinetic mechanisms by which incorporation of noncomplementary nucleotides promotes primer strand transfer from the polymerase site to the exonuclease site.
Introduction
Fidelity in DNA replication is fundamental to genome integrity and is attributable first and foremost to the remarkable accuracy of replicative DNA polymerases (DNAPs). This accuracy is achieved through two processes: (i) DNAP selection of complementary deoxyribonucleoside triphosphate (dNTP) over noncomplementary dNTPs and over ribonucleoside triphosphates (rNTPs) prior to phosphodiester bond formation (for examples see references (1) and (2)); and (ii) exonucleolytic excision (editing) of noncomplementary deoxyribonucleoside monophosphates (dNMPs) that escape initial dNTP discrimination and are incorporated into the primer strand (reviewed in references (3) and (4)). The exonuclease and polymerase sites of DNAPs are located in separate protein domains (or in some cases, in separate subunits), with the two active sites typically separated by 30–40 Å,5−9 and primer strand transfer from the polymerase to exonuclease site requires that ∼3 base pairs of the primer–template duplex be melted.10 Depending upon the polymerase, the primer transfer process can occur through an intramolecular or intermolecular pathway; kinetic properties of the transfer process have been described for several DNAPs,11−16 and one or more intermediates have been implicated.14,17,18
Optimum balance between speed and accuracy during DNA replication requires that the process of primer strand transfer between the polymerase and exonuclease active sites be tightly coordinated. The incorporation of a mismatched dNMP hinders further primer extension and significantly increases the probability of primer strand transfer from the polymerase to exonuclease active site relative to the probability for DNA substrates with fully complementary primer and template strands.3,4 The precise kinetic mechanism by which this occurs is not fully understood. In particular, very little is known about the relationship between the translocation step and the process of primer strand transfer between the polymerase and exonuclease sites during DNA synthesis. Does primer transfer initiate in the pre-translocation state, in the post-translocation state, or are both pathways possible? In some cases it has been inferred that the impairment to primer extension after a mismatch is incorporated is due to inhibition of the forward translocation (see reference (4)). This inference can be viewed as tacitly assuming that the primer strand transfer initiates from the pre-translocation state, and an impairment in the forward translocation has been implicated as the cause of the decreased polymerase processivity and increased exonucleolytic processivity observed during replication catalyzed by the A737V mutant of the B family DNAP from bacteriophage T4.19 A pathway in which primer strand transfer from the polymerase site to the exonuclease site is initiated from the pre-translocation state is also suggested from crystal structures of complexes formed between the B family DNAP from bacteriophage RB69 and a DNA substrate bearing a furan-dAMP mismatch at the duplex terminus.20 For complexes in two copies of the crystal asymmetric unit, the DNA substrate occupied the polymerase active site, in the pre-translocation state, whereas for complexes in the other two copies of the unit, the primer strand was melted into the exonuclease active site. Nonetheless, there is no direct evidence regarding the translocation state of complexes in the polymerase active site before or after the primer transfer to the exonuclease site, or how the rates across the translocation step relate to the rates of the transfer process.
In order to understand how the polymerase synthetic function and the exonucleolytic editing function are integrated during DNA synthesis and how mismatch incorporation promotes primer strand transfer, it is necessary to provide a kinetic framework that accurately relates the process of primer strand transfer between the polymerase and exonuclease sites to the translocation step. Within such a framework, the transition rates for complexes with DNA substrates bearing fully complementary primer and template strands must be determined, and the steps at which the rates differ for DNA substrates bearing a mismatch must be identified and quantified. Filling this critical gap in knowledge requires the ability to resolve and quantify the translocation step. Primer transfer rates between the polymerase and exonuclease sites measured using experimental methods that do not resolve the translocation states (and the transition rates between them) may comprise composite rates that include both the rates of fluctuation between the post-translocation and pre-translocation states and the rates of transfer between polymerase and exonuclease sites. For example, when the B family replicative DNAP from the bacteriophage Φ29 is bound to a DNA substrate with a fully base-paired duplex, the probability of the post-translocation state of the binary complex is extremely high in the absence of an opposing force.21,22 Binary complex crystal structures of several DNAPs bound to fully paired, undamaged primer–template DNA substrates reveal complexes to be in the post-translocation state (for examples, see references (5) and (23)−26), suggesting that the post-translocation state is thermodynamically favored for many DNAPs, even in the absence of dNTP. If the primer transfer pathway from the polymerase site to the exonuclease site can initiate only from the pre-translocation state, then rates for primer strand transfer determined from such methods will comprise both the rate of the post-translocation to pre-translocation state transition and the rate of the strand tranfer step.
We have developed a high-resolution single-molecule approach to quantify the rates of the translocation and dNTP binding steps in individual DNAP complexes, using the Φ29 DNAP as a model system.21,22,27 Nanoscale pores have been used as sensors to analyze a wide range of chemical and biological systems (see reviews in references (28)−31). DNA synthesis catalyzed by Φ29 DNAP can be monitored with single-nucleotide spatial precision and submillisecond temporal resolution when individual DNAP-DNA complexes are held atop a nanoscale pore.32−34 This enzyme catalyzes highly processive DNA synthesis without accessory proteins.35−37 It remains tightly associated with its DNA substrate and promotes downstream strand displacement during replication5,38 and thus is an excellent model system for leading strand DNA synthesis catalyzed in more complex replisomes. Φ29 DNAP has a 3′–5′ exonuclease active site, located in a separate domain of the protein, ∼30 Å from the polymerase active site.5,8,36,37 Primer strand transfer between the polymerase and exonuclease sites of Φ29 DNAP is an intramolecular process,39 and exonucleolytic editing increases the fidelity of Φ29 DNAP-catalyzed replication by ∼2 orders of magnitude over the 104–106 level of discrimination achieved at the nucleotide selection step.40,41 While the primary function of the exonuclease is to excise incorrectly incorporated nucleotides, like most DNAPs with editing functions that have been studied, Φ29 DNAP has a measurable level of exonucleolytic activity toward DNA substrates with fully complementary duplexes.40,42
In this study, we have determined the kinetic relationship between the translocation step and primer strand transfer between the polymerase and exonuclease sites in individual Φ29 DNAP complexes, and demonstrated that the pathway for primer strand transfer from the polymerase to exonuclease site initiates prior to the translocation step, while complexes are in the pre-translocation state. We developed a mathematical method to determine simultaneously the forward and reverse translocation rates and the rates of primer strand transfer in both directions between the polymerase and exonuclease sites, for individual Φ29 DNAP complexes formed with DNA substrates bearing fully complementary primer–template strands. This work provides a framework that we will extend to determine the kinetic mechanisms by which mismatch incorporation promotes primer strand transfer to the exonuclease site.
Methods
DNA and Enzymes
DNA substrates were synthesized at Stanford Protein and Nucleic Acid Facility and purified by denaturing PAGE. DNA hairpins were annealed by heating at 90 °C for 4 min followed by snap cooling in ice water. Wild type Φ29 DNAP was obtained from Enzymatics (Beverly, MA). The D12A/D66A and N62D mutants were obtained from XPol Biotech (Madrid, Spain). The Y226F/D12A/D66A mutant was a generous gift from Dr. Margarita Salas.
Nanopore Methods
Nanopore experiments were conducted as described.21,27,32,43−45 Briefly, a single α-HL nanopore is inserted in a ∼25 μm-diameter lipid bilayer that separates two chambers (cis and trans) containing buffer solution (10 mM K-Hepes, pH 8.0, 0.3 M KCl, and 1 mM EDTA). MgCl2 and DTT were added to the nanopore cis chamber to final concentrations of 11 and 1 mM, respectively. DNA and Φ29 DNAP were added to the cis chamber to final concentrations of 1 and 0.75 μM, respectively. Ionic current was measured with an integrating patch clamp amplifier (Axopatch 200B, Molecular Devices) in voltage clamp mode. Data were sampled using an analog-to-digital converter (Digidata 1440A, Molecular Devices) at 100 kHz in whole-cell configuration and filtered at 5 kHz using a low pass Bessel filter.
Analysis of Ionic Current Time Traces
Each recorded time trace of ionic current amplitude from a captured Φ29 DNAP complex is analyzed in the following series of steps: (i) The collection of amplitude samples is fitted to a model of 2 Gaussian modes. The fraction of the upper or lower amplitude mode gives the equilibrium probability of the complex residing at the upper or lower amplitude, respectively; an amplitude may comprise a composite state. The centers of the upper and lower amplitude modes give approximately the underlying noiseless levels of the 2 amplitude states. (ii) To extract dwell time samples of each amplitude, we model the measured time trace as a true underlying noiseless time trace plus Gaussian noise. The true underlying noiseless time trace jumps between the 2 noiseless amplitude levels obtained in (i). (iii) To reduce the false transitions caused by measurement noise, we set a threshold tc = 100 μs. A transition from one amplitude to the other is classified as legitimate if the measured amplitude stays around the target amplitude level for a time period > tc. (iv) The dwell time samples of the lower amplitude are fitted to a single exponential mode. The dwell time samples of the upper amplitude state are fitted to a model of 2 exponential modes. The 2 fittings are then corrected iteratively to account for the issue that some true legitimate transitions are eliminated by the threshold tc = 100 μs. (v) The intermediate parameters obtained in the 2 fittings of dwell time samples are used to calculate kinetic transition rates (see Supporting Information (SI)). At each experimental condition, we typically have a set of n = 20–30 time traces, which yields a set of n estimated values for each parameter. The final estimation and the associated standard error for each kinetic rate are calculated on the basis of this set of estimated values.
Results
Fluctuations between the pre-translocation and post-translocation states can be directly observed and quantified from ionic current time traces recorded when individual Φ29 DNAP-DNA complexes are held atop a nanoscale pore in an electric field.21,22,27,46 To perform the experiments, a single α-hemolysin (α-HL) nanopore is inserted into a lipid bilayer that separates two chambers (termed cis and trans) containing buffer solution (Figure 1a). A patch clamp amplifier applies voltage across the bilayer and measures the ionic current that flows through the pore, which is carried by K+ and Cl– ions in the buffer. Figure 1b shows a typical ionic current trace that results when a binary complex between Φ29 DNAP and a DNA substrate (DNA1-H; Figure 1c, i) is captured atop the nanopore at 180 mV applied potential. The ionic current through the open nanopore (Figure 1b, i) drops rapidly when a complex is captured (Figure 1b, ii). The enzyme is too large to enter the nanopore, and therefore the Φ29 DNAP-DNA complex, with the enzyme bound at the primer–template junction of the DNA substrate, perches atop the pore. The DNA template strand of the captured complex is suspended through the nanopore lumen, which is just wide enough to accommodate a single strand of DNA (Figure 1b, ii).
Figure 1.

Capture of Φ29 DNAP complexes on the α-HL nanopore. (a) In the nanopore device, a single α-HL nanopore is inserted in a ∼25 μm-diameter lipid bilayer separating two chambers (cis and trans) containing buffer solution. A patch clamp amplifier applies voltage across the bilayer and measures ionic current, which is carried through the nanopore by K+ and Cl– ions. (b) A representative ionic current time trace for a binary complex formed between wild type Φ29 DNAP and a DNA substrate (DNA1-H, in panel c, i) captured at 180 mV applied potential in buffer containing 10 mM K-Hepes, pH 8.0, 0.3 M KCl, 1 mM EDTA, 1 mM DTT, and 11 mM MgCl2). DNA and Φ29 DNAP were added to the nanopore cis chamber to final concentrations of 1 and 0.75 μM, respectively. Cartoons above the current trace illustrate the sequence of events, which is described in the text. (c) DNA hairpin substrates featuring a 14-base pair duplex region and a single-stranded template region of 35 nucleotides. The template strand contains a reporter group of five consecutive abasic (1′,2′-H) residues spanning positions +8 to +12 (indicated as red Xs in the sequence). In the cartoons in (b), the abasic residues are shown as red circles. The primer strand of DNA1-H (c, i) terminates in a 2′-H, 3′-H CMP residue, and the primer strand of DNA1-OH (c, ii) terminates in a 2′-H, 3′-OH CMP residue. (d) Ionic current trace from a complex formed between wild type Φ29 DNAP and DNA1-H, captured at 180 mV in the buffer described in (b), but without MgCl2. (e) Ionic current trace for a complex formed between wild type Φ29 DNAP and DNA1-OH, captured at 180 mV in the buffer described in (b), but without MgCl2. The illustrations of the α-HL nanopore in (a) and (b) were adapted from reference (51).
Captured Φ29 DNAP-DNA complexes reside atop the nanopore for several to tens of seconds, during which the measured ionic current fluctuates on the millisecond time scale between two amplitude levels (Figure 1b, ii). Transition between the two amplitudes corresponds to movement of the DNA substrate relative to the enzyme and the nanopore; the distance of this displacement is approximately one nucleotide.21,27 The DNA displacement is detected by the use of a reporter group, which comprises five consecutive abasic (1′-H, 2′-H) residues in the template strand (red circles or red Xs, in Figure 1b, ii and 1c, respectively). A displacement of the abasic reporter group in the nanopore lumen is manifested as a change in measured ionic current.21,32 In the upper amplitude, the primer–template junction of the DNA1-H substrate is bound in the polymerase active site, in the pre-translocation state. At 180 mV, the pre-translocation state amplitude is centered at ∼32 pA (Figure 1b, ii; Figure S1 (SI)). In the lower amplitude, the primer–template junction of the DNA1-H substrate resides in the polymerase active site, in the post-translocation state. The post-translocation state amplitude is centered at ∼26 pA at 180 mV (Figure 1b, ii; Figure S1 (SI)). The fluctuations between the two amplitudes continue until complexes dissociate or are ejected, after which another complex can be captured.
For complexes formed with DNA substrates bearing 2′-H, 3′-H primer termini, plots of survival probability vs dwell time at each of the two amplitudes can be well fit by a single exponential decay function, indicating that both the pre-translocation state at the upper amplitude and the post-translocation state at the lower amplitude are discrete kinetic states, and that the transition in each direction across the translocation is a single kinetic step.22 Complexes fluctuate between the two states, with two transition rates: r1, the forward transition from the upper amplitude, pre-translocation state to the lower amplitude post-translocation state, and r2, the reverse transition from the post-translocation state to the pre-translocation state.22 We have used DNA substrates with 2′-H, 3′-H primer termini to determine the forward and reverse rates of translocation in Φ29 DNAP-DNA binary complexes as functions of applied force, active-site proximal DNA substrate sequences, and Φ29 DNAP active site mutations.22,46 The 2′-H, 3′-H terminated DNA substrates also allowed us to examine Φ29 DNAP-DNA-dNTP ternary complexes that were poised but not chemically competent for catalysis. Binding of dGTP (complementary to the template dCMP residue at n = 0) to Φ29 DNAP-DNA1-H complexes stabilizes the post-translocation state (Figure S1 (SI)).21,27,46 The kinetic mechanism of translocation and dNTP binding in individual Φ29 DNAP-DNA complexes is fully described by a three-state model with four transition rates, in which translocation and dNTP binding are sequential; dNTP can bind to complexes (kon[dNTP]) only after the transition from the pre-translocation to the post-translocation state (r1), and the transition from the post-translocation to the pre-translocation state (r2) cannot occur before the dissociation of dNTP (koff).27
To examine complexes formed with a DNA substrate bearing the natural 2′-H, 3′-OH primer terminus that is required for DNA synthesis, we first compared complexes formed between wild type Φ29 DNAP and DNA1-H (Figure 1c, i; DNA1-H) with complexes formed with an otherwise identical DNA substrate bearing a 2′-H, 3′-OH primer terminus (Figure 1c, ii; DNA1-OH), in the absence of divalent cations (in 1 mM EDTA). These conditions do not support catalytic function in either the polymerase or exonuclease active sites, nor do they support dNTP binding. Nonetheless, when complexes formed between Φ29 DNAP and DNA1-H are captured atop the nanopore in the absence of Me2+, fluctuations between the two amplitude states are observed (Figure 1d32). When complexes are formed between wild type Φ29 DNAP and DNA1-OH are captured under the same conditions, rapid fluctuations between the two amplitudes are also observed, but in contrast to the complexes with DNA1-H, the time traces are punctuated by pauses at the upper amplitude (Figure 1e).
We have shown that the 2′-H, 3′-H primer terminus significantly inhibits the onset of Φ29 DNAP-catalyzed exonucleolytic digestion of the primer strand of DNA substrates with fully complementary duplexes, relative to otherwise identical substrates bearing 2′-H, 3′-OH termini.32 This affords protection for DNA in the bulk phase, permitting us to conduct experiments with the wild type Φ29 DNAP under conditions in which substrates bearing 2′-H, 3′-OH termini are rapidly degraded. In attempts to capture complexes formed between the wild type enzyme and DNA1-OH, only a few complexes that displayed fluctuations between the appropriate amplitudes could be captured in the first ∼1 min after the addition of Mg2+ to the nanopore chamber; these complexes survived an average of 0.46 ± 0.07 s before dissociating via exonucleolytic digestion. Therefore, to examine whether the upper amplitude pauses could be observed when complexes formed with DNA substrates bearing 2′-H, 3′-OH termini are captured under conditions that support DNAP function (in the presence of divalent cations), we used the D12A/D66A mutant of Φ29 DNAP. This mutant lacks two of the ligands for the catalytic Me2+ ions in the exonuclease active site and thus has negligible exonucleolytic activity.40,47
Binary complexes formed between the D12A/D66A mutant and DNA1-H (Figure 2a) fluctuate between the pre-translocation and post-translocation states with forward and reverse rates that are almost indistinguishable from complexes formed with the wild type enzyme.46 Plots of survival probability vs dwell time for the upper and lower amplitudes can both be well fit by a single exponential decay function (Figure 2c, i and (ii), indicating that, as with the wild type enzyme, the transition in each direction across the translocation is a single kinetic step between two discrete kinetic states. Complexes formed between the D12A/D66A mutant and DNA1-OH exhibit a very different behavior: intervals of rapid fluctuation between the two amplitudes are interrupted by pauses at the upper amplitude that last for tens to hundreds of milliseconds (Figure 2b). For these complexes, the survival probability vs dwell time plot for the lower amplitude fits well to a single exponential (Figure 2d, i), indicating that, like the complexes formed with the 2′-H, 3′-OH terminated DNA substrate, the lower amplitude corresponds to one kinetic state. This state is stabilized by binding of dGMPCPP, a nonhydrolyzable dGTP analogue, confirming that it is the post-translocation state (Figure S2 (SI)). In contrast to the lower amplitude, the survival probability vs dwell time plot for the upper amplitude for complexes formed between the D12A/D66A enzyme and DNA1-OH clearly cannot be fit by a single exponential, and is fit by a model of two exponential modes (Figure 2d, ii). Thus, the pauses at the upper amplitude, which are not apparent when complexes are formed between either wild type or D12A/D66A Φ29 DNAP and DNA1-H, correspond to the presence of an additional kinetic state.
Figure 2.

A third kinetic state in Φ29 DNAP complexes formed with DNA1-OH. (a) Ionic current time trace from a complex formed between D12A/D66A Φ29 DNAP and DNA1-H, captured at 180 mV. (b) Ionic current time trace from a complex formed between D12A/D66A Φ29 DNAP and DNA1-OH, captured at 180 mV. (c) Survival probability vs dwell time plots for dwell time samples from (c, i) the lower amplitude state, or (c, ii) the upper amplitude state, extracted from ionic current traces for complexes formed between D12A/D66A Φ29 DNAP and DNA1-H. (d) Survival probability vs dwell time plots for dwell time samples from (d, i) the lower amplitude state, or (d, ii) the upper amplitude state, extracted from ionic current traces for complexes formed between D12A/D66A Φ29 DNAP and DNA1-OH. (e) Ionic current time trace from a complex formed between N62D Φ29 DNAP and DNA1-H, captured at 180 mV. (f) Ionic current time trace from a complex formed between N62D Φ29 DNAP and DNA1-OH, captured at 180 mV. (g) Survival probability vs dwell time plots for dwell time samples from (g, i) the lower amplitude state, or (g, ii) the upper amplitude state, extracted from ionic current traces for complexes formed between D12A/D66A Φ29 DNAP and DNA1-H. (h) Survival probability vs dwell time plots for dwell time samples from (h, i) the lower amplitude state, or (h, ii) the upper amplitude state, extracted from ionic current traces for complexes formed between D12A/D66A Φ29 DNAP and DNA1-OH. Dwell times samples plotted in panels c, d, g, and h were extracted from ionic current time traces as described in the Methods section. In panels c, i; c, ii; d, i; g, i; g, ii; and h, i, the survival probability data points were fitted to an exponential distribution. In panels d, ii and h, ii, the survival probability data points were fitted to a model of two exponential modes. The dwell time samples were extracted from data files in which complexes were captured at 180 mV; each file yields ∼20 000–40 000 dwell time samples for each amplitude level. In the plots, while 1 out of every 20 points is shown, the curves are fit to the full set of ∼20 000–40 000 dwell time samples.
We hypothesized that for complexes formed with DNA1-OH, the periods of rapid fluctuation are due to transitions between the pre-translocation and post-translocation states, and that the pauses in the upper amplitude arise when the primer strand is transferred from the polymerase active site to the exonuclease site (where it cannot be cleaved by the D12A/D66A mutant) and then is transferred from the exonuclease active site back to the polymerase active site, where the rapid fluctuations between the pre-translocation and post-translocation states can resume. A corollary to this hypothesis is that the 2′-H, 3′-H primer terminus inhibits the transition to the exonuclease site for DNA substrates with fully complementary-paired duplexes, consistent with its ability to inhibit their exonucleolytic cleavage.32
The N62D Mutant Diminishes the Pauses in the Upper Amplitude
The hypothesis that the pauses in the upper amplitude observed for complexes formed between the D12A/D66A mutant and DNA1-OH correspond to transfer of the primer strand between the polymerase and exonuclease active sites has two predictions: (1) conditions that decrease the probability of exonuclease site occupancy should diminish the probability of the pauses; and (2) transfer of the primer strand between the polymerase and exonclease sites in complexes held atop the nanopore occurs without the introduction of a novel ionic current amplitude. As a test of the first prediction, we compared complexes formed between the D12A/D66A enzyme and DNA1-OH (Figure 2b) with complexes formed between the N62D mutant of Φ29 DNAP and DNA1-OH (Figure 2f). Residue N62 is located in the exonuclease active site, where it directly interacts with the single-stranded DNA.8 The N62D mutant is strongly compromised in its ability to stably transfer the primer strand of DNA substrates from the polymerase active site to the exonuclease active site.48 The equilibrium across the translocation step for complexes formed between the N62D mutant and DNA substrates bearing 2′-H, 3′-H primer termini is almost indistinguishable from the equilibrium for complexes formed with the wild type or the D12A/D66A enzyme.21 We reasoned that if the pauses in the upper amplitude observed when complexes formed between the D12A/D66A enzyme and DNA1-OH are captured on the pore (Figure 2b) correspond to primer strand transfer to the exonuclease site, the impairment in stable primer strand binding at the exonuclease site caused by the N62D mutant would diminish the duration or probability of pauses for complexes formed with DNA1-OH. Qualitative inspection of the ionic current traces is consistent with this prediction; pauses in the upper amplitude are present with the N62D enzyme (Figure 2f), but the pauses appear to be of much shorter duration than the those observed in the time traces for the D12A/D66A enzyme (Figure 2b).
Like complexes formed between 2′-H, 3′-H terminated DNA substrates and the wild type Φ29 DNAP or the D12A/D66A mutant, when complexes are formed between the N62D mutant and DNA1-H (Figure 2e), plots of survival probability vs dwell time for both the upper and lower amplitudes can be fit by a single exponential (Figure 2g, i and (ii). The survival probability vs dwell time plot for the lower amplitude when complexes are formed between the N62D enzyme and the DNA1-OH substrate is also well fit by a single exponential function (Figure 2h, i), indicating the presence of one kinetic state at this amplitude. This state is stabilized by dGMPCPP, verifying that it is the post-translocation state (Figure S2 (SI)). The plot of survival probability vs dwell time at the upper amplitude for complexes formed between the N62D enzyme and the DNA1-OH substrate does not fit to a single exponential, but is well fit by a model of two exponential modes, indicating the presence of a second kinetic state at the upper amplitude (Figure 2h, ii), as was observed with complexes formed between the D12A/D66A enzyme and the DNA1-OH substrate (Figure 2d, ii). But there is a marked difference in the time scale on the dwell time coordinate for the plots for the two enzymes. For complexes formed with the D12A/D66A enzyme, the initial exponential decay occurs rapidly, with survival probability dropping from 10° to almost 10–2 in less than 10 ms, but the second decay of survival probability, from just above 10–2 to below 10–3, occurs over a time span of ∼300 ms (Figure 2d, ii). In contrast, while the first exponential for complexes formed with the N62D mutant decays at a similar rate as the first exponential for the D12A/D66A mutant, the second exponential for the N62D complexes decays much faster than the second exponential for the D12A/D66A complexes. For the N62D complexes, overall survival probability, comprising both decay rates, falls from 10° to below 10–3 over a time span of 25–30 ms (Figure 2h, ii). The significantly diminished probability of the second kinetic state at the upper amplitude, caused by the N62D mutant, is consistent with assignment of this state as one in which the primer strand has been transferred to the exonuclease site.
The Primer Strand in Φ29 DNAP Complexes Is Transferred between the Polymerase and the Exonuclease Active Sites without an Associated Change in Ionic Current Amplitude
To test the second prediction of our hypothesis, we sought to determine whether it is plausible that primer strand transfer between the polymerase and exonuclease active sites in captured complexes could occur without an accompanying change in ionic current amplitude. We therefore examined the amplitudes traversed when exonucleolytic excision reactions are catalyzed by wild type Φ29 DNAP in individual complexes while they are held atop the pore. Upon initial capture, complexes formed with DNA substrates bearing 2′-H, 3′-H termini fluctuate for several seconds between the amplitudes that are characteristic of the pre-translocation and post-translocation states.21,22 The amplitude values of the two states at a given voltage depend upon the distance from the primer–template junction to the abasic reporter in the template strand of the DNA substrate.21,32 For example, when the abasic residues span positions +7 to +11 of a template strand otherwise composed of poly-dCMP (Figure 3a, i), these amplitudes at 180 mV are ∼28 and ∼24.5 pA, for the pre-translocation and post-translocation states, respectively (Figure 3a, ii and iii, from the initial capture, indicated by red arrow above trace, to the blue arrow under the trace).
Figure 3.

Primer strand transfer between the polymerase and the exonuclease sites in Φ29 DNAP complexes without introduction of a novel ionic current amplitude. (a, i) DNA hairpin substrate featuring abasic residues (indicated as red Xs) spanning template positions +7 to +11, embedded in a template strand that consists otherwise of poly-dCMP from position +5 to +34. (a, ii) Time trace for a complex formed between wild type Φ29 DNAP and the DNA substrate in panel a, i, captured at 180 mV in the absence of dNTPs. The event terminates via successive exonucleolytic excisions from the primer strand (segment indicated by the dashed blue line below the trace). As nucleotides are excised from the primer, the template strand suspended through the nanopore lumen moves in single nucleotide increments toward the trans chamber. For DNA substrates in which the reporter initially resides above the most sensitive region of the lumen (including those in which it spans +7 to +11 or +8 to +12), the first excisions move the abasic reporter group closer to the sensitive region, causing an increase in amplitude until a peak is reached, after which further excisions move the abasic reporter group further away from the sensitive region, leading to a decrease in amplitude.32 (a, iii) Closer view of the initial segment of the capture event in panel a, ii, showing the amplitude fluctuations before and after exonucleolytic cleavage of the terminal ddCMP of the primer strand; the approximate time of this cleavage is indicated by the blue arrow below the trace. (a, iv) Closer view of the segment of the capture event shown in panel a, iii. The blue bracket with arrows on each end shows the region of the time trace during which the primer strand is transferred to the exonuclease site, one residue is excised, and the primer strand is returned to the polymerase site. (b, i) DNA hairpin substrate featuring abasic residues (indicated as red Xs) spanning template positions +8 to +12, embedded in a template strand that consists otherwise of poly-dCMP from +5 to +34. (b, ii) Time trace for a complex formed between wild type Φ29 DNAP and the DNA substrate in panel b, i, captured at 180 mV in the absence of dNTPs. As with the complex shown in panel a, the event terminates via successive exonucleolytic excisions from the primer strand (segment indicated by the dashed blue line below the trace). (b, iii) Closer view of the initial segment of the capture event shown in panel b, ii, showing the amplitude fluctuations before and after exonucleolytic cleavage of the terminal ddCMP of the primer; the approximate time of cleavage is indicated by the blue arrow below the trace. (b, iv) Closer view of the segment of the capture event shown in panel b, iii. The blue bracket with arrows on each end shows the region of the time trace during which the primer strand is transferred to the exonuclease site, one residue is excised, and the primer strand is returned to the polymerase site. (c, i) DNA substrate shown in panel a, i, highlighting the −1 and −2 positions in the duplex; the primer strand residues at these positions are ddCMP and dGMP, respectively. (c, ii) Time trace for a complex formed between wild type Φ29 DNAP and the DNA substrate in panel c, i, captured at 180 mV in the presence of ddCTP and dGTP. In the amplitude fluctuations prior to the first cleavage, the post-translocation state is stabilized by the presence of dGTP (complementary template position n = 0). (c, iii) Closer view of the trace segment that is indicated by the black bracketed line under the trace in c, ii. (c, iv) Closer view of the trace segment that is indicated by the black bracketed line under the trace in c, iii, showing that the amplitudes traversed during −1 and −2 exonucleolytic excision reactions directly mirror the amplitudes traversed during the polymerization reactions that readd the −2 and −1 nucleotides to the primer. Red arrows above the traces in panels a–c, ii and iii indicate the initial capture of the complex from the bulk phase.
During this initial period of fluctuation between the pre-translocation and post-translocation states there is no covalent change in the DNA substrate; the primer length is l = 14 nt (Figure 3a, i). These fluctuations continue for several to tens of seconds. In the presence of Mg2+, if a complex is not ejected by a voltage reversal, a series of successive exonucleolytic cycles is eventually initiated (Figure 3a, ii and 3b, ii, blue arrows and dashed blue lines under trace) that leads to dissociation of the DNA substrate and termination of the capture event. To initiate this process, the primer strand of the DNA substrate must be transferred to the exonuclease active site, where the 3′ residue can be excised.
After one residue has been excised from the DNA substrate with the initial +7 to +11 abasic reporter (Figure 3a, i), the primer length is l (−1) = 13 nt, and the distance from the primer–template junction to the abasic reporter has been increased by 1 nt; the abasic residues now span template positions +8 to +12. Complexes then fluctuate between ∼32 and ∼28 pA, the amplitudes characteristic of the pre-translocation and post-translocation states, respectively, for a DNA substrate in which the abasic reporter spans positions +8 to +1221(Figure 3a, ii and iii, to the right of the blue arrows under trace). This is verified by comparison to the amplitudes in Figure 3b, ii–iv, which shows the capture at 180 mV of a binary complex formed with a substrate in which the abasic block initially spans positions +8 to +12 of a template strand otherwise composed of poly-dCMP (Figure 3b, i). With this substrate, the amplitudes in the initial period of fluctuations, after capture and preceding the first exonucleolyic cleavage are ∼32 and ∼28 pA for the pre-translocation and post-translocation states, respectively (Figure 3b, ii and iii, from the initial capture, indicated by red arrow above trace, to the blue arrow under the trace). These amplitudes align precisely with those of the fluctuations that occur after one nucleotide has been excised from the DNA substrate with the initial +7 to +11 abasic reporter (see dashed red lines across Figure 3a, iii and iv, into 3c, iii and (iv). Close inspection of the segment of current trace during which the complexes in Figure 3a transition from the fluctuations between ∼28 and ∼24.5 pA to the fluctuations between ∼32 and ∼28 pA (Figure 3a, iv, segment indicated by blue bracket with arrows on each end below trace), reveals no additional amplitude levels, although the reporter group is positioned in the template strand such that a movement in either direction would be detected as a change in amplitude. Thus, during exonucleolytic digestion, there is no discernible unique amplitude associated with the state of the complex when the primer strand occupies the exonuclease active site.
After one residue has been excised from the DNA substrate with the initial +8 to +12 abasic reporter (Figure 3b, i), as in Figure 3b, the primer length is l (−1) = 13 nt, and the distance from the primer–template junction to the abasic reporter has been increased by 1 nt; in the case of this DNA substrate, after one residue has been cleaved, the abasic residues span template positions +9 to +13. Complexes then fluctuate between ∼34.5 and ∼32 pA, the amplitudes characteristic of the pre-translocation and post-translocation states, respectively, for a DNA substrate in which the abasic reporter spans positions +9 to +1321(upper two dashed red lines across Figure 3b, iii into 3c, iii). Again, close inspection of the segment of current trace during which the complexes in Figure 3b transition from the fluctuations between ∼32 and ∼28 pA upon initial capture to the fluctuations between ∼34.5 and ∼32 pA (Figure 3b, iv, segment indicated by blue bracket with arrows on each end below the trace), reveals no unique amplitude levels.
Once the 2′-H, 3′-H terminated residue of the DNA substrates in Figure 3a, i or 3b, i has been cleaved, the resulting l (−1) primer strand is 2′-H, 3′-OH terminated and thus competent to participate in phosphodiester bond formation. However, the experiments shown in Figure 3a,b were conducted in the absence of dNTPs or ddNTPs. Thus, the fluctuations from a higher to lower amplitude observed after the first exonucleolytic cleavage (to the right of the blue arrows, under the traces in Figure 3a, iii and 3b, iii), in which the enzyme advances on the DNA substrate, cannot be attributed to the covalent change of nucleotide addition. These forward fluctuations are therefore attributable to the noncovalent transition from the pre-translocation state to the post-translocation state, a transition that occurs in the polymerase active site. This indicates that after one nucleotide has been excised in the exonuclease active site, the primer strand is transferred back to the polymerase active site, where it fluctuates between the pre-translocation and post-translocation states.
The absence of an amplitude change associated with the transfer of the primer strand between the polymerase and exonuclease active sites is confirmed in current traces recorded under conditions in which successive rounds of nucleotide excision in the exonuclease site and nucleotide readdition in the polymerase active site can occur. An example is shown for a captured complex formed between Φ29 DNAP and the DNA substrate with the +7 to +11 abasic reporter (Figure 3c). When complexes are held atop the pore in the presence of nucleotide substrates complementary to the −1 (ddCTP) and −2 (dGTP) template residues of the starting substrate, there are occasionally segments in which two successive nucleotide excision reactions, followed by two successive nucleotide readdition reactions, are observed (shown in close-up in Figure 3c, iv, which corresponds to the segment underlined in black in Figure 3c, iii). The amplitudes traversed align precisely with those observed when the reporter occupied the +7 to +11, +8 to +12, or +9 to +13 positions in the template strand in the traces in Figure 3a,b (red dashed lines across traces in Figure 3a–c, iii and iv). Importantly, the amplitudes traversed during the exonucleolytic reactions directly mirror those traversed during the nucleotide addition reactions. The excision reactions require that the primer strand is bound in the exonuclease site, while the nucleotide addition reactions require that the primer–template duplex is bound in the polymerase site. Thus, there is no discernible unique amplitude associated with transfer of the primer strand between the polymerase to the exonuclease sites, indicating that the primer strand transfer occurs without an associated template strand displacement.
Kinetic Relationship between the Translocation Step and Transfer of the Primer Strand between the Polymerase and Exonuclease Active Sites
To characterize quantitatively the dynamics of the transitions between the pre-translocation, post-translocation and exonuclease states of Φ29 DNAP complexes, we sought to determine the kinetic model that best describes the relationship between the translocation step and primer strand transfer step. Specifically, we aimed to distinguish whether primer strand transfer from the polymerase to the exonuclease site initiates in the pre-translocation state or in the post-translocation state. In our experiments, and in the models considered, the transition from the exonuclease to polymerase site is for the case when the primer strand is returned without having been cleaved; it is thus the direct kinetic reversal of the transfer from the polymerase site to the exonuclease site, without an associated covalent change.
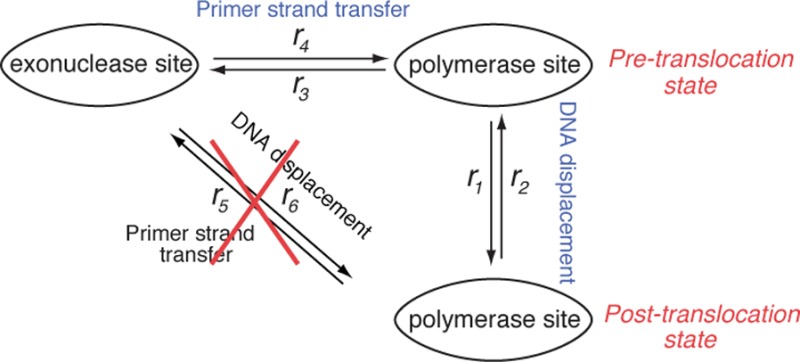
The potential kinetic models are illustrated in Figure 4. All of the models include the forward (r1) and reverse (r2) transitions between the pre-translocation and post-translocation states in the polymerase active site. In the first model, the transition from the polymerase to exonuclease site (r3) initiates in the pre-translocation state, and the transition from the exonuclease to polymerase site (r4) returns to the pre-translocation state; including r1 and r2, this model has four transition rates (Figure 4a). The second model also has four transition rates including r1 and r2; in this model, the transition to the exonuclease site initiates from and returns to the post-translocation state in the polymerase site, with rates designated as r5 and r6, respectively (Figure 4b). Finally, the third model has six transition rates, and allows for the possibility of transitions between the polymerase and exonuclease sites from both the pre-translocation and post-translocation states in the polymerase site (Figure 4c).
Figure 4.
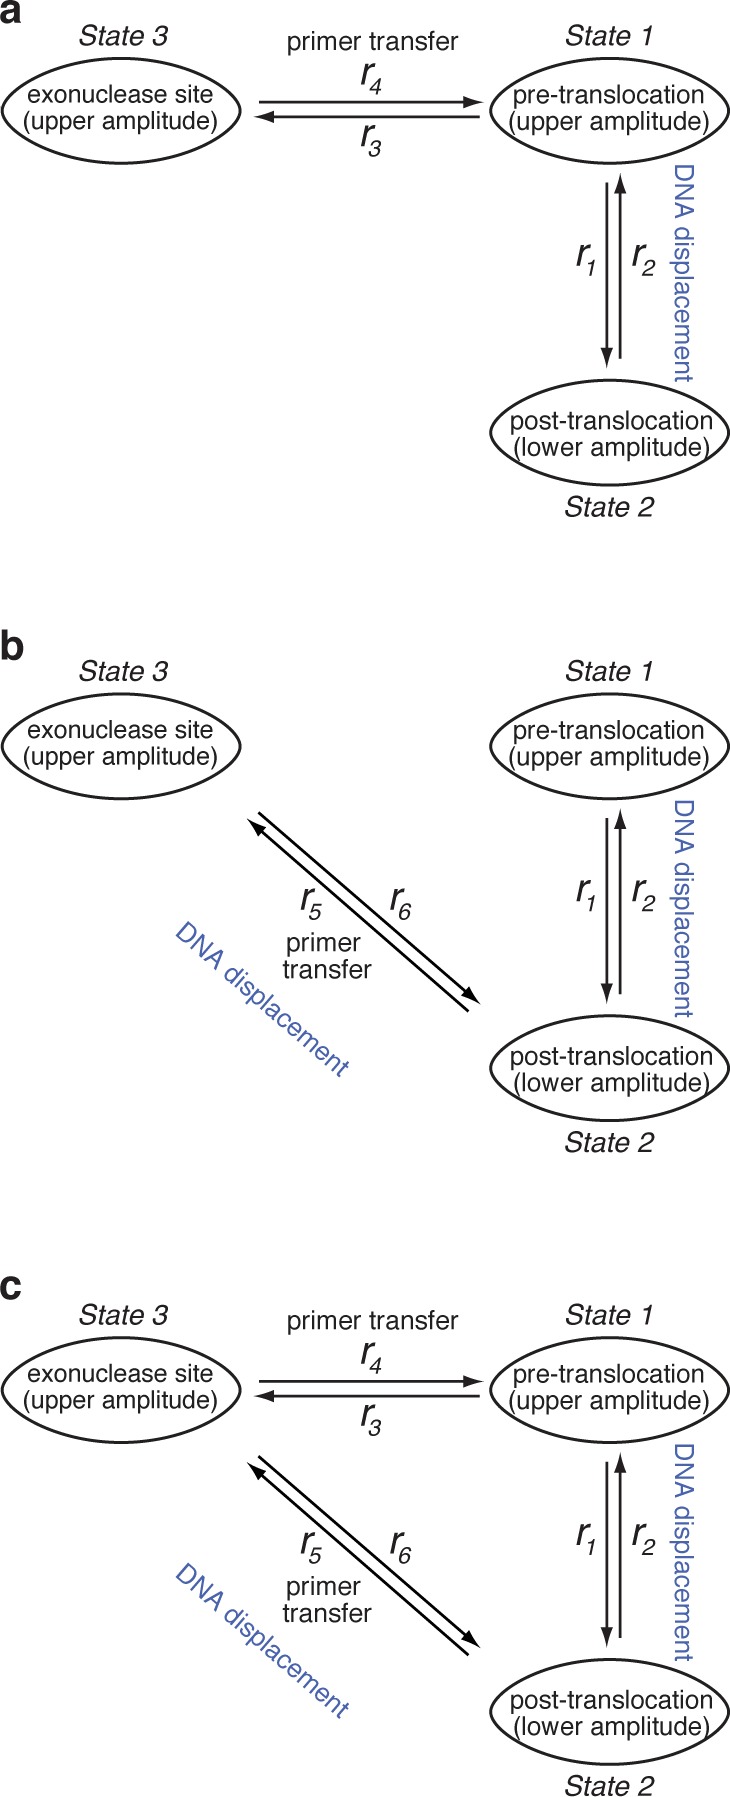
Potential models for the kinetic relationship between the translocation step and primer strand transfer between the polymerase and exonuclease sites. In all of the models, Φ29 DNAP-DNA binary complexes fluctuate between the pre-translocation and post-translocation states with the forward rate r1 and the reverse rate r2. (a) A three-state model in which transfer of the primer strand from the polymerase site to the exonuclease site initiates from the pre-translocation state (r3), and the uncleaved primer strand returns from the exonuclease site to the pre-translocation state in the polymerase site (r4). This is the model used in the current study to determine transition rates from measured time traces of current amplitude. (b) A three-state model in which transfer of the primer strand from the polymerase site to the exonuclease site initiates from the post-translocation state (r5), and the uncleaved primer strand returns from the exonuclease site to the post-translocation state in the polymerase site (r6). (c) A three-state model in which transfer of the primer strand from the polymerase site to the exonuclease site can initiate from both the pre-translocation state and post-translocation states (r3 + r5), and the uncleaved primer strand can return from the exonuclease site to both the pre-translocation and post-translocation states in the polymerase site (r4 + r6).
When Φ29 DNAP complexes are held atop the nanopore, the force applied by the voltage impedes the rate of the forward translocation (r1) and increases the rate of the reverse translocation (r2); plots of log(r1) versus voltage and log(r2) versus voltage for complexes formed with the DNA1-H substrate both fit to straight lines.22,27,46 This indicates that the force is applied along the direction of the translocation. The ionic current amplitude that corresponds to the state in which the primer strand occupies the exonuclease site, observed for the complexes formed with DNA1-OH, is the same as the amplitude observed when the complexes occupy the pre-translocation state in the polymerase site (Figures 1 and 2). Since the reporter group in the template strand of DNA1-OH is sensitively positioned to detect movement of the DNA in either direction,21,32 this indicates that when complexes that occupy the pre-translocation state in the polymerase site are compared to complexes in which the primer strand has been transferred to the exonuclease site, there is no spatial displacement along the direction of the applied force. Therefore, primer strand transfer between the polymerase site pre-translocation state and the exonuclease site (Figure 4a) would not be associated with an amplitude change or a corresponding spatial displacement along the direction of the applied force. By contrast, primer strand transfer between the polymerase site post-translocation state and the exonuclease site (Figure 4b,c) would be associated with an amplitude change and thus a spatial displacement along the direction of the applied force.
To assess which of the models in Figure 4 is consistent with the experimental observations, we fit the dwell time samples of the upper amplitude state to a model of two exponential modes with probability density:
Parameters c, λ1 and λ2 are calculated in the fitting. Note that the fitting is based solely on the model of two exponential modes given above, which can accommodate all three models in Figure 4 (see Supporting Information). To distinguish among the models, we study the quantity Q = (λ1λ2)/(cλ1 + (1 – c)λ2) as a function of the applied voltage. Quantity Q is calculated from c, λ1, and λ2 obtained in the fitting. Mathematically, we derive (in the Supporting Information) that
-
•
For the model in Figure 4a, Q = r4, which is independent of voltage.
-
•
For the model in Figure 4b, Q = r6, which increases as the voltage is reduced.
-
•
For the model in Figure 4c, Q = r4 + r6, which increases as the voltage is reduced, although the increase in r6 may be disguised if r4 is much larger than r6.
Figure 5 shows a plot of Q vs voltage for complexes formed between D12A/D66A and DNA1-OH. It is clear that Q does not show any trend of increasing as the applied voltage is reduced from 220 to 140 mV. Thus, r5 and r6 are negligible in comparison with r3 and r4. Specifically, r3 and r4 must be nonzero to explain the experimental observations. In addition, r3 and r4 describe the dominant transfer pathway between the polymerase site and the exonuclease site. While the alternative transfer pathway described by r5 and r6 cannot be completely ruled out, it is very unlikely; within the range of estimated error, we can conclude that r5 = 0 and r6 = 0. We therefore adopt the three-state kinetic model with four transition rates shown in Figure 4a, in which the transition of the primer strand from the polymerase site to the exonuclease site initiates when the complex is in the pre-translocation state; when the primer strand is returned from the exonuclease site to the polymerase site without having been cleaved, the complex returns to the pre-translocation state.
Figure 5.
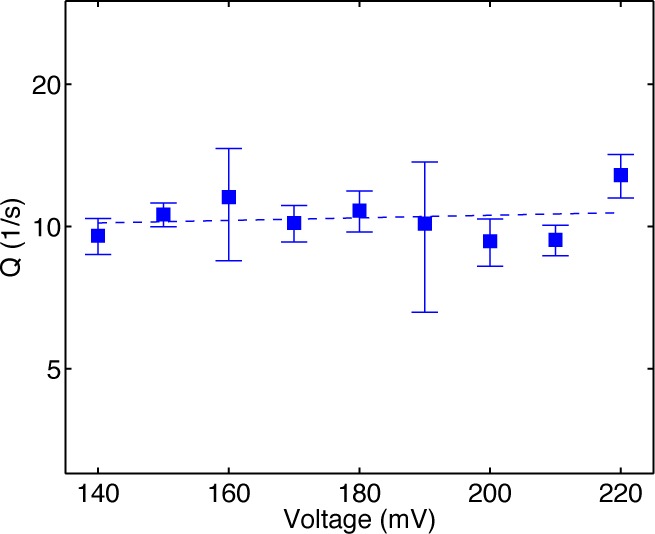
Distinguishing among the kinetic models. Plot of Q vs voltage for complexes formed between the Φ29 DNAP D12A/D66A mutant and DNA1-OH. The quantity Q, as defined in the text, is calculated by fitting a model of two exponential modes to the dwell time samples of the upper amplitude state. The model of two exponential modes is consistent with all three kinetic models illustrated in Figure 4. The behavior of Q vs voltage, however, is expected to differ among the models, yielding the possibility of determining which model best explains the experimental observations. For the model in Figure 4a, Q is expected to be independent of the voltage, while for the models in Figure 4b,c, Q is expected to increase as voltage is reduced. The plot of Q vs voltage for the D12A/D66A complexes shows that Q is independent of the voltage, leading to the selection of the kinetic model in Figure 4a.
Determining the Forward and Reverse Translocation Rates and the Rates of Primer Strand Transfer in Both Directions between the Polymerase and Exonuclease Sites from Ionic Current Traces
We previously used the autocorrelation of the measured time trace to extract kinetic transition rates in a three-state model for the Φ29 DNAP translocation and dNTP binding steps.27,46 The autocorrelation method works well when the third state (in that case, the dNTP-bound, post-translocation state) is well sampled in the experiments. In dNTP binding experiments, the dNTP concentration can be selected to obtain data in which the dNTP-bound state is suitably sampled. In the current study, the three-state model for the translocation and primer strand transfer between the polymerase site and the exonuclease site (Figure 4a) is of the same mathematical structure as the three-state model for dNTP binding. In principle, the kinetic rates can be extracted using the method of autocorrelation. However, if the third state (in this case, the exonuclease state) is not well represented in the measured time trace, the signal-to-noise ratio of the autocorrelation becomes unacceptably small. When examining the primer strand transfer between the polymerase site and the exonuclease site there is no experimental parameter that can be tuned to change how often the exonuclease site is sampled. Thus, we require a more robust method that works well even when the third state is not optimally sampled. For that purpose, we consider the dwell time samples of each amplitude state. The dwell time of the lower amplitude is exponentially distributed with rate r2 (Figure 4a). The dwell time of the upper amplitude has two exponential modes with rates λ1 and λ2, and with fractions c and (1 – c) (see Supporting Information for derivation). Intermediate parameters λ1, λ2, and c are calculated by fitting dwell time samples to a model of two exponential modes. Kinetic rates r1, r3, and r4 are then calculated from λ1, λ2, and c (see Supporting Information for derivation):
We note that while the dwell time samples from the upper amplitude fit well to a model of two exponential modes, we cannot rule out the possibility that the third state is a composite, comprising intermediate states that we cannot yet resolve. Thus, the model in Figure 4a should be viewed as a reasonable first model in this quantitative kinetic study of the rates of primer strand transfer between the polymerase site and the exonuclease site. As we refine the experimental technology and mathematical methods for data analysis, we anticipate the capacity to resolve additional kinetic detail.
We applied the model in Figure 4a to simultaneously extract the rates of the pre-translocation to post-translocation state transition (r1), the post-translocation to pre-translocation state transition (r2), and the rates of primer strand transfer from the pre-translocation state in the polymerase site to the exonuclease site (r3), and from the exonuclease site back to the pre-translocation state in the polymerase site (r4). Figure 6 shows plots of these rates, determined from dwell time samples extracted from ionic current time traces for complexes captured across a range of applied voltages.
Figure 6.

Rates of translocation and primer strand transfer between the polymerase and exonuclease sites. Plots of (a) log(r1) vs voltage, (b) log(r2) vs voltage, (c) log(r3) vs voltage, and (d) log(r4) vs voltage for complexes formed between DNA1-OH and the D12A/D66A (blue squares), N62D (red circles), or Y226F/D12A/D66A (yellow triangles) mutants of Φ29 DNAP. Rates were determined from dwell time samples extracted from ionic current traces and the three-state model in Figure 4a. Errors bars indicate the standard error. Values for the rates and errors are given in Table S1 (SI).
Complexes Formed with D12A/D66A Φ29 DNAP
When complexes formed between DNA1-OH and the D12A/D66A enzyme are captured atop the nanopore, the transition rates from the pre-translocation state to the exonuclease site (r3; Figure 6c) and from the exonuclease site to the pre-translocation state (r4; Figure 6d) do not vary across the range of voltages tested. This indicates that primer strand transfer is not associated with a spatial displacement along the direction of the applied force, and further supports the three-state kinetic model in which primer strand transfer to the exonuclease site initiates from, and returns to, the pre-translocation state in the polymerase site (Figure 4a). It also indicates that within the measured voltage regime, the applied force does not affect the transition rates between the polymerase and exonuclease sites via a mechanism that is unrelated to a spatial displacement, such as a structural distortion of the complex in one or more of the states. Because neither r3 nor r4 displays a systematic trend with the applied voltage, we treat the data points at each voltage as independent samples, and calculate the mean and standard error for each of these two rates for complexes formed with the D12A/D66A mutant as r3 = 11.54 ± 0.30 s–1 and r4 = 10.48 ± 0.31 s–1.
Complexes Formed with N62D Φ29 DNAP
As found for the complexes formed with the D12A/D66A mutant, when complexes are formed between the N62D mutant and DNA1-OH, there is no systematic trend in the primer strand transfer rates as a function of the applied voltage, within the tolerances of the errors (Figure 6c,d). Because r4 for the N62D mutant is much larger than it is for the D12A/D66A mutant, the errors for the primer transfer rates for the N62D mutant are higher than the errors for the primer transfer rates for the D12A/D66A mutant; the higher values of r4 for the N62D mutant reduce the accuracy of extracting rates by making the two exponential modes less well separated in the dwell time of the upper amplitude. When the data points for N62D complexes captured at each voltage are treated as independent samples and the mean and standard error for the two rates is calculated, r3 = 40.91 ± 13.40 s–1 and r4 = 221.22 ± 21.90 s–1. Thus, the N62D mutant displays an ∼20-fold increase in r4 relative to the D12A/D66A mutant. This is consistent with the biochemical analyses of this mutant, which show that it destabilizes primer strand binding in the exonuclease site,48 and it is in accord with our assignment of the second kinetic state at the upper amplitude as the exonuclease state. Interestingly, r3 is ∼3.5-fold higher for the N62D mutant than it is for the D12A/D66A mutant. While we cannot yet assign a mechanistic cause to this increase, it is possible that the height of the transition state barrier for the primer transfer reaction is lower for the N62D mutant than it is for the D12A/D66A mutant, yielding an increase in r3 and partially contributing to the increase in r4. Nonetheless, even with the increase in r3 for the N62D mutant, the more substantial increase in r4 dominates the equilibrium across the primer strand transfer step (r3/r4) for the two enzymes; while for the D12A/D66A enzyme, r3/r4 = 1.10 ± 0.02; for the N62D mutant, r3/r4 = 0.20 ± 0.03.
When the translocation rates for complexes formed between the N62D mutant and DNA1-OH are compared to those for the D12A/D66A mutant and DNA1-OH, r1 is similar for the two mutants (Figure 6a), but r2 is ∼50% slower with the N62D mutant, across the range of voltages (Figure 6b). The slopes of log(r1) and log(r2) for complexes formed between N62D and DNA1-OH exhibit only small differences from those for complexes formed between D12A/D66A and DNA1-OH (Figure 6a,b). We have shown that the equilibrium across the translocation step for complexes formed between DNA1-H and the wild type enzyme, the D12A/D66A mutant, or the N62D mutant are almost indistinguishable.21 Despite this, the N62D mutation also affects the translocation rates in complexes with DNA1-H, causing a decrease in the both rates relative to complexes formed between the wild type or D12A/D66A enzymes and DNA1-H (Figure S3 (SI)). As in the case of the complexes formed with DNA1-OH, the slopes of log(r1) and log(r2) are not altered by the N62D mutation (Figure S3 (SI)); both r1 and r2 are decreased to the same extent (∼20–25%) across all of the voltages, thus maintaining the translocation equilibrium.
The ability of the N62D mutant to perturb the rates across the translocation step expands the list of effects of Φ29 DNAP exonuclease active site mutations on enzyme functions other than exonucleolysis, including some that are directly associated with the polymerase active site. The D12A/D66A mutations cause a decreased rate of dNTP dissociation from the post-translocation state polymerase site,46 and several exonuclease site mutants, including the D12A/D66A enzyme, are severely impaired in the ability to perform DNA synthesis coupled to downsteam strand displacement,38,42,49 although the N62D mutant does not display this impairment.48 These pleiotropic effects of exonuclease site mutations highlight the close relationship between exonuclease active site structure and interdomain architecture in Φ29 DNAP.
Complexes Formed with Y226F/D12A/D66A Φ29 DNAP
We next asked whether the Y226F mutation in Φ29 DNAP affects the rates of primer strand transfer between the polymerase and exonuclease sites. Residue Y226 is located in the polymerase active site;5 in complexes formed with DNA1-H, introduction of the Y226F mutation into either the wild type or D12A/D66A backgrounds causes a decrease in the forward and reverse translocation rates, an increase in pyrophosphate binding affinity in the pre-translocation state, and a significant decrease in the dNTP dissociation rate in the post-translocation state.46 The Y226F mutant, like the N62D mutant in the exonuclease site, is impaired in the exonucleolytic digestion of the primer strand of DNA substrates bearing fully base-paired duplexes.50 Because of its location in the polymerase active site, we hypothesized that the Y226F mutation may decrease the probability of the exonuclease state by a mechanism that is distinct from N62D. Whereas the N62D mutation exerts its effects primarily through a large increase in the rate of transfer from the exonuclease to polymerase site (r4), the location of Y226 suggests that it might exert its effects on the probability of the exonuclease state by decreasing the rate of transfer from the polymerase to exonuclease site (r3).
Despite the lower exonucleolytic activity on primer–template substrates of the Y226F mutant relative to wild type Φ29 DNAP,50 when we attempted to capture complexes formed between the Y226F enzyme and DNA1-OH we found that under the conditions of the nanopore experiments, the probability of exonucleolytic cleavage in both the bulk phase and in complexes held atop the pore was higher than for complexes formed with the N62D mutant. While a few complexes that displayed fluctuations between the appropriate amplitudes could be captured within the first ∼1–2 min after the addition of Mg2+, these complexes survived an average of 1.12 ± 0.38 s atop the pore before they dissociated via exonucleolytic digestion. This can be compared to an average duration of 13.21 ± 0.47 s for complexes formed with the N62D mutant (this value is likely to be an underestimate, because many N62D enzyme complexes continued to fluctuate between the two amplitudes up to the end of the maximum 20 s allowed before complex ejection via a programmed voltage reversal). Capture of complexes with the Y226F mutant bearing intact DNA1-OH beyond the first minutes of the experiment required the repeated addition of fresh 1 μM aliquots of intact DNA to the bulk phase. By contrast, with the N62D mutant, experiments that lasted >2 h, with robust rates of intact complex capture, were performed with a single addition of 1 μM DNA1-OH at the start of the experiment. We therefore used the Y226F/D12A/D66A mutant to examine the effects of the Y226F mutation on the translocation and primer strand transfer rates. Ionic current time traces for complexes formed between the Y226F/D12A/D66A mutant and DNA1-OH captured atop the nanopore exhibit intervals of rapid fluctuation between two amplitudes that are interrupted by pauses at the upper amplitude (Figure S2 (SI)). The lower amplitude state is stabilized by binding of dGMPCPP, verifying that it is the post-translocation state (Figure S2 (SI)).
The primer strand transfer rates between the pre-translocation state polymerase site and the exonuclease site determined for complexes formed between DNA1-OH and the Y226F/D12A/D66A mutant, like those for the D12A/D66A and N62D mutants, did not display a systematic trend as a function of applied voltage (Figure 6c,d). The mean and standard error for the two transfer rates for the Y226F/D12A/D66A complexes, calculated by treating the data points at each voltage as independent samples, are r3 = 5.14 ± 0.24 s–1 and r4 = 12.02 ± 0.73 s–1. Thus, introduction of the Y226F mutation diminishes the rate of primer strand transfer from the polymerase to the exonuclease site by ∼2.25-fold relative to the D12A/D66A enzyme, while having negligible effect on the rate of the exonuclease site to polymerase site transition. The equilibrium across the primer strand transfer step (r3/r4) for the Y226F/D12A/D66A is decreased accordingly; for the Y226F/D12A/D66A, (r3/r4) = 0.43 ± 0.01, compared to r3/r4 = 1.10 ± 0.02 for the D12A/D66A enzyme.
In complexes formed with DNA1-OH, introduction of the Y226F mutation causes a decrease in both the forward and reverse translocation rates across the range of voltages, as well as a modest increase in the slope of log(r1) vs voltage and a modest decrease in the slope of log(r2) vs voltage (Figure 6a,b). Similar effects on the translocation rates were observed when complexes of the Y226F and Y226F/D12A/D66A mutants formed with DNA1-H were compared to wild type or D12A/D66A complexes formed with DNA1-H.46 Interestingly, the Y226F mutation diminishes the rates of the two transitions that initiate in the pre-translocation state, from the pre-translocation to the post-translocation state (r1), and from the pre-translocation to the exonuclease state (r3). This suggests that the mutation affects the two rates via a common mechanism: the Y226F mutation may lower the free energy of the pre-translocation state, leading to a decrease in the rates of both transitions that initiate from this branchpoint.
The Primer Strand 3′-OH Group Is a Determinant in the Energy Landscape Across the Translocation Step
We compared the transition rates across the translocation step as a function of applied force for complexes formed between DNA1-OH and the D12A/D66A, N62D, or Y226F/D12A/D66A enzymes to the translocation rates for complexes formed between each of these three enzymes and DNA1-H (Figure 7). The presence of the natural 3′-OH moiety on the primer strand has a significant effect on the translocation step; both the vertical intercepts and the slopes of log(rate) vs voltage are affected, indicating that the 3′-OH group influences both the rate at a given voltage and the dependence of the rates on voltage. The slope of log(r1) vs voltage is negative and proportional to the distance between the pre-translocation state and the transition state for the translocation step; the slope of log(r2) vs voltage is positive and proportional to the distance between the transition state and the post-translocation state.22 For each of the three enzymes examined, the transition from the pre-translocation to post-translocation state (r1) is ∼3–4-fold faster in complexes with DNA1-OH than it is in complexes of DNA1-H. The presence of the 3′-OH group also causes a small decrease in the slope of log(r1) vs voltage (Figure 7a,c,e). The 3′-OH group exerts its effect on the transition from the post-translocation to pre-translocation state primarily by causing an increase in the slope of log(r2) vs voltage (Figure 7b,d,f). Taken together, these data indicate that along the coordinate of the translocation displacement, the transition state is closer to the pre-translocation state for complexes formed with DNA1-OH than it is for complexes formed with DNA1-H.
Figure 7.

Influence of the primer strand 3′-OH group on the translocation step. Plots of log(r1) vs voltage (a,c,e) and log(r2) vs voltage (b,d,f) comparing complexes formed with DNA1-H to complexes formed with DNA1-OH for the D12A/D66A (a,b), N62D (c,d), or Y226F/D12A/D66A (e,f) mutants of Φ29 DNAP. Plots of log(r1) vs voltage and log(r2) vs voltage for complexes formed between the wild type Φ29 DNAP and DNA1-H are also shown in panels a and b, respectively. For complexes formed with DNA1-OH, rates were determined using dwell time samples extracted from ionic current traces and the three-state model in Figure 4a. For complexes formed with DNA1-H, rates were determined using dwell time samples extracted from ionic current traces and a two-state model for the translocation step.22
Discussion
In this study, we have determined that the pathway for primer strand transfer from the Φ29 DNAP polymerase site to exonuclease site initiates before the translocation step, while complexes are in the pre-translocation state. In the extensive literature on exonucleolytic editing by replicative DNAPs (for examples, see references (3) and (4)), it is frequently noted that after the incorporation of a correctly base-paired dNMP during synthesis in the presence of dNTPs, the primer strand is rapidly extended. In kinetic terms, this implies that the sequential steps of (i) forward translocation after the complementary incorporation, (ii) dNTP binding to the post-translocation state complex, and (iii) progression to the chemical step, rapidly follow the correctly paired addition. The literature further notes that, by contrast, after the incorporation of an incorrectly base-paired dNMP, the primer strand is much less efficiently extended. This hindrance to forward progression is viewed as yielding an increase in the probability of exonuclease complex formation. Prior to this study, the translocation state from which the primer strand transfer to the exonuclease site initiates was not known. This distinction is not trivial; the pre-translocation and post-translocation states are structurally and functionally distinct, and are separated by an energy barrier.5,22 If the kinetic relationship between translocation and primer strand transfer is not understood, the explicit structural and kinetic mechanisms that govern the discrimination between correctly paired and incorrectly paired primer termini cannot be fully determined, and the relative kinetic contributions of the translocation step, dNTP binding step, and primer strand transfer step to this discrimination cannot be quantified.
The demonstration that the pathway for primer strand transfer from the polymerase site to exonuclease site initiates in the pre-translocation state (Figure 5) has direct implications for the potential mechanisms of discrimination between correctly paired and incorrectly paired primer termini. It indicates that the inefficient primer extension observed after mismatch incorporation could be due to distinct, but not mutually exclusive mechanisms: (a) an increase in the transition rate from the pre-translocation state to the exonuclease site; (b) a decrease in the transition rate from the pre-translocation state to the post-translocation state; (c) an increase in the transition rate from the post-translocation state to the pre-translocation state; (d) a decrease in dNTP binding affinity in the translocated complex, which itself could be due to a decreased association rate, an increased dissociation rate, or both; and (e) a decreased rate of progression to the chemical step after dNTP binding in the post-translocation state. Because dNTP binds to Φ29 DNAP complexes only after the forward translocation and has no influence on the forward or reverse rates of the translocation step,27 a decrease in dNTP binding affinity or in the rate of progresssion to chemistry caused by a mismatch could affect the probability of transfer to the exonuclease site solely by increasing the probability of fluctuation back to the pre-translocation state. Together, the rates of steps a–e comprise the net probability of primer strand transfer to the exonuclease site, and any of these steps could be strongly affected by the introduction of a mismatch in the primer strand. By establishing the position of the translocation step in the kinetic pathway that governs discrimination, this study yields a framework for examining how, and at what steps, noncomplementary nucleotide additions alter this net probability.
We note that the transition rates from the exonuclease to polymerase site (r4) measured in this study are for the case when the primer strand is returned to the polymerase site without having been cleaved in the exonuclease site. Transition rates from the exonuclease to polymerase site for the case where the primer has been cleaved are likely to be different, as the interactions of the primer strand with the exonuclease site are altered by the covalent change. For the D12A/D66A and Y226F/D12A/D66A enzymes, the exonuclease site is not catalytically functional, the rate of cleavage of DNA substrates is negligible,40,47 and the transition rate for primer strand transfer from the exonuclease to polymerase site measured in our experiments is necessarily for the uncleaved primer. For the N62D enzyme, the probability of cleavage of the primer strand of a fully paired DNA substrate is severely diminished, but the exonuclease site is not catalytically inactive: a −1 mismatch is efficiently cleaved by this mutant, and it retains almost 20% of the wild type level of exonucleolytic activity when assayed on single-stranded DNA substrates.50 Nonetheless, when N62D complexes formed with DNA1-OH are captured on the pore, there are hundreds of primer strand transitions from the polymerase site to the exonuclease site from which the primer strand returns to the polymerase site uncleaved. Whether or not a cleavage reaction occurs upon any individual transition to the exonuclease site will depend upon a competition between the rate of exonucleolysis and r4 for the uncleaved primer strand. Both of these rates can be dictated by the environment in the exonclease site, and affected by DNAP mutations, and by structural features of the primer strand (for example, by the presence of a 2′-H, 3′-H or 2′-H, 3′-OH terminus). The behavior of the N62D mutant may be illustrative of this competition; the transitions between the polymerase and exonuclease sites that occur without cleavage when N62D complexes are held atop the pore suggest that for this mutant, r4 is faster than exonucleolysis, yielding the kinetic basis of the significant reduction in exonucleolytic activity of this mutant.
Digestion of the primer strand of DNA substrates by the Φ29 DNAP exonuclease has been shown to be processive, in the sense that the enzyme does not dissociate from the DNA between consecutive excision reactions.40 However, the data in Figure 3 indicate that for the wild type Φ29 DNAP, when the primer strand is fully complementary to the template strand, the exonuclease is not necessarily processive in the sense that the primer strand remains in the exonuclease site after each excision. After some or all excision reactions the primer strand returns to the polymerase site, as evidenced by the fluctuations between the pre-translocation and post-translocation states between excision reactions (Figure 3). If upon transition from the polymerase to exonuclease site, a primer strand bearing a mismatched dNMP at the −1 position is returned to the polymerase site uncleaved, it is likely that r3 ≫ r1 and thus the primer strand may be repeatedly transferred to the exonuclease site without undergoing a forward translocation fluctuation in the polymerase site. Taken together, the findings that (i) primer transfer from the polymerase to exonuclease site initiates in the pre-translocation state (Figure 5), (ii) that there is no spatial displacement in the translocation direction associated with primer strand transfer (Figure 3), and (iii) after some or all single excision reactions the primer strand is returned to the polymerase site (Figure 3) present an attractive model for the relationship of the translocation step to the coordination of the polymerase and exonuclease functions. After a primer strand of length l transitions to the exonuclease site from the pre-translocation state and 1 nt is cleaved, when the strand returns to the polymerase site and repairs with the template, the resulting complex is in the post-translocation state for the l – 1 DNA substrate, poised to bind incoming dNTP and resume DNA synthesis.
Acknowledgments
We are grateful to Margarita Salas for the gift of the Y226F/D12A/D66A Φ29 DNAP mutant enzyme, and to Mark Akeson for helpful discussions. This work was supported by NIH Grant R01GM087484 from NIGMS (to K.R.L.) and by NSF Grant DMS-0719361 (to H. W.). J.M.D. was supported by a University of California Santa Cruz Research Mentoring Institute fellowship (NHGRI Grant R25HG006836).
Supporting Information Available
Mathematical derivations; Figures S1–S3; Table S1. This material is available free of charge via the Internet at http://pubs.acs.org.
The authors declare no competing financial interest.
Funding Statement
National Institutes of Health, United States
Supplementary Material
References
- Joyce C. M.; Potapova O.; Delucia A. M.; Huang X.; Basu V. P.; Grindley N. D. F. Biochemistry 2008, 47, 6103. [DOI] [PubMed] [Google Scholar]
- Johnson K. A. Biochim. Biophys. Acta 2010, 1804, 1041. [DOI] [PMC free article] [PubMed] [Google Scholar]
- Kunkel T. A. J. Biol. Chem. 2004, 279, 16895. [DOI] [PubMed] [Google Scholar]
- Reha-Krantz L. J. Biochim. Biophys. Acta 2010, 1804, 1049. [DOI] [PubMed] [Google Scholar]
- Berman A. J.; Kamtekar S.; Goodman J. L.; Lázaro J. E. M.; de Vega M.; Blanco L.; Salas M.; Steitz T. A. EMBO J. 2007, 26, 3494. [DOI] [PMC free article] [PubMed] [Google Scholar]
- Doublié S.; Tabor S.; Long A. M.; Richardson C. C.; Ellenberger T. Nature 1998, 391, 251. [DOI] [PubMed] [Google Scholar]
- Eom S. H.; Wang J.; Steitz T. A. Nature 1996, 382, 278. [DOI] [PubMed] [Google Scholar]
- Kamtekar S.; Berman A. J.; Wang J.; Lázaro J. E. M.; de Vega M.; Blanco L.; Salas M.; Steitz T. A. Mol. Cell 2004, 16, 609. [DOI] [PubMed] [Google Scholar]
- Wang J.; Sattar A. K.; Wang C. C.; Karam J. D.; Konigsberg W. H.; Steitz T. A. Cell 1997, 89, 1087. [DOI] [PubMed] [Google Scholar]
- Shamoo Y.; Steitz T. A. Cell 1999, 99, 155. [DOI] [PubMed] [Google Scholar]
- Joyce C. M. J. Biol. Chem. 1989, 264, 10858. [PubMed] [Google Scholar]
- Donlin M. J.; Patel S. S.; Johnson K. A. Biochemistry 1991, 30, 538. [DOI] [PubMed] [Google Scholar]
- Capson T. L.; Peliska J. A.; Kaboord B. F.; Frey M. W.; Lively C.; Dahlberg M.; Benkovic S. J. Biochemistry 1992, 31, 10984. [DOI] [PubMed] [Google Scholar]
- Hariharan C.; Reha-Krantz L. J. Biochemistry 2005, 44, 15674. [DOI] [PubMed] [Google Scholar]
- Fidalgo da Silva E.; Reha-Krantz L. J. Nucleic Acids Res. 2007, 35, 5452. [DOI] [PMC free article] [PubMed] [Google Scholar]
- Lamichhane R.; Berezhna S. Y.; Gill J. P.; Van der Schans E.; Millar D. P. J. Am. Chem. Soc. 2013, 135, 4735. [DOI] [PMC free article] [PubMed] [Google Scholar]
- Baker R. P.; Reha-Krantz L. J. Proc. Natl. Acad. Sci. U. S. A. 1998, 95, 3507. [DOI] [PMC free article] [PubMed] [Google Scholar]
- Ibarra B.; Chemla Y. R.; Plyasunov S.; Smith S. B.; Lázaro J. E. M.; Salas M.; Bustamante C. EMBO J. 2009, 28, 2794. [DOI] [PMC free article] [PubMed] [Google Scholar]
- Spacciapoli P.; Nossal N. G. J. Biol. Chem. 1994, 269, 438. [PubMed] [Google Scholar]
- Hogg M.; Wallace S. S.; Doublié S. EMBO J. 2004, 23, 1483. [DOI] [PMC free article] [PubMed] [Google Scholar]
- Dahl J. M.; Mai A. H.; Cherf G. M.; Jetha N. N.; Garalde D. R.; Marziali A.; Akeson M.; Wang H.; Lieberman K. R. J. Biol. Chem. 2012, 287, 13407. [DOI] [PMC free article] [PubMed] [Google Scholar]
- Lieberman K. R.; Dahl J. M.; Mai A. H.; Akeson M.; Wang H. J. Am. Chem. Soc. 2012, 134, 18816. [DOI] [PMC free article] [PubMed] [Google Scholar]
- Kiefer J. R.; Mao C.; Braman J. C.; Beese L. S. Nature 1998, 391, 304. [DOI] [PubMed] [Google Scholar]
- Li Y.; Korolev S.; Waksman G. EMBO J. 1998, 17, 7514. [DOI] [PMC free article] [PubMed] [Google Scholar]
- Jain R.; Nair D. T.; Johnson R. E.; Prakash L.; Prakash S.; Aggarwal A. K. Structure 2009, 17, 974. [DOI] [PMC free article] [PubMed] [Google Scholar]
- Ummat A.; Silverstein T. D.; Jain R.; Buku A.; Johnson R. E.; Prakash L.; Prakash S.; Aggarwal A. K. J. Mol. Biol. 2012, 415, 627. [DOI] [PMC free article] [PubMed] [Google Scholar]
- Lieberman K. R.; Dahl J. M.; Mai A. H.; Cox A.; Akeson M.; Wang H. J. Am. Chem. Soc. 2013, 135, 9149–9155. [DOI] [PMC free article] [PubMed] [Google Scholar]
- Kasianowicz J. J.; Robertson J. W. F.; Chan E. R.; Reiner J. E.; Stanford V. M. Annu. Rev. Anal. Chem. 2008, 1, 737. [DOI] [PubMed] [Google Scholar]
- Howorka S.; Siwy Z. Chem. Soc. Rev. 2009, 38, 2360. [DOI] [PubMed] [Google Scholar]
- Reiner J. E.; Balijepalli A.; Robertson J. W. F.; Campbell J.; Suehle J.; Kasianowicz J. J. Chem. Rev. 2012, 112, 6431. [DOI] [PubMed] [Google Scholar]
- Stoloff D. H.; Wanunu M. Curr. Opin. Biotechnol. 2013, 24, 699. [DOI] [PMC free article] [PubMed] [Google Scholar]
- Lieberman K. R.; Cherf G. M.; Doody M. J.; Olasagasti F.; Kolodji Y.; Akeson M. J. Am. Chem. Soc. 2010, 132, 17961. [DOI] [PMC free article] [PubMed] [Google Scholar]
- Cherf G. M.; Lieberman K. R.; Rashid H.; Lam C. E.; Karplus K.; Akeson M. Nat. Biotechnol. 2012, 30, 344. [DOI] [PMC free article] [PubMed] [Google Scholar]
- Manrao E. A.; Derrington I. M.; Laszlo A. H.; Langford K. W.; Hopper M. K.; Gillgren N.; Pavlenok M.; Niederweis M.; Gundlach J. H. Nat. Biotechnol. 2012, 30, 349. [DOI] [PMC free article] [PubMed] [Google Scholar]
- Blanco L.; Bernad A.; Lázaro J. M.; Mart i n G.; Garmendia C.; Salas M. J. Biol. Chem. 1989, 264, 8935. [PubMed] [Google Scholar]
- Blanco L.; Salas M. J. Biol. Chem. 1996, 271, 8509. [DOI] [PubMed] [Google Scholar]
- Salas M.; Blanco L.; Lázaro J. E. M.; de Vega M. IUBMB Life 2008, 60, 82. [DOI] [PubMed] [Google Scholar]
- Morin J. A.; Cao F. J.; Lázaro J. M.; Arias-Gonzalez J. R.; Valpuesta J. M.; Carrascosa J. L.; Salas M.; Ibarra B. Proc. Natl. Acad. Sci. U. S. A. 2012, 109, 8115. [DOI] [PMC free article] [PubMed] [Google Scholar]
- de Vega M.; Blanco L.; Salas M. J. Mol. Biol. 1999, 292, 39. [DOI] [PubMed] [Google Scholar]
- Garmendia C.; Bernad A.; Esteban J. A.; Blanco L.; Salas M. J. Biol. Chem. 1992, 267, 2594. [PubMed] [Google Scholar]
- Esteban J. A.; Salas M.; Blanco L. J. Biol. Chem. 1993, 268, 2719. [PubMed] [Google Scholar]
- Esteban J. A.; Soengas M. S.; Salas M.; Blanco L. J. Biol. Chem. 1994, 269, 31946. [PubMed] [Google Scholar]
- Benner S.; Chen R. J. A.; Wilson N. A.; Abu-Shumays R.; Hurt N.; Lieberman K. R.; Deamer D. W.; Dunbar W. B.; Akeson M. Nat. Nanotechnol 2007, 2, 718. [DOI] [PMC free article] [PubMed] [Google Scholar]
- Akeson M.; Branton D.; Kasianowicz J. J.; Brandin E.; Deamer D. W. Biophys. J. 1999, 77, 3227. [DOI] [PMC free article] [PubMed] [Google Scholar]
- Garalde D. R.; Simon C. A.; Dahl J. M.; Wang H.; Akeson M.; Lieberman K. R. J. Biol. Chem. 2011, 286, 14480. [DOI] [PMC free article] [PubMed] [Google Scholar]
- Dahl J. M.; Wang H.; Lázaro J. M.; Salas M.; Lieberman K. R. J. Biol. Chem. 2014, 289, 6350. [DOI] [PMC free article] [PubMed] [Google Scholar]
- Bernad A.; Blanco L.; Lázaro J. M.; Martin G.; Salas M. Cell 1989, 59, 219. [DOI] [PubMed] [Google Scholar]
- de Vega M.; Lázaro J. M.; Salas M.; Blanco L. EMBO J. 1996, 15, 1182. [PMC free article] [PubMed] [Google Scholar]
- Soengas M. S.; Esteban J. A.; Lázaro J. M.; Bernad A.; Blasco M. A.; Salas M.; Blanco L. EMBO J. 1992, 11, 4227. [DOI] [PMC free article] [PubMed] [Google Scholar]
- Truniger V.; Lázaro J. M.; Salas M.; Blanco L. EMBO J. 1996, 15, 3430. [PMC free article] [PubMed] [Google Scholar]
- Henrickson S. E.; Misakian M.; Robertson B.; Kasianowicz J. J. Phys. Rev. Lett. 2000, 85, 3057. [DOI] [PubMed] [Google Scholar]
Associated Data
This section collects any data citations, data availability statements, or supplementary materials included in this article.