

Abstract
OBJECTIVES
To improve the construct validity of self-reported fatigue by establishing a formal hierarchy of scale items and to determine whether such a hierarchy could be maintained across time (aged 75–80), sex, and nationality.
DESIGN
Cohort study.
SETTING
Two Nordic urban locations: Jyväskylä, Finland, and Glostrup, Denmark.
PARTICIPANTS
Baseline (1989/90) consisted of a random sample of citizens of Finland or Denmark born in 1914 (n = 837). At 5-year follow-up, excluding those lost to follow-up and with baseline disability resulted in a sample of n = 690.
MEASUREMENTS
The Mobility-Tiredness (Mob-T) Scale is a six-item scale that requires subjects to self-report on whether they become tired performing mobility-related tasks. Employing item response theory, an attempt was made to enhance construct validity by confirming a hierarchy of mobility-related fatigue.
RESULTS
A formal hierarchy of fatigue tasks, maintained across time, was established using the revised Mob- T Scale. At age 75, the scalability statistics were a homogeneity coefficient (H) of 0.80, of 3.9% and an HT value of 0.66. The corresponding figures at age 80 were 0.75, 6.9% and 0.59. The property of invariant item ordering was maintained across subgroups based on sex and nationality.
CONCLUSION: Establishing a formal hierarchy at age 75 allowed which tasks were most debilitating to be identified more clearly and the individual’s “distance” from these tasks to be gauged. Because it was possible to confirm that the item hierarchy was maintained across time (aged 75–80), researchers or clinicians can be more confident that performance over time is the result of real change and has less to do with measurement error.
Keywords: mobility-related fatigue, task intensity, scale validation
Definitions of fatigue can vary between studies and between investigators, with reviews using fatigue interchangeably with exhaustion and tiredness.1 Fatigue is an important construct within gerontology, with some evidence supporting increasing levels with age.2,3 More-substantial evidence exists for fatigue’s association with age-related conditions of functional limitation and disability, 4 as well as mortality.5 Fatigue or exhaustion is also one of five markers used to define the frailty syndrome.6
Measuring fatigue through self-report is challenging because of its multidimensional nature, often including physical, cognitive, and affective factors. More generally, self-report measures have been criticized for drawbacks relating to weak validity and sensitivity to change,7 but modern test theory can be employed to reduce the relevance of such concerns, for instance, requiring more stringent assumptions relating to how a construct or ability is defined. This study examined the psychometric properties of the self-report Mobility-Tiredness (Mob-T) Scale8 under conditions of nonparametric item response theory. The Mob-T Scale was designed to measure mobility-related fatigue in older adults, and has been shown to be associated with onset of functional limitations,9 disability,10 and mortality.11 Reliability tests have indicated agreement ranging from 94.3% to 98.3% and kappa values from 0.72 to 0.88 for the included items on intra- and interrater tests.12 With the use of Mokken Scaling,13 a nonparametric item response theory model, the objective of this study was to further enhance construct validity of the Mob-T Scale by formally confirming a hierarchy of decline (invariant item ordering (IIO)). To establish IIO, the Mob-T Scale was scrutinized in terms of four Mokken Scaling assumptions: unidimensionality, local independence, monotone homogeneity, and double monotonicity.
METHODS
Sample
This was an observational study that analyzed the baseline and 5-year follow-up data of the Nordic Research on Aging Study. The study design has been published in detail else-where.14 The original study population (n = 835, 59% women) consisted of a random sample of 75-year-old persons living in Glostrup, a suburban area of Copenhagen, Denmark (n = 480), and of all 75-year-old citizens living in Jyväskylä, Finland (n = 355). Excluding those lost to follow-up and baseline disability (8%) resulted in a sample of 690 subjects. Sample characteristics are presented in Table 1. At the 5-year follow-up (age 80), 108 subjects had mobility limitation or disability; 119 subjects had died (aged 76–80) before follow-up. Fifty-three percent of subjects (n = 293) were still alive at age 83 (at the end of the study).
Table 1.
Participant Characteristics (N = 690)
| Characteristic | Value |
|---|---|
| Female (%) | 59 |
| Danish (%) | 57 |
| Finnish (%) | 43 |
| Subjects living alone (%) | 44 |
| Current smoker (%) | 23 |
| High income (%) | 25 |
| Body mass index, hg/m2, mean 3 SD | 26 ± 4.1 |
| Disabled (%) | 8 |
| Time to walk 10 min at maximum pace, min, mean 3 SD | 7 ± 4.6 |
| Grip strength, n, mean 3 SD | 320.8 ± 117.5 |
| Depressive symptoms, mean 3 SD (range 0–60) | 11 ± 8.6 |
| Diseases (%) | |
| 0 | 71 |
| 1–4 | 29 |
| Raven’s Matrices, mean 3 SD | 16 ± 4 |
SD = standard deviation.
Predictor Variable
Self-reported fatigue was measured using the Mob-T Scale,8 which asks whether participants felt tired after transferring from a bed or chair, walking indoors, getting outdoors, walking outdoors in nice weather, walking outdoors in poor weather, and climbing stairs. The scale counts dichotomous response options for each task: presence or absence of tiredness. Fatigue and tiredness on individual tasks were summed for a total fatigue score (range 0–6), with higher scores indicating greater fatigue.
Dependent Variable
Outcome measures were mortality and a combined measure of physical performance (mobility limitation) and disability—poor physical performance, self-reported disability, or both. Disability was defined as unable to or difficulty with four activities of daily living: bathing, dressing, walking inside the house, and transferring from a bed or chair.15 Poor functional status was assessed according to maximal walking speed, a 10-min test performed in the laboratory corridor and timed using a stopwatch.16 Poor performance was quantified as 1.1 m/s or less. This method of combining self-reported disability with poor performance in physical function into a single outcome variable has been used previously in estimates of healthy life expectancy.17
Covariates
Income
Income was dichotomized as low (only compulsory old age pension) versus high (both compulsory old age pension and other income sources). Number of chronic diseases was measured in connection with the medical examination by asking an open-ended question: “Do you suffer from any long-standing illness?” If the answer was positive, further information was collected on the medical diagnosis, type, duration, and location of the disease. Based on this information, a physician coded relevant diagnoses for each participant in accordance with the International Classification of Diseases, 8th Revision. Muscular fitness was assessed according to maximum isometric handgrip strength (Jamar dynamometer; Sammons Preston Rolyan, Chicago, IL) measured in the dominant hand in a sitting position and adjusted for height. The presence of depressive symptoms was assessed using the Center for Epidemiologic Studies Depression Scale (range 0–60). Cognitive ability was measured using Raven’s Progressive Matrices.18 Raven’s Matrices includes 60 nonverbal items (performance was number of correct responses) thought primarily to assess inductive reasoning ability.
Statistical Analyses
The items from the Mob-T Scale were examined using the Mokken Scaling Procedure (MSP5 for windows; iec ProGAMMA, Groningen, the Netherlands), a nonparametric hierarchical scaling method based on the principles of item response theory, which was used to confirm a hierarchy of functional status and to determine the discriminatory power of each item in the scale. The former objective will allow for the identification of varying levels of item or task severity, and the latter will inform researchers as to which items are most closely related to the clinical dimension of interest.
The Mokken procedure can be separated into two levels of analysis: monotone homogeneity and double monotonicity.13 Monotone homogeneity is based on three fundamental assumptions: unidimensionality, monotonicity, and local independence. If these assumptions are met, it can be said that all item pairs are nonnegatively correlated for all subgroups of subjects and all subsets of items and that, ultimately, the sum score of items can be used to order individuals on the latent trait (e.g., fatigue).19 Hi is a scaling coefficient, based on Loevinger’s (1948) homogeneous test, used to quantify adherence to monotone homogeneity for a single item. The item coefficient of scalability is defined according to the number of “errors” in response patterns involving item i divided by errors defined in terms of the perfect scalogram structure.20 In a perfect Guttman scalogram subjects give positive responses to items represented to the left of their position (the “easier” items) and negative response to items to the right (the “more difficult” items).21 This coefficient Hi may be interpreted as an index of discrimination, reflecting the association between item i and the latent construct. Mokken scaling also provides an H coefficient for the total set of items, which can be viewed as a weighted average of all item H coefficients. 13 Higher values for Hi and H imply fewer violations and thus a better scale. A rule of thumb is that a scale is considered to be weak if H is between 0.30 and 0.40, medium if H is between 0.40 and 0.50, and strong if H is 0.50 or greater.
It is possible to add a fourth assumption leading to a stronger Mokken model—double monotonicity. If this final assumption is met, item hierarchy or IIO is confirmed. The IIO property goes beyond merely ordering subjects according to popularity or mean score. A previous study22 indicated that it would be an aggregation error to infer from mean item ordering (group level) that the item hierarchy holds for each individual respondent. The criteria for IIO are met when the percentage of negative coefficients at the level of the individual subjects, denoted (i. e., transposed homogeneity coefficient, person a), is less than 10% and the coefficient for total set of subjects (HT) is at least 0.30.23 Criteria values can also be used as general guidelines to investigate the assumptions of double monotonicity. For each item, the diagnostic value combines the H coefficient, the frequency and size of the violations, and their significance.24 A criteria value of 0 indicates perfectly nonintersecting items, and a value greater than 80 is a good indication that an item has violated the double monotonicity assumption.
RESULTS
Construct Validity
The walking outdoors in poor weather item violated the assumption of local independence, and the transferring from a bed or chair item had high criteria values, so it was decided to replace them with two other tasks—tiredness when washing or dressing the lower body. The scaling properties of this slightly modified scale are presented in Figure 1. A single scale with ρ = 0.90 was obtained; ρ reflects scale reliability and is an internal consistency coefficient comparable to the Cronbach correlation coefficient. 25 The obtained set H value of 0.80 for these six items indicates a strong scale, well beyond the 0.50 standard. The criterion for item hierarchy or IIO was met, because the percentage of negative coefficients at the level of the individual subjects ( ) was less than 10% (3.9%) and the coefficient for total set of subjects (HT) was 0.66, with a minimum requirement of 0.30.22 The task with the lowest item H value was dressing the lower body (0.70), indicating that this item has the least in common with the other items or the construct of mobility.
Figure 1.
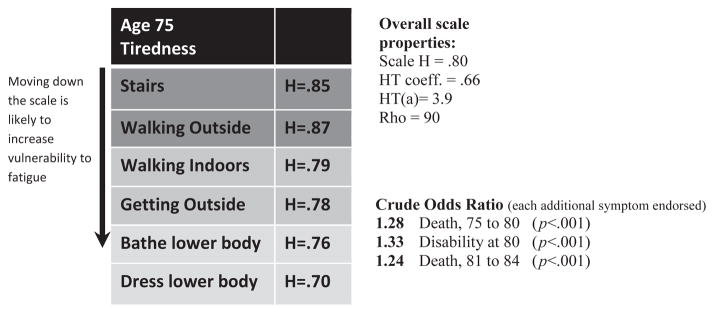
Reporting item intensity (n = 690). H coefficients in the scale represent item discriminatory power. The arrow along the scale reflects the hierarchical nature of the scale.
To confirm that Mob-T items were not biased toward common or relevant subgroups of the population, additional rounds of Mokken scaling were performed according to sex, nationality, and time. The hierarchy was maintained according to sex and nationality. For women, ρ reliability was 0.90, with a set H value of 0.82, of 3.8%, and a coefficient for total set of subjects (HT) of 0.66. For men, ρ reliability was 0.92, with a set H value of 0.82, of 5.9%, and HT of 0.69. For the Finnish subgroup, ρ reliability was 0.81, with a set H value of 0.63, of 6.4%, and HT of 0.56. For the Danish subgroup, ρ reliability was 0.94, with a set H value or 0.89, of 5.6%, and HT of 0.80.
The results of the across time Mokken analysis is presented in Table 2. Again, as with sex and nationality, the IIO was maintained. For Time 2 (age 80), reliability was slightly lower, at 0.88, with a set H value of 0.75, of 7.0%, and HT of 0.59. As seen from Table 2, there were modest changes in means over time, although there was a shift in the Hi coefficients, with the highest value shifts from stairs (H = 0.88) at age 75 to washing lower body (H = 0.78). The coefficient values for age 75 in Figure 1 differ from age 75 in Table 2 because of changes in the sample. The sample in Table 2 is smaller because of missing values and the exclusion of 230 subjects who died before testing at age 80.
Table 2.
Item Hierarchy Across Time
| Item | Mean | Item H | Z |
|---|---|---|---|
| Aged 75 | |||
| Walk on stairs | 1.52 | 0.88 | 23.67 |
| Walk outdoors | 1.62 | 0.86 | 26.96 |
| Walk indoors | 1.73 | 0.79 | 26.04 |
| Get outdoors | 1.77 | 0.78 | 25.01 |
| Wash lower body | 1.89 | 0.78 | 20.32 |
| Dress lower body | 1.91 | 0.67 | 16.12 |
| Scale H | 0.81 | ||
| Age 80 | |||
| Walk on stairs | 1.58 | 0.71 | 22.29 |
| Walk outdoors | 1.59 | 0.77 | 24.56 |
| Walk indoors | 1.73 | 0.76 | 25.48 |
| Get outdoors | 1.78 | 0.76 | 24.86 |
| Wash lower body | 1.89 | 0.78 | 21.01 |
| Dress lower body | 1.90 | 0.62 | 18.46 |
| Scale H | 0.75 | ||
Statistics were HT = 0.69, , and ρ = 90 for the 75-year-old group and HT = 0.59, , and ρ = 88 for the 80-year-old group.
Associations with Disability and Mortality
After the inclusion of covariates, the results of multinomial logistic regression indicated the following; with each additional fatigue symptom endorsed at baseline subjects were 24% more likely than subjects alive at age 84 (n = 299, 45%) to die from age 75 to 80 (odds ratio (OR) = 1.24, 95% confidence interval (CI) = 1.09–1.39, P = .001), 29% more likely to be disabled at age 80 (OR = 1.29, 95% CI = 1.14–1.40, P < .001), and 19% more likely to die from age 81 to 84 (OR 1.19, 95% CI = 1.04–1.37, P = .01). Examining the predictive power of the sum score for the original Mob-T Scale (transferring from chair or bed, walking outdoors in poor weather not replaced by washing and dressing lower body) revealed only modest reductions of effect size for the categories of death from aged 75 to 80 and disability at age 80—maximum of 3% points. The original Mob-T Scale appears to have less sensitivity for risk of death beyond age 80 (6–8 years after baseline), with the effect size being reduced from an OR of 1.19 to 1.14 (P = .048).
DISCUSSION
To the best of the knowledge of the authors, this is the first study to establish a formal hierarchy of fatigue in a population of healthy older adults. Mokken Scaling–based transformations allow for items to be ranked unequivocally based on item intensity, ranking items from easiest to most difficult.26 Establishing item intensity at age 75 enabled the individual’s “distance” from a high-risk zone to be gauged. A fatigue scale revised in this manner more closely resembles an instrument of fatigability, with each step on the hierarchy of tasks requiring greater intensity. The phenotype of fatigability was proposed to refine fatigue assessment by characterizing the relationship between self-reported fatigue and the level of activity with which the fatigue is associated.1
The walking outdoors in poor weather item violated the assumption of local independence, indicating that, for each subgroup of subjects with the same latent trait value (level of fatigue), all covariance between item scores is not zero.27 Also, the transferring from a bed or chair item had high Crit values. These findings are consistent with a previous validation study (using Rasch analysis) conducted on the Mob-T that found item bias according to nationality28 and violation of local independence.8 It is likely that interviewer error caused some of the observed item bias; the Glostrupand Jyväskylä interviewers differed in educational and clinical backgrounds, and training programs may not have been sufficiently standardized.29 Finally, the transferring from a bed or chair item may have introduced measurement error because of the twofold nature of the question. The poorly fitting items were replaced with the washing lower body and dressing lower body tasks. These two tasks would appear to have poor face validity with regard to mobility and may be linked more closely with trunk impairment or balance problems, but previous findings have shown that mobility performance in healthy older adults is significantly associated with isometric trunk extension strength30 or endurance in trunk extension.31 Furthermore, in older adults, it has been observed that mobility-related fatigue is associated with maximum walking speed, with body extension strength identified as an underlying factor to explain the association.9
In addition to establishing item difficulty at baseline, this study confirmed that the item hierarchy was maintained across time (aged 75–80), allowing for change in fatigue to be assessed more accurately. Thus, change in person performance has to do with the individual’s ability and less to do with an error in measurement. By scrutinizing the Mob-T Scale using item response theory methodology, some of the criticisms concerning the validity of self-report measures were addressed, as well as their effectiveness in evaluating change over time.
Using a revised Mob-T Scale, its predictive value for functional limitation and disability, as well as mortality, was demonstrated. It was possible to show, excluding subjects with baseline disability, that with every additional symptom endorsed, the odds of death from age 75 to 80 increased 24%, the odds of disability 29%, and the odds of death 6 to 8 years after baseline 19%. These findings were robust, with P ≤ .01. The results include adjustments for disease, cognitive ability, sex, depressive symptoms, income, muscle strength, smoking status, living alone, and BMI.
It is likely that the variables frequently used to assess exhaustion in older adults (“I felt that everything I did was an effort and I could not get going”) may have been chosen in part because of their availability, yet they have come to represent a criterion standard of sorts for defining exhaustion, principally in relation to the frailty syndrome, but the face validity of such variables has been recently called into question.32 The current manuscript proposes that mobility-related fatigue may be a more-apt indicator of exhaustion in older adults, particularly when the scale can be shown to operate along a continuum. It may be that reports of mobility fatigue present with stronger face validity for exhaustion and convergent validity for aerobic capacity than reports relating to, for example, “getting going.” The fact that aerobic capacity is often measured using a treadmill further reinforces this point. Future directions for the use of the Mob-T Scale should include direct comparison with aerobic capacity measures, such as maximum oxygen uptake.
Further research is needed to determine how the scale will function in a U.S. sample. The weakest part of the scale occurs at the interval between walking indoors and getting outside. That is, if the hierarchy is to fail, it will most likely be with a reversal of these two items, although the current scaling properties are well beyond the minimum requirements of Mokken scaling.
In conclusion, fatigue is a symptom that older persons, especially those with chronic diseases, frequently experience. Fatigue is also one of five markers used to define the frailty syndrome. In this project, item response theory was used to establish a formal hierarchy of fatigue for six mobility-related tasks. This revised measure was free of differential item functioning across sex, nationality, and time, with time allowing for more-precise change scores.
Acknowledgments
Sponsor’s Role: The funding body played no role in the formulation of the design, methods, subject recruitment, data collection, analysis, or preparation of this manuscript.
Funding was provided by the University of Copenhagen’s Center for Healthy Aging and the Nordea-foundation, the Danish Medical Research Council.
Footnotes
Conflict of Interest: All authors report no financial or personal conflicts of interest.
Author Contributions: RF: conception and design, drafting and analyses. ELM: conception and design, critical revisions related to intellectual content. TR: critical revisions, acquisition of data. KA: conception and design, critical revisions, acquisition of data.
References
- 1.Eldadah BA. Fatigue and fatigability in older adults. PM R. 2010;2:406– 413. doi: 10.1016/j.pmrj.2010.03.022. [DOI] [PubMed] [Google Scholar]
- 2.Lerdal A, Wahl A, Rustoen T, et al. Fatigue in the general population: A translation and test of the psychometric properties of the Norwegian version of the Fatigue Severity Scale. Scand J Public Health. 2005;33:123–130. doi: 10.1080/14034940410028406. [DOI] [PubMed] [Google Scholar]
- 3.Wick JY, LaFleur J. Fatigue: Implications for the elderly. Consult Pharm. 2007;22:566–570. doi: 10.4140/tcp.n.2007.566. [DOI] [PubMed] [Google Scholar]
- 4.Vestergaard S, Nayfield S, Patel K, et al. Fatigue in a representative population of older persons and its association with functional impairment, functional limitation and disability. J Gerontol A Biol Sci Med Sci. 2009;64A:76–82. doi: 10.1093/gerona/gln017. [DOI] [PMC free article] [PubMed] [Google Scholar]
- 5.Hardy SE, Studenski SA. Fatigue predicts mortality in older adults. J Am Geriatr Soc. 2008;56:1910. doi: 10.1111/j.1532-5415.2008.01957.x. [DOI] [PMC free article] [PubMed] [Google Scholar]
- 6.Fried LP, Tangen CM, Walston J, et al. Cardiovascular Health Study Collaborative Research Group Frailty in older adults: Evidence for a phenotype. J Gerontol A Biol Sci Med Sci. 2001;56A:M146–M156. doi: 10.1093/gerona/56.3.m146. [DOI] [PubMed] [Google Scholar]
- 7.Guralnik JM, Branch LG, Cummings SR, et al. Physical performance measures in aging research. J Gerontol. 1989;44:M141–M146. doi: 10.1093/geronj/44.5.m141. [DOI] [PubMed] [Google Scholar]
- 8.Avlund K, Kreiner S, Schultz-Larsen K. Functional ability scales for the elderly. A validation study. Eur J Public Health. 1996;6:35–42. [Google Scholar]
- 9.Mänty M, Mendes de Leon CF, Rantanen T, et al. Mobility-related fatigue, walking speed, and muscle strength in older people. J Gerontol A Biol Sci Med Sci. 2012;67A:523–529. doi: 10.1093/gerona/glr183. [DOI] [PubMed] [Google Scholar]
- 10.Avlund K, Damsgaard MT, Sakari-Rantala R, et al. Tiredness in daily activities among non-disabled old people as determinant of onset of disability. J Clin Epidemiol. 2002;55:965–973. doi: 10.1016/s0895-4356(02)00463-8. [DOI] [PubMed] [Google Scholar]
- 11.Avlund K, Vass M, Hendriksen C. Onset of mobility disability among community- dwelling old men and women The role of tiredness in daily activities. Age Ageing. 2003;32:579–584. doi: 10.1093/ageing/afg101. [DOI] [PubMed] [Google Scholar]
- 12.Avlund K, Thudium D, Davidsen M, et al. Are self-ratings of functional ability reliable? Scand J Occup Ther. 1995;2:10–16. [Google Scholar]
- 13.Mokken RJ, Lewis C. A nonparametric approach to the analysis of dichotomous item responses. Appl Psychol Meas. 1982;6:417–430. [Google Scholar]
- 14.Kauppinen M, Davidsen M, Valter S. Design, material and methods in the NORA study. Nordic Research on Ageing Aging Clin Exp Res. 2002;14:5–9. [PubMed] [Google Scholar]
- 15.Gill TM, Allore HG, Holford TR, et al. Hospitalization, restricted activity, and the development of disability among older persons. JAMA. 2004;29:2115–2124. doi: 10.1001/jama.292.17.2115. [DOI] [PubMed] [Google Scholar]
- 16.Aniansson A, Rundgren A, Sperling L. Evaluation of functional capacity in activities of daily living in 70-year-old men and women. Scand J Rehabil Med. 1980;12:145–154. [PubMed] [Google Scholar]
- 17.Jagger C, Gillies C, Moscone F, et al. Inequalities in healthy life years in the 25 countries of the European Union in 2005: A cross-national meta-regression analysis. Lancet. 2008;372:2124–2131. doi: 10.1016/S0140-6736(08)61594-9. [DOI] [PubMed] [Google Scholar]
- 18.Raven JC, Court JH, Raven J. Manual for Raven’s Progressive Matrices and Vocabulary Scales. London: Lewis; 1977. [Google Scholar]
- 19.vanSchuur WH. Mokken Scale analysis: Between the Guttman Scale and Parametric Item Response Theory. Polit Anal. 2003;11:139–163. [Google Scholar]
- 20.Roskam EE, van den Wollenberg AL, Jansen PGW. The Mokken scale: A critical discussion. Appl Psychol Meas. 1986;10:265–277. [Google Scholar]
- 21.Guttman L. The basis for scalogram analysis. In: Stouffer SA, Guttman L, Suchman EA, Lazarsfeld PF, Star SA, Claussen JA, editors. Measurement and Prediction. Princeton: Princeton University Press; 1950. pp. 60–90. [Google Scholar]
- 22.Ligtvoet R, van der Ark LA, Marvelde JM, et al. Investigating an invariant item ordering for polytomously scored items. Educ Psychol Meas. 2010;40:578–595. [Google Scholar]
- 23.Roorda LD, Roebroeck ME, van Tilburg T, et al. Measuring activity limitations in climbing stairs: Development of a hierarchical scale for patients with lower-extremity disorders living at home. Arch Phys Med Rahabil. 2004;85:967–971. doi: 10.1016/j.apmr.2003.11.018. [DOI] [PubMed] [Google Scholar]
- 24.Luinge MR, Post WJ, Wit HP, et al. The ordering of milestones in language development for children from 1 to 6 years of age. J Speech Lang Hear Res. 2006;49:923–940. doi: 10.1044/1092-4388(2006/067). [DOI] [PubMed] [Google Scholar]
- 25.Moorer P, Suurmeijer T. A study of the unidimensionality and cumulativeness of the MOS Short-form General Health Survey. Psychol Rep. 1994;74:467–470. doi: 10.2466/pr0.1994.74.2.467. [DOI] [PubMed] [Google Scholar]
- 26.Martin M, Kosinski M, Bjorner JB, et al. Item response theory methods can improve the measurement of physical function by combining the modified health assessment questionnaire and the SF-36 physical function scale. Qual Life Res. 2007;16:647–660. doi: 10.1007/s11136-007-9193-5. [DOI] [PubMed] [Google Scholar]
- 27.Sijtsma K, Emons WHM, Bouwmeester S, et al. Nonparametric IRT analysis of quality of life scales and its application to the World Health Organization Quality of Life scale (WHOQOL-Bref) Qual Life Res. 2008;17:275–290. doi: 10.1007/s11136-007-9281-6. [DOI] [PMC free article] [PubMed] [Google Scholar]
- 28.Avlund K, Era P, Davidsen M, et al. Item bias in self-reported functional ability among 75-year-old men and women in three Nordic localities. Scand J Soc Med. 1996;3:206–217. doi: 10.1177/140349489602400313. [DOI] [PubMed] [Google Scholar]
- 29.Teresi JA, Cross PS, Golden RR. Some applications of latent trait analysis to the measurement of ADL. J Gerontol. 1989;44:196–201. doi: 10.1093/geronj/44.5.s196. [DOI] [PubMed] [Google Scholar]
- 30.Sakari-Rantala R, Era P, Rantanen T, et al. Associations of sensory-motor functions with poor mobility in 75- and 80-year-old people. Scand J Rehabil Med. 1998;30:121–127. doi: 10.1080/003655098444237. [DOI] [PubMed] [Google Scholar]
- 31.Suri P, Kiely DK, Leveille SG, et al. Trunk muscle attributes are associated with balance and mobility in older adults: A pilot study. PM R. 2009;1:916–924. doi: 10.1016/j.pmrj.2009.09.009. [DOI] [PMC free article] [PubMed] [Google Scholar]
- 32.Boyd CM, Xue QL, Simpson CF, et al. Frailty, hospitalization, and progression of disability in a cohort of disabled older women. Am J Med. 2005;118:1225–1231. doi: 10.1016/j.amjmed.2005.01.062. [DOI] [PubMed] [Google Scholar]