Abstract
Background
Chronic alcohol intake affects liver function and causes hepatic pathological changes. It has been shown that peroxisome proliferator-activated receptor α (PPARα)-null mice developed more pronounced hepatic changes than wild type (WT) mice after chronic exposure to a diet containing 4% alcohol. The remarkable similarity between the histopathology of ALD in Ppara-null model and in humans, and the fact that PPARα expression and activity in human liver are less than one-tenth of those in WT mouse liver make Ppara-null a good system to investigate ALD.
Methods
In this study, the Ppara-null model was used to elucidate the dynamic regulation of PPARα activity during chronic alcohol intake. Hepatic transcriptomic and metabolomic analyses were used to examine alterations of gene expression and metabolites associated with pathological changes. The changes triggered by alcohol consumption on gene expression and metabolites in Ppara-null mice were compared with those in wild-type mice.
Results
The results showed that in the presence of PPARα, three major metabolic pathways in mitochondria, namely the fatty acid β-oxidation, the tricarboxylic acid cycle (TCA) and the electron transfer chain, were induced in response to two-month alcohol feeding, while these responses were greatly reduced in the absence of PPARα. In line with the transcriptional modulations of these metabolic pathways, lipidomic profiling showed consistent accumulation of triglycerides in Ppara-null mice, a robust increase of hepatic cholic acid and its derivatives, and a strong induction of fibrogenesis genes exclusively in alcohol-fed Ppara-null mice.
Conclusions
These observations indicate that PPARα plays a protective role to enhance mitochondrial function in response to chronic alcohol consumption by adaptive transcriptional activation and suggest that activation of this nuclear receptor may be of therapeutic value in the treatment of ALD.
Keywords: Ppara-null mice, fibrogenesis, metabolic pathways, transcriptomics, metabolomics
Introduction
Alcoholic liver disease (ALD) is a major cause of morbidity and mortality worldwide. Chronic alcohol intake affects liver function and causes hepatic pathological changes including steatosis, inflammation, cell infiltration, hepatomegaly, fibrosis, and cirrhosis (Lumeng and Crabb, 2001). Patients who consume alcohol chronically develop steatosis due in part to alterations in lipid metabolism (Crabb and Liangpunsakul, 2006) and without intervention may progress to advanced stages of ALD that include fibrosis and cirrhosis (MacSween and Burt, 1986). It is generally accepted that the initial stages of ALD are reversible (Menon et al., 2001), and therefore studies have sought to understand how alcohol consumption regulates the expression and function of enzymes involved in lipid metabolism.
Peroxisome proliferator-activated receptor α (PPARα) is a member of the PPAR family of nuclear receptors and is the target of the widely used lipid lowering fibrate drugs. Studies using PPARα ligands and Ppara-null mice revealed that the physiological role of PPARα is to stimulate fatty acid catabolism under conditions of fasting (Kersten et al., 1999; Desvergne et al., 2004). It is reasonable to assume that the increase in free fatty acid associated with alcohol consumption would activate PPARα and PPARα-dependent fatty acid catabolism. Indeed, expression of PPARα target genes was altered remarkably in the liver during chronic alcohol consumption (Ji et al., 2006; Ma et al., 1993; Wan et al., 2001; Rabinowitz et al., 1991; You et al., 2002; Pignon et al., 1987; Fischer et al., 2003). However, and quite paradoxically, many PPARα target genes are not induced in alcohol-fed rodent models and, in some instances, are negatively regulated (Fischer et al., 2003; Wan et al., 1995; Galli et al., 2001). These findings have made it difficult to draw a clear conclusions on the role of PPARα in ALD development. It is known that rodent models are more resistant to the effects of alcohol as compared to humans. One explanation is the reported differences in the expression levels of PPARα between humans and rodents (Palmer et al., 1998), which implies that alcohol-induced liver injuries in the Ppara-null mouse model may share some similarity to human ALD. Supporting a role for PPARα in protecting against liver damage in rodent models, Nakajima et al (Nakajima et al., 2004) found that when placed on a diet containing 4% alcohol for six months, Ppara-null mice developed hepatic changes with similarities to human ALD (Nakajima et al., 2004; Fang et al., 1994; Masuhara et al., 1996; Diehl, 2002). Notably, alcohol-fed Ppara-null livers presented with hepatomegaly, steatosis, inflammation, and large or swollen mitochondria.
The present study used male Ppara-null mice on the 129/Sv background, and their wild-type (WT) cohorts, continuously fed a 4% alcohol-containing liquid diet. It is known that hepatic fatty acid and acetyl-CoA, required for the TCA cycle in converting α-ketoglutarate to succinyl-CoA, accumulate along with chronic alcohol consumption. The questions of how liver tissue responds to these alcohol-related metabolic challenges, what the pathological consequences are, and if the liver fails to achieve effective responses, remain to be answered. Comparison of alcohol-induced changes in liver tissues from WT and Ppara-null mice was carried out to determine the roles of PPARα in these processes and how the effects of alcohol consumption on liver function deteriorate with deficient PPARα activity. The similarity of these changes with ALD in human is discussed.
Material and Methods
Animals and alcohol treatment
Male 6- to 8-week-old WT and Ppara-null mice (129/Sv strain, Ppara-null stain is carried by the Jackson Laboratory, stock number: 003580. Detailed information on this strain and its recommended control can be found at http://jaxmice.jax.org/strain/003580.html) were pair-fed a liquid diet containing 4% ethanol (Lieber-DeCarli Diet, Dyets, Inc., Bethlehem, PA). Control mice were fed an isocaloric diet supplemented with maltose dextran (Dyets, Inc.). Every time point and condition had at least six mice per group and all mice were preconditioned on the control liquid diet for seven days prior to switching half to the alcohol-containing arm. The mouse studies were approved by the Georgetown University Animal Care and Use Committeein an AAALAC-approved facility.
Microarray analysis
Microarray analysis was carried out by standard procedures as described in the Agilent single-color expression array manual. Four RNA samples from each group were subjected to microarray. The procedures for microarray, data analysis and gene expression validation are provided in detail in the Supplementary file. The microarray data in this study were deposited in NCBI's Gene Expression Omnibus and are accessible through GEO Series accession number GSE54034 (http://www.ncbi.nlm.nih.gov/geo/query/acc.cgi?acc=GSE54034).
Sample preparation for metabolomics/lipidomics profiling
Snap-frozen liver samples (10 mg) were sectioned on dry ice and homogenized in 300 μL of chilled 50% methanol. Equal volumes of chilled 100% acetonitrile were then added to the homogenates, vortexed for 10 seconds, incubated on ice for 15 minutes. Tissue homogenates were then centrifuged at 13,000 rpm for 15 minutes at 4°C. Supernatant was transferred to fresh tubes and dried by speed vacuum. The pellet was resuspended in 100 μL of 50% methanol for metabolomic profiling. The liver extract preparation protocol for lipidomic analyses is derived from (Shi et al., 2012). In brief, snap-frozen liver tissues (10 mg) were homogenized in 300 μL chilled 50% methanol containing trinonadecenoin (TG (19:1/19:1/19:1), with a final concentration of 500 nM. 600 μL of chloroform was added to the homogenates and vortexed for 10 seconds. 300 μL HPLC grade water was then added and vortexed for 10 seconds. The tissue homogenates were centrifuged at 13,000 rpm for 15 minutes at 4 °C. The upper aqueous phase and bottom organic layer were collected into silica tubes, and the white interphase was discarded. Supernatants were air dried by speed vacuum. The residues were reconstituted in 100 μL of 50% methanol for analysis.
Metabolomics and lipidomics profiling by UPLC-QTOFMS and UPLC-QTOFMSE
For metabolomic profiling, a 2 μl sample was injected onto a reverse-phase ACQUITY BEH C18 50 × 2.1 mm 1.7-μm column (Waters Corp, Milford, MA) using an ACQUITY UPLC system (Waters Corp, Milford, MA). Acquity CSH C18 50 × 2.1 mm 1.7-μm column (Waters Corp, Milford, MA) was used for lipidomics profiling by UPLC-QTOFMSE. MSE is a technique by which both precursor and fragment mass spectra are acquired by alternating between high and low collision energy during a single chromatographic run. More details can be found in the Supplementary file.
Data processing and multivariate data analysis
Raw mass spectrometric data were processed using MarkerLynx software (Waters Corp, Milford, MA) to generate a data matrix that consisted of the retention time, m/z value, and the normalized peak area. Statistical analysis and putative ion identification on the post-processed data were conducted utilizing MetaboLyzer (Mak et al., 2013). Lipid ions were validated with the fragmentation provided in MSE results. Metabolic pathway information from KEGG as well as BioCyc was further utilized for creating pathway hit histograms and enrichment significance graphs. The intensity of triglycerides was obtained by using the ChroTool feature in MassLynx. Identities of cholic acid and its derivative were confirmed by comparison of retention time and fragmentation pattern with authentic standards.
Statistical analysis
Experimental values are presented as mean ± SD. Statistical analysis was performed using GraphPad Prism (San Diego, CA). The significance of metabolite intensity and mRNA levels was determined using two-tailed student t-test. P values of less than 0.05 were considered significant.
Results
Inflammation and fibrosis observed in alcohol-fed Ppara-null mice
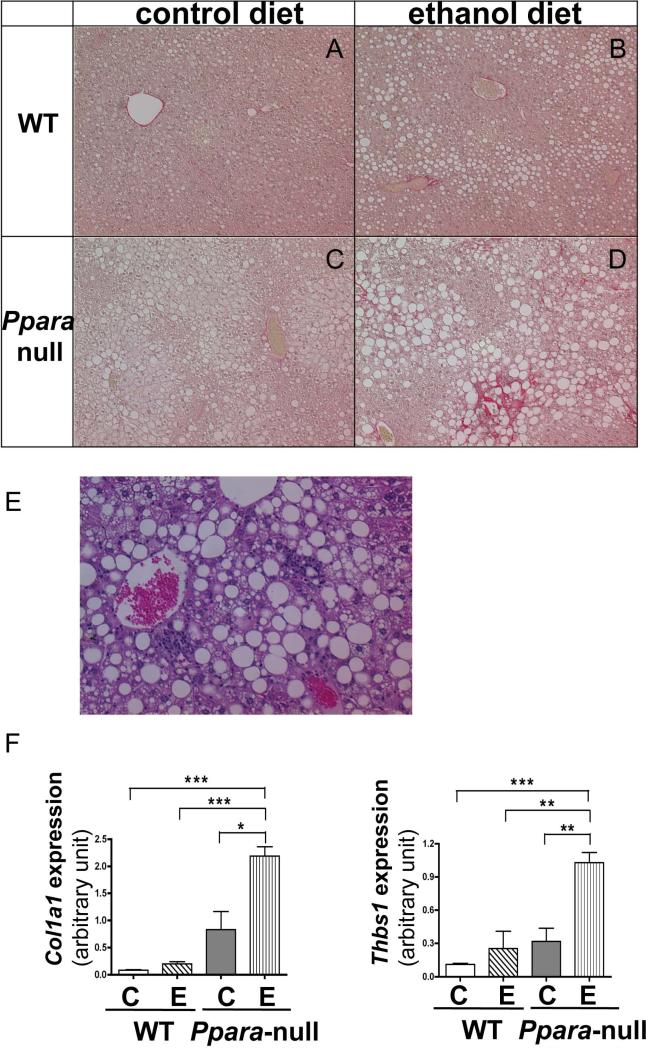
To confirm the efficacy of alcohol treatment on liver disease, histology was performed at one- and six- months of alcohol feeding. Macro- and micro-vesicular fatty deposits were observed in livers of both WT and Ppara-null mice fed alcohol with more severe steatosis in Ppara-null mice.. Remarkable inflammatory cell infiltration was observed exclusively in alcohol-fed Ppara-null mice (Fig. 1E). Sirius red staining revealed evident fibrotic changes in alcohol-fed Ppara-null mice in the four-to six- month alcohol feeding groups, which was not observed in WT mice (Fig. 1A-D). Red staining indicating collagen fibrils was noted in peri-venular regions, and extends into the sinusoids in a peri-cellular fashion. Immunohistochemical staining of α-smooth muscle actin (α-SMA), a molecular marker for activated hepatic stellate cells, also indicated that fibrogenesis progressed exclusively in alcohol-fed Ppara-null mice (Supplementary Figure 1A). Microarray results showed induction of genes involved in inflammatory reaction in alcohol-fed Ppara-null mice (Supplementary Figure 1B). After four-months of alcohol feeding, the expression of Thbs1, a gene encoding a protein that activates TGFβ and leads to hepatic fibrosis development, significantly increased in Ppara-null mice compared with the liquid diet controls. Expression of two genes involved in fibrogenesis, Col1a1 and Col1a2 which encodes the pro-alpha1 and pro-alpha2 chains of type I collagen respectively, increased dramatically in Ppara-null mice as early as two-months of alcohol feeding. The significant induction of Col1a1 and Col1a2 expression persisted in Ppara-null mice for four-month alcohol feeding. The gene expression level changes observed by microarray (Supplementary Fig. 1B) were validated by qRT-PCR (Fig. 1F).
Figure 1.
Fibrosis and inflammatory changes in alcohol-fed Ppara-null mice. Panels A to D: Histologic changes with Sirius red staining in liver of WT and Ppara-null mice fed control or 4% ethanol diet for six months. Red staining indicate pericellular collagen fibrils. WT mice fed a 4% ethanol diet (B) showed no fibrosis. In contrast, Ppara-null mice fed alcohol for the same period (D) displayed pericellular fibrosis. (E) Hematoxylin and eosin staining of liver section from Ppara-null mice fed alcohol for six months indicates inflammatory cell infiltration. (F) Alterations in hepatic mRNA levels of Col1a1 and Thbs1, two genes associated with fibrogenesis, after two-months of alcohol feeding. “C” and “E” represents control and ethanol feeding respectively. qRT-PCR results were normalized with internal control Gapdh. *, **, and *** indicate statistically significant difference with a p value less than 0.05, 0.01, and 0.001 between two groups respectively .
Liver tissue metabolomics profiling analysis
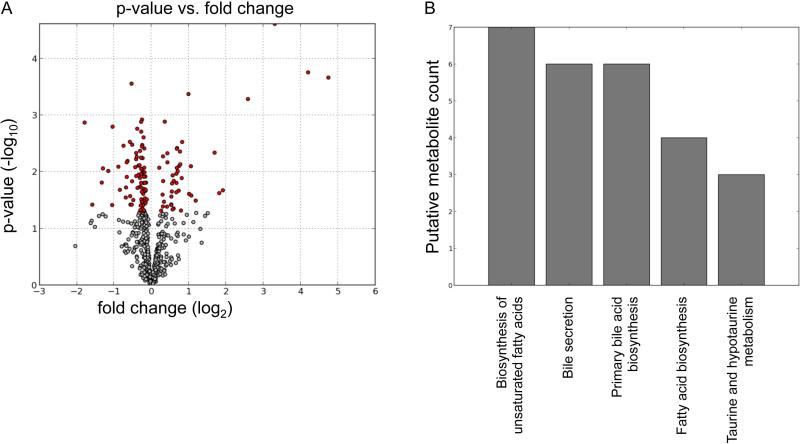
To examine the changes of metabolites during the development of alcohol-induced liver damage, liver tissues were subjected to metabolomics profiling. Statistical analysis of the metabolomics data from control and alcohol-fed Ppara-null mice for two-month feeding revealed statistically significance fold changes of screened ions between control and alcohol-fed mice (Fig. 2A). The red dots are ions with p-values less than 0.05 by Welch's T-test. Putative molecules were designated by screening the accurate mass in metabolite databases, including HMDB, KEGG, LIPIDMAPS, and BioCyc databses. KEGG pathway analysis results indicate the metabolic pathways associated with the metabolites in Fig. 2A which were significantly changed (Fig. 2B). Prominent pathways are those involved in fatty acid biosynthesis and bile acid metabolism.
Figure 2.
Statistical analysis of metabolomic profiling results from control and alcohol-fed Ppara-null mice in ESI negative mode. (A) Volcano plot displays t-test results. Ions labeled in red have significant difference in intensity between control and alcohol-fed Ppara-null mice. (B) KEGG pathway analysis results of the differential ions (red points in panel A).
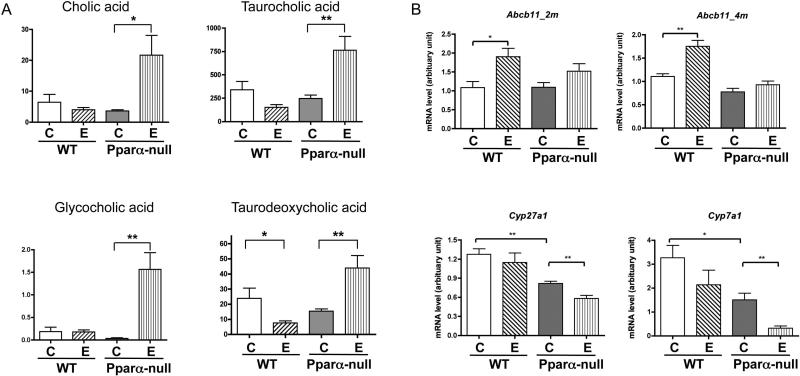
Cholic acid and taurocholic acid were identified as major hits as validated by MS/MS. The fragmentation of these two target ions in liver tissue samples matches that of the standards (Supplementary Fig. 2). There was no significant increase for cholic acid and its three derivatives between control and alcohol-fed mice in the WT strain while striking increases for all four bile acid related metabolites were observed in liver tissue samples from alcohol-fed Ppara-null mice compared to their control liquid diet-fed counterparts. The hepatic levels of mRNAs encoding proteins involved in bile acid synthesis and transport demonstrated that bile acid transporter ATP-binding cassette subfamily B member 11 (Abcb11) located in the liver canaliculus was induced significantly by alcohol feeding in WT but not in Ppara-null mice (Fig. 3B). Expression of mRNAs encoding two of the major enzymes involved in the bile acid biosynthesis, Cyp7a1and Cyp27a1, was significantly decreased in response to alcohol feeding in Ppara-null but not in WT mice.
Figure 3.
Measurements of bile acids and genes involved in bile acids’ synthesis and transport. (A) Levels of hepatic cholic acid and its derivatives in control- and alcohol-fed WT and Ppara-null mice after two-month alcohol feeding. Y-axis represents the UPLC-QTOFMS intensity data with arbitrary units. (B) Hepatic Abcb11, Cyp7a1 and Cyp27a1 mRNA levels after two-month alcohol feeding. “C” and “E” represents control and ethanol feeding respectively. qRT-PCR results were normalized with internal control Gapdh mRNA * p value<0.05, ** p value < 0.01.
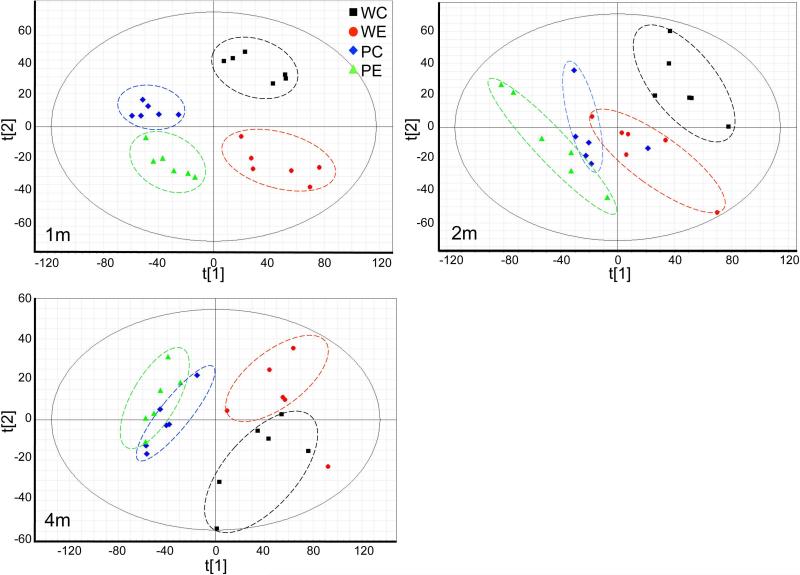
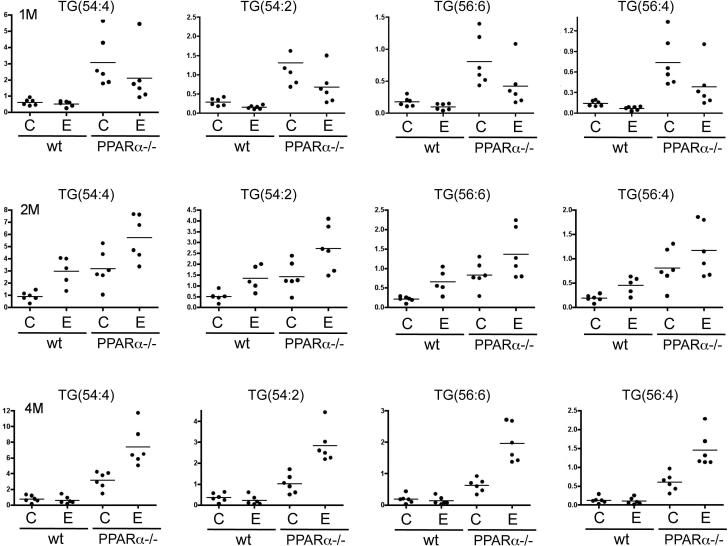
Liver tissue samples also were subjected to lipidomics profiling. Unsupervised principle component analysis (PCA) plots of the lipid signature showed that the hepatic lipidome of Ppara-null and WT mice segregated (Fig. 4). For both genotypes, alcohol treatment also showed clear separation. In the PCA plots of either one or two months treatment groups, the hepatic lipidome from alcohol-fed mice of both genotypes showed a shift in the same direction, which indicates some similarity in the metabolic response to alcohol. It is well characterized that triglycerides are significantly increased in Ppara-null mice due to deficiency of fatty acid β-oxidation compared to WT mice. Levels of multiple triglyceride molecules were determined based on lipidomics profiling. Three time points were examined including the one-, two-, and four-month treatments. For all three time points, triglyceride ions from livers from Ppara-null mice are significantly higher than those of WT mice (Fig. 5). However, the effects of alcohol feeding on triglycerides varied at different time points and the two genotypes. In Ppara-null mice after one month of treatment, triglyceride levels declined, but after two months of treatment, the levels increased and these increases persisted at four months of treatment. In WT mice, the changes in triglyceride levels showed the same trend as those for Ppara-null at one- and two-month treatments. However, by four months of treatment, no significant increase was observed for the triglycerides in alcohol-fed mice when compared to their control diet-fed counterparts, and this is in striking contrast to that in the alcohol-fed mutant mice at this time.
Figure 4.
Multivariate data analysis of hepatic lipidomics profiles from control- and alcohol-fed wt and Ppara-null mice. Principle components analysis (PCA) unsupervised clustering plots for one-month (1M), two-month (2M), and four-month (4M) treatment are shown. In each panel, WC, WE, PC, and PE designate WT control, WT alcohol-fed, Ppara-null control, and Ppara-null alcohol-fed respectively.
Figure 5.
Levels of indicated triglyceride ions after alcohol ingestion. Panels from top to bottom show results from one-month, two-month, and four-month treatment respectively for four groups defined in the Fig. 4 legend. Y-axis represents the ratio of measurement of the specified triglyceride ion to that of the spike-in standard ion, trinonadecenoin (TG(57:3)).
Alteration of mitochondrial metabolic pathways caused by alcohol
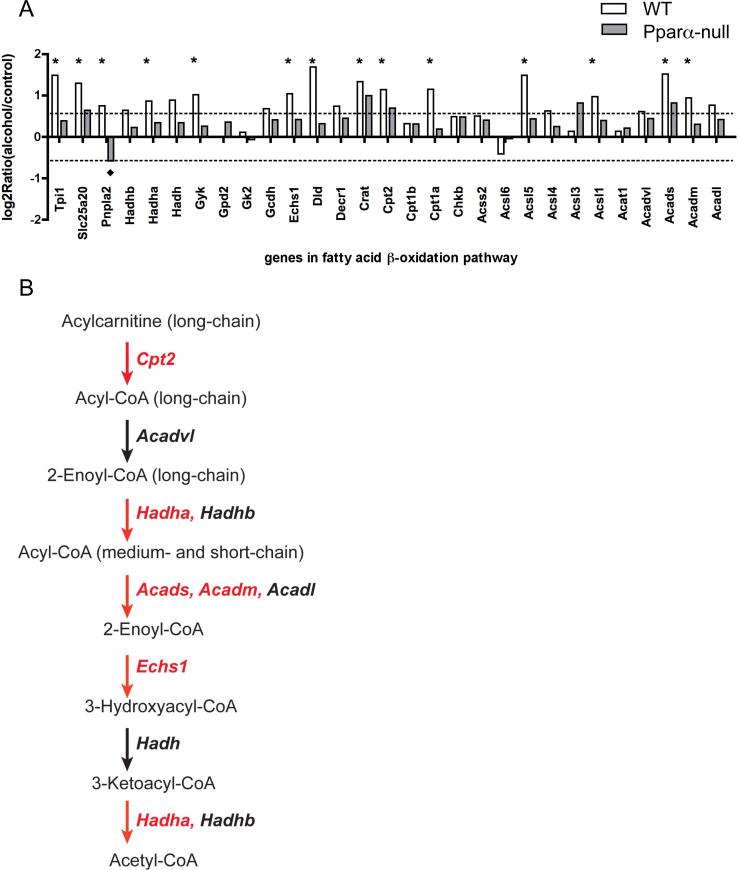
To demonstrate the hepatic role of PPARα in the response to alcohol exposure, and to determine whether fatty acid β-oxidation pathway is modulated, processed liver tissue transcriptomics data from control and alcohol-fed mice were screened for genes in the fatty acid β-oxidation pathway. Most of the genes in the fatty acid β-oxidation pathway were significantly induced after two months of alcohol treatment in WT mice, but most of these genes remained unchanged in alcohol-fed Ppara-null mice compared to control diet fed mice (Figure 6A). The genes labeled with an asterisk are increased more than 1.5 fold, and were statistically significant (p value <0.05) in the two-month alcohol-fed WT mice when compared to control diet-fed mice. A schematic diagram of the central steps of this pathway in Figure 6B displays the roles of these genes in fatty acid β-oxidation pathway. The genes in red indicate that significant induction was observed in livers from two-month alcohol-fed WT mice. A more detailed diagram of fatty acid β-oxidation pathway is shown in Supplementary Fig. 3. Almost all genes in the fatty acid β-oxidation pathway showed increase expression. These genes include members of long-chain acyl-CoA synthetase, Acsl1, Acsl4, and Acsl5; the enzymes and transporters involved in carnitine-mediated fatty acid translocation into mitochondria, Crat, Cpt1a, Cpt2, and Slc25a20; members of acyl-CoA dehydrogenase family, Acadvl, Acadl, Acadm, and Acads; subunits of the mitochondria trifunctional protein catalyzing 3-hydroxyacyl-CoA dehydrogenase, enoyl-CoA hydratase, and long-chain 3-keto-acyl-CoA thiolase activities, Hadha and Hadhb. In contrast to the widespread upregulation of fatty acid β-oxidation genes in WT mice, Ppara-null mice showed little or no modulation of genes in this pathway, such that no statistically significant induction was observed in two-month alcohol-fed Ppara-null mice. Interestingly, a majority of these 29 genes involved in fatty acid β-oxidation showed no difference between control diet and alcohol fed at one-month (Supplementary Fig. 4). In the one-month study, alcohol feeding only induced Tpi1, Hadha, Hadhb, Cpt1b, and Acadvl significantly in wt mice. Taken together, these results suggest that alcohol ingestion does not cause the induction of fatty acid β-oxidation genes immediately and the activation of PPARα and the subsequent upregulation of fatty acid β-oxidation are adaptive effects.
Figure 6.
Alteration of expression of genes involved in fatty acid β-oxidation. (A) The ordinate represents the expression after two months of alcohol relative to control, log2ratio (alcohol-fed/control). The symbols “*” and “◆” indicate statistically significant differences observed in WT and Ppara-null mice respectively. (B) A schematic diagram of central steps of the fatty acid α-oxidation pathway, the gene names for these enzymes are in italic and the ones in red are those showing statistically significant induction (P value < 0.05) in panel A.
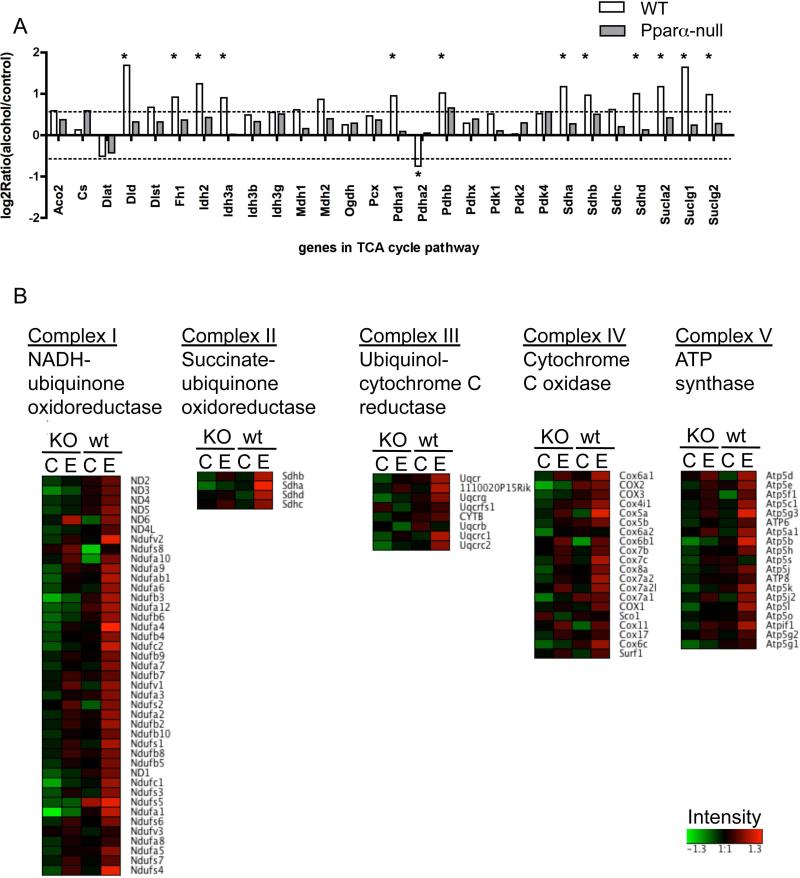
Consistent with the upregulation of the fatty acid β-oxidation pathway, expression levels of major genes in the tricarboxylic acid (TCA) cycle pathway (Fig. 7A) and genes encoding electron transfer chain proteins (Fig. 7B) showed significant increases in two-month alcohol-fed WT mice as well. A diagram of the TCA components with annotation of individual genes is shown in Supplementary Fig. 5. Induced genes in the TCA cycle include three in the pyruvate dehydrogenase complex, Pdha1, Pdhb, and Dld; two isocitrate dehydrogenases, Idh3a and Idh2; α-ketoglutarate dehydrogenase, Dld; all three involved in succinyl-CoA synthesis, Suclg1, Suclg2, and Sucla2; three out of four of the succinate dehydrogenases, Sdha, Sdhb, and Sdhd; and fumarase, Fh1. The genes in the electron transfer chain displayed in Fig. 7B were grouped by Complex I to V. In the alcohol-fed WT group, the genes that encode all five complexes had higher expression than WT controls, while there was no appreciable difference between control and alcohol-fed Ppara-null mice.
Figure 7.
Alteration of expression of genes involved in the TCA cycle (A) and electron transfer chain (B) after 2 m of alcohol exposure. (A) In the upper panel, Y-axis represents Log2Ratio (alcohol-fed/control). Asterisks (*) designate statistically significant differences observed in wt mice, while none of the changes in and Ppara-null mice were significant. (B) The heatmaps of gene intensity of the corresponding electron transfer chain complexes from four experimental groups after 2 m of alcohol: Ppara-null control, Ppara-null alcohol-fed, WT control, and WT alcohol-fed,. The raw intensity data were pre-processed by log-transformed and autoscaled to zero mean with Partek Genomics Suite. Processed intensity data was visualized by Genesis.
To address the question of whether the gene induction observed was an outcome of the upregulation of metabolism in general, alterations in other metabolic pathways were evaluated. As an example the expression levels of genes in the purine metabolism pathway are shown in Supplementary Fig. 6. There was no significant difference among the four experiment groups, which suggests that the gene expression alterations observed in fatty acid β-oxidation, TCA cycle and electron transfer chain were relatively specific effects of alcohol on mitochondrial metabolism, and not coupled with gross alterations of metabolism.
Discussion
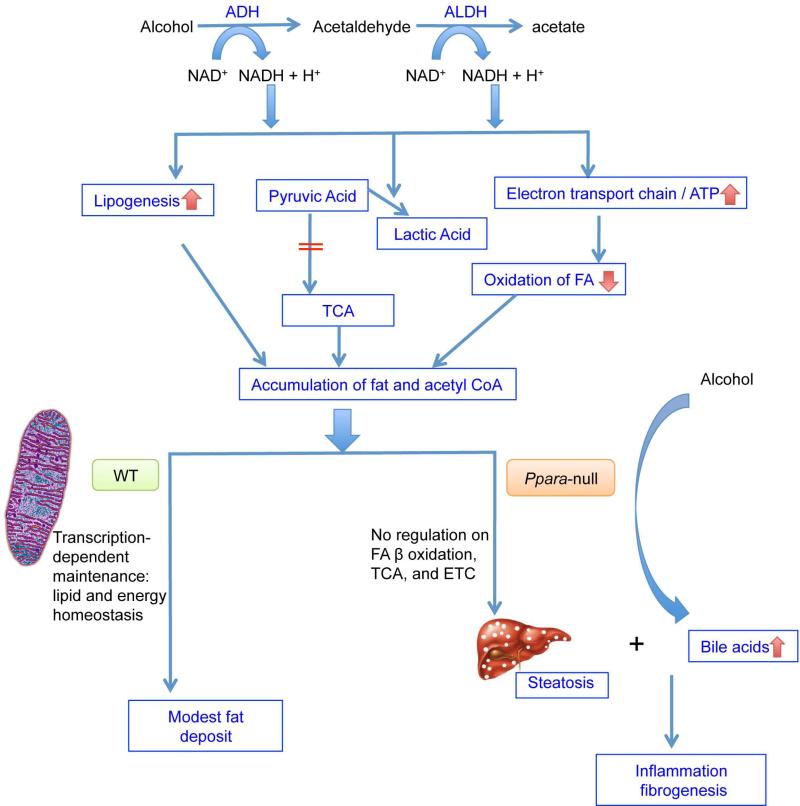
The focus of this study was to assess the role of PPARα in protecting against alcohol-induced liver damage using the 4% alcohol-fed Ppara-null model. By integrating the different metabolomics and transcriptomics responses to alcohol intake in WT and Ppara-null mice, a working model is proposed (Fig. 8). Alcohol is first metabolized by alcohol dehydrogenase (ADH) into acetaldehyde, which is further oxidized to acetic acid by the action of aldehyde dehydrogenase (ALDH). Both reactions consume NAD+ and produce NADH. The change in this redox ratio (NAD+/NADH) results in accumulation of fat and acetyl-CoA by facilitating lipogenesis and downregulation of the TCA cycle and fatty acid β-oxidation. The excessive fat and acetyl-CoA drive the adaptive upregulation of mitochondrial metabolism mediated by PPARα. In the presence of PPARα (WT arm in Fig. 8), genes involved in the fatty acid β-oxidation pathway are induced. The products of β-oxidation, acetyl-CoA and succinyl-CoA, drive the TCA cycle and consequently the increased production of NADH and FADH2 fuels the electron transfer chains. The genes in these two metabolic pathways downstream of fatty acid β-oxidation are also consistently up-regulated. In contrast in the absence of PPARα (PPARα-deficient arm in Fig. 8), the fatty acid β-oxidation pathway, TCA cycle pathway and electron transfer chain fail to be upregulated at the transcriptional level. As a result, severe steatosis develops. In addition to the massive fat deposition in liver, increases of cholic acid and its derivatives are evident in alcohol-fed Ppara-null mice. The combination of steatosis and bile acids accumulation contribute to progression to inflammation and fibrosis, which are evident from both histopathologic results and transcriptomics findings.
Figure 8.
Proposed mechanisms for the protective role of PPARα in ALD progression. Arrows in red indicate the changes caused by alcohol consumption.
PPARα is well characterized as the key transcriptional activator of genes involved in fatty acid β-oxidation. The transcriptomics data show attenuated expression of fatty acid β-oxidation genes in livers from Ppara-null mice compared to WT, which result in higher hepatic triglyceride levels observed in this and previous studies (Manna et al., 2010). In addition to genes in fatty acid β-oxidation, PPARα also regulates genes in other metabolic pathways such as Hmgcr, Hmgcs2, and Scd, and some PPARα downstream genes were reported to be induced (Mello et al., 2009), while others were down-regulated (Wan et al., 1995; Galli et al., 2001). These conflicting findings on PPARα downstream genes make it difficult to reach a clear and coherent understanding on how PPARα activity is modulated in response to alcohol consumption. The chronic alcohol feeding experiment with Ppara-null mice (Nakajima et al., 2004) suggested a protective role for PPARα in alcohol-induced diseases with striking differences in severe alcohol induced hepatic pathological changes between WT and Ppara-null mice. In the current study, the same mouse model system was used to investigate the mechanism for the protective role of PPARα. The transcriptomics results in indicate that PPARα activity is clearly enhanced after two-month alcohol feeding by inducing fatty acid β-oxidation gene transcription. This effect is not immediately caused by alcohol feeding since transcription of the same set of genes did not increase in the one-month study (Supplementary Fig. 4), which suggests that activation of PPARα on fatty acid β-oxidation genes may be a feedback response.
Previous published studies show that alcohol administration leads to a general down-regulation of PPARα and decreased fatty acid oxidation. These conclusions are consistent with the one-month transcriptomics results in the current study. Down regulation of some PPARα downstream genes such as Hmgcr, Scd1, and Fasn (van der Meer et al., 2010) which are involved in lipid metabolism other than fatty acid oxidation were observed in one-month alcohol-fed mice (data not shown). Results from an in vitro hepatocyte culture system showed that acute alcohol exposure reduced the binding of retinoid X receptor (RXR)-PPARα complex to peroxisome proliferator regulatory element (PPRE)-containing sequences (Galli et al., 2001). This effect on PPARα transcriptional activity may due to the increased NADH produced by alcohol metabolism by ADH and ALDH. PGC-1α, a coactivator of PPARa and γ, is deacetylated by SIRT1, a NAD+ regulated protein deacetylase. Deacetylated PGC-1α protein enhances PPARα transcriptional activity by recruiting HAT to modify chromosome histones in a target gene's promoter region. SIRT1, a critical modulator for PPARα activity, is negatively regulated by NADH (Sugden et al., 2010), which connects alcohol metabolism to the regulation of PPARαs target genes.
When alcohol feeding persists, fatty acid β-oxidation is upregulated by PPARα activation as discussed above. Induction of genes in the TCA cycle and electron transfer chains may be driven by the accumulation of β-oxidation and TCA cycle products respectively. These three core mitochondrial metabolism pathways are all adaptively regulated. Enhanced electron transfer chains consume redundant NADH, which in turn removes the inhibitory regulation on the SIRT/PGC-1α/PPARα axis. Indeed, expression of PGC-1α and LPN1, a coordinate regulator of PPARα/PGC-1α, directed β-oxidation gene transcription, were increased in the two-month alcohol-fed wt mice (data not shown).
To understand what caused the alcohol-fed Ppara-null mice to develop remarkable inflammation and detectable fibrosis, while the WT counterparts had few pathological abnormalities other than mild steatosis, metabolomic profiling of these four experimental groups were carried out. Striking increases of cholic acid and its derivatives were observed only in alcohol-fed Ppara-null mice. Hepatic cholestasis without bile duct obstruction has been reported to appear in all stages of ALD (Tung and Carithers, 1999), and accumulated bile acid in the liver aggravates alcohol-caused liver injury and promotes liver fibrosis. However the mechanisms of ethanol-induced cholestasis remain unclear. Chronic cholestasis can cause necrosis (Schmucker et al., 1990) and apoptosis (Reinehr et al., 2005) of hepatocytes, stimulate the pro-inflammatory responses (Allen et al., 2011; Podevin et al., 1999), and ultimately result in biliary fibrosis and liver cirrhosis (Holsti, 1956). In patients with alcoholic steatohepatitis, it was found that increased cholic acid and trihydroxy/dihydroxy bile acids significantly correlated with steatosis (Aranha et al., 2008). It is believed that PPARα plays an essential role in bile acid homeostatsis (Li et al., 2012). Long-term fibrate therapy in patients represses bile acid biosynthesis, and increases the risk of cholesterol gallstones (Post et al., 2001). To date, conflicting results have been reported on the effects of PPARα agonists on the expression of Cyp7a1, the enzyme for the first and rate-limiting step in the classic bile acid biosynthesis. In this study, expression of Abcb11 mRNA encoding a bile salt export pump that transports bile acid transporter from hepatocytes to the bile duct, was induced after alcohol feeding in WT but not in Ppara-null mice. This may explain the bile acid disorder in alcohol-fed Ppara-null mice. The significantly decreased expression of bile acid synthesis enzymes, Cyp7a1 and Cyp27a1 in alcohol-fed Ppara-null mice might be a feedback response. The changes in gene expression of these two bile acid synthesis enzyme are consistent with the changes found in Ppara-null mice challenged with cholic acid (CA) diet challenge (Li et al., 2012), which implies that chronic alcohol feeding may induce the metabolic challenge to bile acid homeostasis similar to CA diet challenge. In both studies, no significant difference for cholic acid and its derivatives was found between control WT and Ppara-null mice although the expression levels of Cyp7a1 and Cyp27a1 are significantly lower in Ppara-null than WT mice. In a rat model of biliary ablation with pure ethanol to characterize ethanol-induced bile duct injury, ethanol injection resulted in sclerosing cholangitis and severe liver damage (Tatekawa et al., 2013). The remarkable increases of bile acids in alcohol-fed Ppara-null mice may be the results of the enzymatic activity regulation by the balance of substrates and products and/or the canalicular damage associated with alcohol consumption.
In alcohol-fed Ppara-null mice, evidence of inflammatory responses and fibrosis were found by histopathology, immunohistochemistry, and gene expression. It is known that excessive hepatic bile acids can induce hepatocyte apoptosis and sterile inflammation marked by accumulation of neutrophils and macrophages. A proinflammatory factor, Thbs1, was robustly increased in alcohol-fed Ppara-null mice. Thbs1 encodes an adhesive glycoprotein that activates latent TGF-β. Hepatocytes from normal liver do not express Thbs1, whereas the Kupffer cells and sinusoidal endothelial cells do. It was found that Thbs1 expression is regulated by the profibrogenic mediator and is critical in TGF-βactivation in hepatic stellate cells (HSC) (Breitkopf et al., 2005b). In response to TGF-β, HSC are activated and triggered to synthesize type I and III collagen, fibronectin. Activation of HSC is a hallmark of fibrosis, represented by profound phenotypic alterations, including expression of α-smooth muscle actin (α-SMA), loss of vitamin A, increased proliferation and enhanced extracellular matrix production (Breitkopf et al., 2005a). Another factor that contributes to TGF-β activation is acetaldehyde, the product of alcohol oxidation catalyzed by ADH. In rat HSC, acetaldehyde was capable of stimulating latent TGF-β and inducing expression of the TGF-β type II receptor (Chen, 2002). Recently it was reported that Ppara-null mice had very low glucuronide and sulfate conjugates of alcohol in urine and the lower activity of these phase II metabolic pathways could lead to the increased level of acetaldehyde which can enhance TGF-β mediated HSC activation (Manna et al., 2010).
The hepatic histological changes of Ppara-null mice after chronic alcohol feeding include severe steatosis, inflammatory cell infiltration and fibrosis. These are also the common histological changes in ALD patients although in our mouse model they are less severe. The significant increase of hepatic cholic acid and its derivatives may be a critical factor activating the inflammatory reaction. Indeed hepatic cholestasis without bile duct obstruction has been reported to appear in all stages of ALD. In our study disruption of bile acid homeostasis and other ALD phenotypes were associated with PPARα deficiency. The fact that PPARα expression and activity in human liver are less than one-tenth of those in WT mouse liver suggests that lower PPARα activity in response to alcohol-induced metabolic challenge may contribute to development and progression of ALD in humans. The current study using Ppara-null mice will help to elucidate the role of PPARα in the molecular changes of alcoholic liver damage and provide novel mechanistic insight for ALD development. Our findings suggest the potential application of PPARα agonists in preventing ALD progression. This is especially attractive since fibrate drugs have been used in humans to treat hyperlipidemia for over 80 years. A recent report showed that PPARα agonist WY14643 alleviated liver injury caused by alcohol ingestion combined with carbon tetrachloride intraperitoneal injection in mice (Nan et al., 2013), in which carbon tetrachloride may be the major contributor for the observed severe liver injury including fibrosis. Our study suggests that PPARα agonists or other treatments with the capability to enhance mitochondria metabolic pathways may ameliorate alcoholic liver injury. The data presented here demonstrate the power of transcriptomics in combination with mass spectrometry-based metabolomics/lipidomics using genetic engineered mouse models to capture and elucidate metabolic changes during chronic alcohol consumption for mechanistic understanding of ALD development.
Supplementary Material
Acknowledgements
This study was funded by grant U01ES016013 from NIEHS, NIH, and grant R01AA018863 from NIAAA, NIH.
Abbreviations
- ALD
alcoholic liver disease
- PPARα
peroxisome proliferator-activated receptor α
- TCA
tricarboxylic acid cycle
- TG
triglyceride
- UPLC
ultra performance liquid chromatography
- QTOFMS
quadrupole time of flight mass spectrometry
- PCA
principle component analysis
- ADH
alcohol dehydrogenase
- ALDH
aldehyde dehydrogenase
- HSC
hepatic stellate cells
- a-SMA
α-smooth muscle actin
- RXR
retinoid X receptor
- PPRE
peroxisome proliferator response element
Footnotes
Competing interests
The authors declare that they have no competing interests.
References
- Allen K, Jaeschke H, Copple BL. Bile acids induce inflammatory genes in hepatocytes: a novel mechanism of inflammation during obstructive cholestasis. Am J Pathol. 2011;178:175–186. doi: 10.1016/j.ajpath.2010.11.026. [DOI] [PMC free article] [PubMed] [Google Scholar]
- Aranha MM, Cortez-Pinto H, Costa A, da Silva IB, Camilo ME, de Moura MC, Rodrigues CM. Bile acid levels are increased in the liver of patients with steatohepatitis. Eur J Gastroenterol Hepatol. 2008;20:519–525. doi: 10.1097/MEG.0b013e3282f4710a. [DOI] [PubMed] [Google Scholar]
- Breitkopf K, Haas S, Wiercinska E, Singer MV, Dooley S. Anti-TGF-beta strategies for the treatment of chronic liver disease. Alcohol Clin Exp Res. 2005a;29:121S–131S. doi: 10.1097/01.alc.0000189284.98684.22. [DOI] [PubMed] [Google Scholar]
- Breitkopf K, Sawitza I, Westhoff JH, Wickert L, Dooley S, Gressner AM. Thrombospondin 1 acts as a strong promoter of transforming growth factor beta effects via two distinct mechanisms in hepatic stellate cells. Gut. 2005b;54:673–681. doi: 10.1136/gut.2004.042911. [DOI] [PMC free article] [PubMed] [Google Scholar]
- Chen A. Acetaldehyde stimulates the activation of latent transforming growth factor-beta1 and induces expression of the type II receptor of the cytokine in rat cultured hepatic stellate cells. Biochem J. 2002;368:683–693. doi: 10.1042/BJ20020949. [DOI] [PMC free article] [PubMed] [Google Scholar]
- Crabb DW, Liangpunsakul S. Alcohol and lipid metabolism. J Gastroenterol Hepatol. 2006;21(Suppl 3):S56–S60. doi: 10.1111/j.1440-1746.2006.04582.x. [DOI] [PubMed] [Google Scholar]
- Desvergne B, Michalik L, Wahli W. Be fit or be sick: peroxisome proliferator-activated receptors are down the road. Mol Endocrinol. 2004;18:1321–1332. doi: 10.1210/me.2004-0088. [DOI] [PubMed] [Google Scholar]
- Diehl AM. Liver disease in alcohol abusers: clinical perspective. Alcohol. 2002;27:7–11. doi: 10.1016/s0741-8329(02)00204-5. [DOI] [PubMed] [Google Scholar]
- Fang JW, Bird GL, Nakamura T, Davis GL, Lau JY. Hepatocyte proliferation as an indicator of outcome in acute alcoholic hepatitis. Lancet. 1994;343:820–823. doi: 10.1016/s0140-6736(94)92025-7. [DOI] [PubMed] [Google Scholar]
- Fischer M, You M, Matsumoto M, Crabb DW. Peroxisome proliferator-activated receptor alpha (PPARalpha) agonist treatment reverses PPARalpha dysfunction and abnormalities in hepatic lipid metabolism in ethanol-fed mice. J Biol Chem. 2003;278:27997–28004. doi: 10.1074/jbc.M302140200. [DOI] [PubMed] [Google Scholar]
- Galli A, Pinaire J, Fischer M, Dorris R, Crabb DW. The transcriptional and DNA binding activity of peroxisome proliferator-activated receptor alpha is inhibited by ethanol metabolism. A novel mechanism for the development of ethanol-induced fatty liver. J Biol Chem. 2001;276:68–75. doi: 10.1074/jbc.M008791200. [DOI] [PubMed] [Google Scholar]
- Holsti P. Experimental cirrhosis of the liver in rabbits induced by gastric instillation of desiccated whole bile. Acta Pathol Microbiol Scand Suppl. 1956;39:1–66. [PubMed] [Google Scholar]
- Ji C, Chan C, Kaplowitz N. Predominant role of sterol response element binding proteins (SREBP) lipogenic pathways in hepatic steatosis in the murine intragastric ethanol feeding model. J Hepatol. 2006;45:717–724. doi: 10.1016/j.jhep.2006.05.009. [DOI] [PubMed] [Google Scholar]
- Kersten S, Seydoux J, Peters JM, Gonzalez FJ, Desvergne B, Wahli W. Peroxisome proliferator-activated receptor alpha mediates the adaptive response to fasting. J Clin Invest. 1999;103:1489–1498. doi: 10.1172/JCI6223. [DOI] [PMC free article] [PubMed] [Google Scholar]
- Li F, Patterson AD, Krausz KW, Tanaka N, Gonzalez FJ. Metabolomics reveals an essential role for peroxisome proliferator-activated receptor alpha in bile acid homeostasis. J Lipid Res. 2012;53:1625–1635. doi: 10.1194/jlr.M027433. [DOI] [PMC free article] [PubMed] [Google Scholar]
- Lumeng L, Crabb DW. Alcoholic liver disease. Curr Opin Gastroenterol. 2001;17:211–220. doi: 10.1097/00001574-200105000-00004. [DOI] [PubMed] [Google Scholar]
- Ma X, Baraona E, Lieber CS. Alcohol consumption enhances fatty acid omega-oxidation, with a greater increase in male than in female rats. Hepatology. 1993;18:1247–1253. [PubMed] [Google Scholar]
- MacSween RN, Burt AD. Histologic spectrum of alcoholic liver disease. Semin Liver Dis. 1986;6:221–232. doi: 10.1055/s-2008-1040605. [DOI] [PubMed] [Google Scholar]
- Mak TD, Laiakis EC, Goudarzi M, Fornace AJJ. MetaboLyzer: A Novel Statistical Workflow for Analyzing Postprocessed LC-MS Metabolomics Data. Anal Chem. 2013 doi: 10.1021/ac402477z. [DOI] [PMC free article] [PubMed] [Google Scholar]
- Manna SK, Patterson AD, Yang Q, Krausz KW, Li H, Idle JR, Fornace AJJ, Gonzalez FJ. Identification of noninvasive biomarkers for alcohol-induced liver disease using urinary metabolomics and the Ppara-null mouse. J Proteome Res. 2010;9:4176–4188. doi: 10.1021/pr100452b. [DOI] [PMC free article] [PubMed] [Google Scholar]
- Masuhara M, Yasunaga M, Tanigawa K, Tamura F, Yamashita S, Sakaida I, Okita K. Expression of hepatocyte growth factor, transforming growth factor alpha, and transforming growth factor beta 1 messenger RNA in various human liver diseases and correlation with hepatocyte proliferation. Hepatology. 1996;24:323–329. doi: 10.1053/jhep.1996.v24.pm0008690400. [DOI] [PubMed] [Google Scholar]
- Mello T, Polvani S, Galli A. Peroxisome proliferator-activated receptor and retinoic x receptor in alcoholic liver disease. PPAR Res. 2009;2009:748174. doi: 10.1155/2009/748174. [DOI] [PMC free article] [PubMed] [Google Scholar]
- Menon KV, Gores GJ, Shah VH. Pathogenesis, diagnosis, and treatment of alcoholic liver disease. Mayo Clin Proc. 2001;76:1021–1029. doi: 10.4065/76.10.1021. [DOI] [PubMed] [Google Scholar]
- Nakajima T, Kamijo Y, Tanaka N, Sugiyama E, Tanaka E, Kiyosawa K, Fukushima Y, Peters JM, Gonzalez FJ, Aoyama T. Peroxisome proliferator-activated receptor alpha protects against alcohol-induced liver damage. Hepatology. 2004;40:972–980. doi: 10.1002/hep.20399. [DOI] [PubMed] [Google Scholar]
- Nan YM, Kong LB, Ren WG, Wang RQ, Du JH, Li WC, Zhao SX, Zhang YG, Wu WJ, Di HL, Li Y, Yu J. Activation of peroxisome proliferator activated receptor alpha ameliorates ethanol mediated liver fibrosis in mice. Lipids Health Dis. 2013;12:11. doi: 10.1186/1476-511X-12-11. [DOI] [PMC free article] [PubMed] [Google Scholar]
- Palmer CN, Hsu MH, Griffin KJ, Raucy JL, Johnson EF. Peroxisome proliferator activated receptor-alpha expression in human liver. Mol Pharmacol. 1998;53:14–22. [PubMed] [Google Scholar]
- Pignon JP, Bailey NC, Baraona E, Lieber CS. Fatty acid-binding protein: a major contributor to the ethanol-induced increase in liver cytosolic proteins in the rat. Hepatology. 1987;7:865–871. doi: 10.1002/hep.1840070512. [DOI] [PubMed] [Google Scholar]
- Podevin P, Rosmorduc O, Conti F, Calmus Y, Meier PJ, Poupon R. Bile acids modulate the interferon signalling pathway. Hepatology. 1999;29:1840–1847. doi: 10.1002/hep.510290617. [DOI] [PubMed] [Google Scholar]
- Post SM, Duez H, Gervois PP, Staels B, Kuipers F, Princen HM. Fibrates suppress bile acid synthesis via peroxisome proliferator-activated receptor-alpha-mediated downregulation of cholesterol 7alpha-hydroxylase and sterol 27-hydroxylase expression. Arterioscler Thromb Vasc Biol. 2001;21:1840–1845. doi: 10.1161/hq1101.098228. [DOI] [PubMed] [Google Scholar]
- Rabinowitz JL, Staeffen J, Hall CL, Brand JG. A probable defect in the beta-oxidation of lipids in rats fed alcohol for 6 months. Alcohol. 1991;8:241–246. doi: 10.1016/0741-8329(91)90289-9. [DOI] [PubMed] [Google Scholar]
- Reinehr R, Becker S, Keitel V, Eberle A, Grether-Beck S, Haussinger D. Bile salt-induced apoptosis involves NADPH oxidase isoform activation. Gastroenterology. 2005;129:2009–2031. doi: 10.1053/j.gastro.2005.09.023. [DOI] [PubMed] [Google Scholar]
- Schmucker DL, Ohta M, Kanai S, Sato Y, Kitani K. Hepatic injury induced by bile salts: correlation between biochemical and morphological events. Hepatology. 1990;12:1216–1221. doi: 10.1002/hep.1840120523. [DOI] [PubMed] [Google Scholar]
- Shi X, Yao D, Gosnell BA, Chen C. Lipidomic profiling reveals protective function of fatty acid oxidation in cocaine-induced hepatotoxicity. J Lipid Res. 2012;53:2318–2330. doi: 10.1194/jlr.M027656. [DOI] [PMC free article] [PubMed] [Google Scholar]
- Sugden MC, Caton PW, Holness MJ. PPAR control: it's SIRTainly as easy as PGC. J Endocrinol. 2010;204:93–104. doi: 10.1677/JOE-09-0359. [DOI] [PubMed] [Google Scholar]
- Tatekawa Y, Nakada A, Nakamura T. Intrahepatic biliary ablation with pure ethanol: an experimental model of biliary atresia. Surg Today. 2013;43:661–669. doi: 10.1007/s00595-012-0379-2. [DOI] [PubMed] [Google Scholar]
- Tung BY, Carithers RLJ. Cholestasis and alcoholic liver disease. Clin Liver Dis. 1999;3:585–601. doi: 10.1016/s1089-3261(05)70086-6. [DOI] [PubMed] [Google Scholar]
- van der Meer DL, Degenhardt T, Vaisanen S, de Groot PJ, Heinaniemi M, de Vries SC, Muller M, Carlberg C, Kersten S. Profiling of promoter occupancy by PPARalpha in human hepatoma cells via ChIP-chip analysis. Nucleic Acids Res. 2010;38:2839–2850. doi: 10.1093/nar/gkq012. [DOI] [PMC free article] [PubMed] [Google Scholar]
- Wan YJ, Morimoto M, Thurman RG, Bojes HK, French SW. Expression of the peroxisome proliferator-activated receptor gene is decreased in experimental alcoholic liver disease. Life Sci. 1995;56:307–317. doi: 10.1016/0024-3205(94)00953-8. [DOI] [PubMed] [Google Scholar]
- Wan YY, Cai Y, Li J, Yuan Q, French B, Gonzalez FJ, French S. Regulation of peroxisome proliferator activated receptor alpha-mediated pathways in alcohol fed cytochrome P450 2E1 deficient mice. Hepatol Res. 2001;19:117–130. doi: 10.1016/s1386-6346(00)00089-9. [DOI] [PubMed] [Google Scholar]
- You M, Fischer M, Deeg MA, Crabb DW. Ethanol induces fatty acid synthesis pathways by activation of sterol regulatory element-binding protein (SREBP). J Biol Chem. 2002;277:29342–29347. doi: 10.1074/jbc.M202411200. [DOI] [PubMed] [Google Scholar]
Associated Data
This section collects any data citations, data availability statements, or supplementary materials included in this article.


