Abstract
Individuals who habitually breathe through the mouth are more likely than nasal breathers to have sleep disorders and attention deficit hyperactive disorder. We hypothesized that brain hemodynamic responses in the prefrontal cortex might be different for mouth and nasal breathing. To test this hypothesis, we measured changes in oxyhemoglobin and deoxyhemoglobin in the prefrontal cortex during mouth breathing and nasal breathing in healthy adults (n=9) using vector-based near-infrared spectroscopy. The angle k, calculated from changes in oxyhemoglobin and deoxyhemoglobin and indicating the degree of oxygen exchange, was significantly higher during mouth breathing (P<0.05), indicating an increased oxygen load. Mouth breathing also caused a significant increase in deoxyhemoglobin, but oxyhemoglobin did not increase. This difference in oxygen load in the brain arising from different breathing routes can be evaluated quantitatively using vector-based near-infrared spectroscopy. Phase responses could help to provide an earlier and more reliable diagnosis of a patient’s habitual breathing route than a patient interview.
Keywords: hemodynamic response, mouth breathing, nasal breathing, oxygen load, vector-based near-infrared spectroscopy
Introduction
There are two breathing routes, through the mouth and the nose, and humans normally breathe through the nose. When rhinitis obstructs the upper airway, we are forced to breathe through the mouth, and nasal obstruction is a potential risk factor for sleep-disordered breathing 1. Mouth breathing because of nasal obstruction is likely to cause sleep disorders, and by day, it may give rise to symptoms similar to those of attention deficit hyperactivity disorder (ADHD) 2. In these ways, it has been suggested that breathing through the mouth instead of the nose can adversely affect brain function. Relationships have also been reported between mouth breathing and disorders such as abnormal development of the orofacial region, dry mouth, malocclusion and chewing abnormalities, tooth caries, periodontal disease, and bad breath 3,4. In research on respiratory function using electroencephalography (EEG), right/left EEG changes were observed with forced alternate nostril breathing 5. Hyperventilation is also known to cause the appearance of slow waves and increased amplitude in the EEG 6. In a study of breathing and cerebral blood flow using near-infrared spectroscopy (NIRS), hyperventilation was reported to reduce carbon dioxide (CO2) pressure, reducing cerebral blood flow by means of cerebral vasoconstriction 7. Elwell et al. 8 showed a correlation between total hemoglobin (oxyhemoglobin and deoxyhemoglobin) in the brain and expiratory pressure. However, very little is known about possible effects on cerebral blood flow and oxygen metabolism arising from differences between mouth and nasal breathing during the waking hours.
In the brain, central fatigue is known to reduce oxygen tension 9. It is also possible that excessive oxygen consumption in the cortex causes central fatigue, and indeed, there is a report of lower transcutaneous oxygen tension during mouth breathing than during nasal breathing 10. We therefore hypothesized that there might be differences in brain hemodynamic responses in the prefrontal cortex during mouth and nasal breathing. To test the hypothesis that mouth and nasal breathing give rise to different cerebral hemodynamic responses, we measured differences in changes in oxyhemoglobin and deoxyhemoglobin in the prefrontal cortex during mouth and nasal breathing in healthy adults (n=9) using vector-based NIRS.
Participants and methods
Participants
Ten healthy adults participated in this study: five men and five women, mean age 36.2±12.1 years. Before initiation of the study, the content of the study was explained to all the participants, orally and in writing, and their consent was obtained for participation in the study and publication of the results, with the approval of the ethics committee of the KatoBrain Co. Ltd (Tokyo, Japan).
Breathing habit profiles
To determine participants’ normal breathing habits, they were asked to fill out a questionnaire, in which they were asked to rate how frequently or to what degree they experienced the following: (a) nasal obstruction, (b) inability to move the nostrils, (c) dry mouth, (d) bad breath, (e) mouth hanging open, (f) history of dental caries and gingivitis, (g) degree of malocclusion, (h) chewing abnormalities, (i) snoring, and (j) smoking. A participant’s total score was evaluated as follows: never/none: 0 points; occasionally/light: 1 point; frequently/moderate: 2 points; and always/severe: 3 points. The average score for the 10 participants was 7.2 points (SD±4.9), and nine participants were not considered to be habitual mouth breathers [average score: 5.9 (±2.6) points]. One participant clearly breathed habitually by mouth, and was therefore excluded from the study.
Experimental procedures
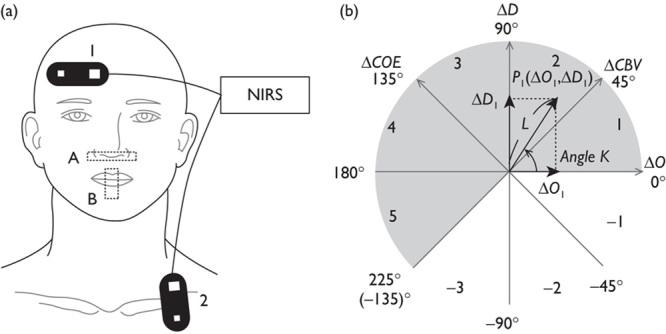
The tasks were simply mouth breathing and nasal breathing. The participant sat in a chair in a relaxed state, with his or her eyes closed. First, each participant breathed through his or her nose for 270 s, with the mouth taped so as not to allow air through the mouth. After that, the tape was removed from the participant’s mouth and the participant breathed through the mouth for 270 s, with the nose taped so as not to allow air through the nose (Fig. 1a).
Fig. 1.

(a) Attachment of probes and taping: (1) BA10 probe, (2) respiratory rate probe, (A) nose taping, (B) mouth taping. (b) Polar coordinate plane for analysis of cerebral oxygenation. Phase numbers are shown in each octant. The relationship between cerebral oxygen exchange (ΔCOE) and cerebral blood volume (ΔCBV) can be detected by the trajectory of a vector. NIRS, near-infrared spectroscopy.
Near-infrared spectroscopy measurements
Hemoglobin concentrations in the brain tissue were monitored by NIRS (NIRO 300; Hamamatsu Photonics K.K., Hamamatsu City, Japan) using four different wavelengths (775, 810, 850, and 910 nm). Hemoglobin indices were measured at 500 ms intervals. The distance between the near-infrared emission and detection elements was set at 40 mm.
Measurement channels were placed on the head at the right medial and lateral Brodmann’s area 10 (BA10). The medial measurement channel was placed over Fp2 according to the landmarks of the international 10-20 system for EEG electrode placement. The lateral measurement channel was placed between Fp2 and F8. Selection of these two measurement sites was made with reference to previous research showing that local responses to the autonomous nervous system and respiratory function occurred in the prefrontal cortex 11. Another probe was attached at the center of the left clavicle and monitored for respiratory movement of the chest. Measurements were performed a total of four times, for nasal breathing and for mouth breathing, at each of the two measurement sites.
First, measurements were taken at the right medial BA10 and the left clavicle for nasal breathing and then mouth breathing. Measurements were then repeated at the right lateral BA10 and the left clavicle in the same way.
Analysis of the respiratory rate
Respiratory rates were calculated for nasal and mouth breathing by counting the number of chest movements over 270 s to determine possible differences between nasal and mouth breathing.
Vector analysis of hemodynamic responses
Vectors for cerebral blood volume (ΔCBV) and cerebral oxygen exchange (ΔCOE) were generated for analysis from the time-course changes in oxyhemoglobin and deoxyhemoglobin (ΔO and ΔD) as follows.
An orthogonal vector coordinate plane defined by the axes ΔO and ΔD is shown in Fig. 1b. These axes are then rotated 45°counterclockwise to create an orthogonal vector coordinate plane defined by a ΔCBV axis (ΔO+ΔD) and a ΔCOE axis (ΔD–ΔO). A positive value for ΔCOE shows hypoxic change starting from ΔCOE=0 and a negative value for ΔCOE shows hyperoxic change. The relationships among these four axes are described by the following square matrix 12:
 |
 |
The polar coordinate plane formed from these four axes is called a cerebral oxygen regulation (CORE) vector plane. A cerebral oxygen regulation vector (CORE vector) has the four hemoglobin indices ΔO, ΔD, ΔCBV, and ΔCOE as its components.
The phase of a CORE vector is determined using the angle k between the vector and the positive ΔO axis:
 |
The angle k represents the ratio of ΔCOE to ΔCBV and indicates the degree of oxygen exchange. On the positive ΔO axis, k=0 and the angle k increases in a counterclockwise direction. k>0 indicates deoxygenation or hypoxic change and an increase in the angle k shows an increase in the degree of oxygen exchange. However, when the angle k decreases in a clockwise direction from k=0, k<0 indicates a decrease in the degree of oxygen exchange, reflecting hyperoxemia.
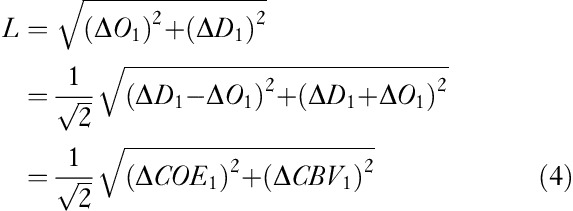
The scalar L, drawn from the origin of a CORE vector to the coordinates of a cumulative sum, shows the amplitude of a CORE vector and represents the amount of change in hemoglobin. L is described by the following equation 13:
 |
Statistical analysis
With the starting point of ΔO and ΔD measurements as 0, cumulative sums were calculated every 30 s for each participant. Grand averages were calculated, averaging the cumulative sums from each of the two sites for nasal breathing and for mouth breathing. For two-dimensional analysis, cumulative sums of ΔCOE and ΔCBV were calculated using Eqs (1) and (2) from the cumulative sums of ΔO and ΔD. CORE vectors were drawn using the cumulative sums of ΔCOE and ΔCBV. Multivariate analysis of variance was carried out using cumulative sums of ΔCOE and ΔCBV from the same time periods to compare the two types of breathing to determine differences between the nasal and the mouth breathing vectors. For one-dimensional analysis, independent t-tests were used to determine differences between nasal breathing and mouth breathing using ΔO, ΔD, and L from the same time periods. A statistical test for angular data (Watson’s U2 test) was applied to k to test for significant differences between mouth and nasal breathing.
Results
Vector comparisons of nasal and mouth breathing
The average number of respirations for all participants was 54.2 respirations for nasal breathing and 57.7 respirations for mouth breathing, and there was thus no significant difference between nasal and mouth breathing respiratory rates.
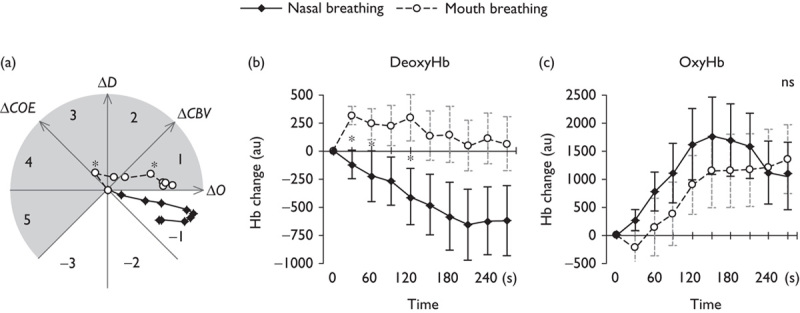
Figure 2a shows the trajectories of the CORE vectors during nasal breathing and mouth breathing. The vector for nasal breathing is in phase 1, a high oxygenation phase. The vector for mouth breathing, however, remains in deoxygenation phases throughout, reflecting oxygen consumption. It is in phase 3 for the first 30 s and phase 2 for the next minute, and then it moves into phase 1. The mouth breathing vectors differ significantly from the nasal breathing vectors in the time periods 0–30 s [F(2,15)=16.94, P<0.01] and 90–120 s [F(2,15)=4.10, P=0.04]. The scalar L, however, showed no significant differences between nasal breathing and mouth breathing. Significant differences between the vectors thus reflected differences in phase rather than intensity.
Fig. 2.

(a) Trajectory of cerebral oxygen regulation vectors during nasal and mouth breathing. Time courses of changes in (b) deoxyhemoglobin (DeoxyHb) and (c) oxyhemoglobin (OxyHb). Average cumulative sums and SEM were calculated every 30 s during nasal and mouth breathing. Asterisks indicate significant differences (*P<0.05). ΔCBV, cerebral blood volume; ΔCOE, cerebral oxygen exchange. au, arbitary unit; ns, not significant.
Figure 2b and c show the time courses of the cumulative sums of ΔO and ΔD during nasal breathing and mouth breathing, calculated every 30 s. Figure 2b shows ΔD decreasing during nasal breathing but increasing during mouth breathing. There are significant differences between the nasal breathing and the mouth breathing vectors in the time periods 0–60 s [0–30 s: t(16)=5.52, P<0.01; 30–60 s: t(16)=2.37, P=0.03] and 90–120 s [t(16)=2.41, P=0.03].
Figure 2c shows ΔO during nasal breathing increasing at first, peaking at 150 s, and then decreasing. During mouth breathing, ΔO decreased during the first 30 s and then increased continuously to the end of the measurement period. The differences in ΔO between nasal breathing and mouth breathing were not significant.
Phase differences on the basis of breathing routes
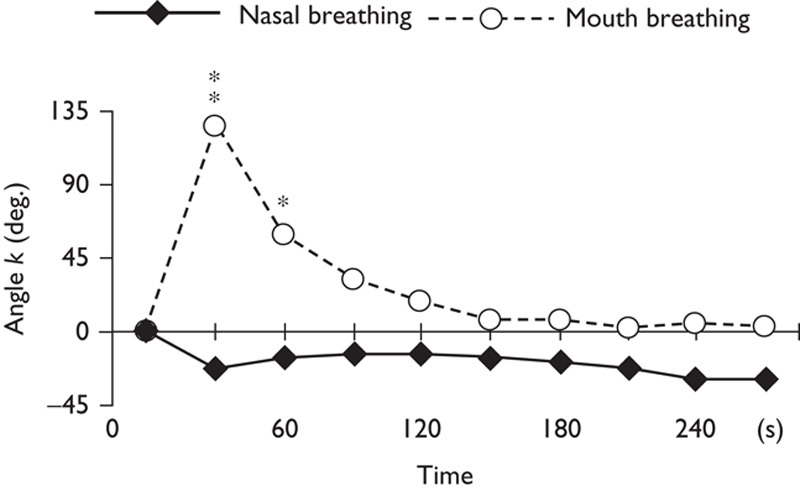
Figure 3 shows an angle k that is constant between −45 and 0° during nasal breathing. During mouth breathing, k increases sharply for 30 s and then decreases, becoming constant between 0 and 45°. In fact, k for mouth and nasal breathing differed significantly during the periods 0–30 s (P<0.05) and 30–60 s (P<0.1).
Fig. 3.

Time courses of k for nasal and mouth breathing. Asterisks indicate significant differences (**P<0.05; *P<0.1).
Discussion
Hemodynamic responses in the prefrontal cortex were different during the two different breathing routes. We found that deoxyhemoglobin increased with mouth breathing but decreased with nasal breathing, and the difference was significant. The differences in oxyhemoglobin during mouth and nasal breathing, however, were not significant. Mouth breathing was thus shown to result in an increasing oxygen load in the prefrontal cortex when compared with nasal breathing. We found no significant difference in respiratory rates. However, breathing routes have been reported to affect breathing patterns, respiratory frequency, and tidal volume 14. It is possible that different breathing routes might result in changes in respiratory frequency and tidal volume, and differences in oxygen consumption in the prefrontal cortex might arise as a way for the human body to maintain homeostasis. It is also possible that the increased oxygen load in the prefrontal cortex is no more than a result of the voluntary input necessary for breathing through the nonpreferred mouth route.
Sleep-disordered breathing has been shown to cause hypoxia in previous NIRS studies 15,16, but how the difference in breathing routes in healthy individuals affects the brain is still unclear. The difference between breathing routes during waking hours may have a greater effect on the hemodynamic response than the respiratory rate.
Unlike fMRI, vector-based NIRS is able to simultaneously detect changes in oxyhemoglobin and deoxyhemoglobin in the order of milliseconds. It can thus be used to describe neuroactivation by separating out changes in phase (indicated by the value of k) and amplitude (L) 12. Despite the absence of differences in the respiratory rate or the amount of hemoglobin variation (the scalar L) between nasal breathing and mouth breathing, we found phase to be an effective indicator for differentiating nasal breathing and mouth breathing. Elwell et al. 8 showed a correlation between ΔCBV (ΔO+ΔD) and expiratory pressure, but it is possible that the different ways of breathing could cause changes in phase (k) without affecting ΔCBV. The value of k, which quantitatively shows the state of cerebral oxygenation, proved to be effective as an indicator for quantitative evaluation, showing one effect of the breathing route on the cerebral cortex.
ADHD is reported to be associated with prefrontal cortex function 17,18. There are also reports that activation of the prefrontal cortex and exertional dyspnea are involved in patients with chronic obstructive pulmonary disease 19. Changes in cortical excitability observed in hypoxemic patients with chronic respiratory insufficiency further suggest that chronic hypoxia can induce alterations in cerebral neuronal excitability 20. Our results suggest that continued oxygen load on the prefrontal cortex from mouth breathing during the waking hours is one possible cause of ADHD arising from central fatigue.
As Fig. 3 shows that hemodynamic responses in the prefrontal cortex to nasal and mouth breathing are different in healthy individuals. This means that it may be possible to distinguish breathing habits by observation of the brain. In the treatment of sleep-disordered breathing, ADHD, and dental malocclusion, evaluation of breathing habits is one important factor that must be considered. This diagnosis has been difficult and sometimes uncertain when based solely on dentition and patient interviews. Phase response as detected by vector-based NIRS could help to provide a more reliable diagnosis of a patient’s habitual breathing route on the basis of differences in brain hemodynamic responses measured during a brief chairside examination.
It is possible that nonhabitual mouth breathing encourages activity of the frontal lobe and breathing that is more voluntary than habitual nasal breathing. An increase in oxygen load would thus be more likely to occur in the frontal cortex than in the parietal and occipital cortex. Kato et al. 11 reported previously on the feasibility of using 24-channel fNIRS as a diagnostic tool for assessment of regional cerebral physiology related to autonomic and respiratory function. In that study, increases in oxyhemoglobin were observed in the right inferior frontal lobe and the precentral gyrus after breath holding, as compared with other areas of the brain, and the ipsilateral carotid sinus reflex induced an increase in regional ΔCBV in the ipsilateral middle cerebral area and a decrease in regional ΔCBV in the contralateral middle cerebral area 11. In general, breathing, by means of CO2 changes, causes global changes in cerebral blood flow, which does not affect oxygen metabolism 21. It is not impossible that a difference in breathing routes might cause changes in CO2. In this study, however, only changes in oxygen load were detected in the prefrontal cortex, unaccompanied by significant changes in L (which reflects the amount of change in hemoglobin). Determining whether the same response occurs in the occipital and parietal cortex will require further study using multichannel fNIRS, and the inclusion of participants with a habit of mouth breathing.
Conclusion
The hypothesis that mouth and nasal breathing give rise to different cerebral hemodynamic responses in the prefrontal cortex was corroborated in this study. We found that mouth breathing caused an increased oxygen load in the prefrontal cortex. This is the first study to compare the effect of breathing routes on hemodynamic responses in healthy individuals during the waking hours. It is possible that a few minutes’ detection of phase responses using vector-based NIRS could become an effective way to quantitatively diagnose differences in breathing routes on the basis of this increased oxygen load.
Acknowledgements
This study was partly supported by Patricia Yonemura for English editing and by Tadashi Saito for useful discussion related to mouth breathing.
Conflicts of interest
There are no conflicts of interest.
References
- 1. Young T, Finn L, Kim H.Nasal obstruction as a risk factor for sleep-disordered breathing.J Allergy Clin Immunol 1997;99:757–762 [DOI] [PubMed] [Google Scholar]
- 2. Jefferson Y.Mouth breathing: adverse effects on facial growth, health, academics, and behavior.Gen Dent 2010;58:18–25 [PubMed] [Google Scholar]
- 3. Harari D, Redlich M, Miri S, Hamud T, Gross M.The effect of mouth breathing versus nasal breathing on dentofacial and craniofacial development in orthodontic patients.Laryngoscope 2010;120:2089–2093 [DOI] [PubMed] [Google Scholar]
- 4. Bakor SF, Pereira JC, Frascino S, Ladalardo TC, Pignatari SS, Weckx LL.Demineralization of teeth in mouth-breathing patients undergoing maxillary expansion.Braz J Otorhinolaryngol 2010;76:709–712 [DOI] [PMC free article] [PubMed] [Google Scholar]
- 5. Stancák A, Jr, Kuna M.EEG changes during forced alternate nostril breathing.Int J Psychophysiol 1994;18:75–79 [DOI] [PubMed] [Google Scholar]
- 6. Busek P, Kemlink D.The influence of the respiratory cycle on the EEG.Physiol Res 2005;54:327–333 [PubMed] [Google Scholar]
- 7. Rostrup E, Law I, Pott F, Ide K, Knudsen GM.Cerebral hemodynamics measured with simultaneous PET and near-infrared spectroscopy in humans.Brain Res 2002;954:183–193 [DOI] [PubMed] [Google Scholar]
- 8. Elwell CE, Owen-Reece H, Wyatt JS, Cope M, Reynolds EO, Delpy DT.Influence of respiration and changes in expiratory pressure on cerebral haemoglobin concentration measured by near infrared spectroscopy.J Cereb Blood Flow Metab 1996;16:353–357 [DOI] [PubMed] [Google Scholar]
- 9. Peter R, Niels HS, Nicolas TP.Understanding central fatigue: where to go?Exp Physiol 2007;92:369–370 [DOI] [PubMed] [Google Scholar]
- 10. Lundberg JO, Settergren G, Gelinder S, Lundberg JM, Alving K, Weitzberg E.Inhalation of nasally derived nitric oxide modulates pulmonary function in humans.Acta Physiol Scand 1996;158:343–347 [DOI] [PubMed] [Google Scholar]
- 11. Kato T, Yamashita Y, Sugihara K, Furusho J, Tazaki I, Tanaka D, et al. Cerebral autonomic functional test using human functional near-infraredgraphy (fNIR).NeuroImage 1999;9:S221 [Google Scholar]
- 12.Kato T. Apparatus for evaluating biological function. United States Patent 2006; US7065392.
- 13. Yoshino K, Kato T.Vector-based phase classification of initial dips during word listening using near-infrared spectroscopy.Neuroreport 2012;14:947–951 [DOI] [PubMed] [Google Scholar]
- 14. Rodenstein DO, Mercenier C, Stănescu DC.Influence of the respiratory route on the resting breathing pattern in humans.Am Rev Respir Dis 1985;131:163–166 [DOI] [PubMed] [Google Scholar]
- 15. Pizza F, Biallas M, Wolf M, Werth E, Bassetti CL.Nocturnal cerebral hemodynamics in snorers and in patients with obstructive sleep apnea: a near-infrared spectroscopy study.Sleep 2010;33:205–210 [DOI] [PMC free article] [PubMed] [Google Scholar]
- 16. Olopade CO, Mensah E, Gupta R, Huo D, Picchietti DL, Gratton E, et al. Noninvasive determination of brain tissue oxygenation during sleep in obstructive sleep apnea: a near-infrared spectroscopic approach.Sleep 2007;30:1747–1755 [DOI] [PMC free article] [PubMed] [Google Scholar]
- 17. Finger EC, Marsh AA, Mitchell DG, Reid ME, Sims C, Budhani S, et al. Abnormal ventromedial prefrontal cortex function in children with psychopathic traits during reversal learning.Arch Gen Psychiatry 2008;65:586–594 [DOI] [PMC free article] [PubMed] [Google Scholar]
- 18. Dumontheil I, Burgess PW, Blakemore SJ.Development of rostral prefrontal cortex and cognitive and behavioural disorders.Dev Med Child Neurol 2008;50:168–181 [DOI] [PMC free article] [PubMed] [Google Scholar]
- 19. Higashimoto Y, Honda N, Yamagata T, Matsuoka T, Maeda K, Satoh R, et al. Activation of the prefrontal cortex is associated with exertional dyspnea in chronic obstructive pulmonary disease.Respiration 2011;82:492–500 [DOI] [PubMed] [Google Scholar]
- 20. Samuel V, Thomas R, Marc J, Bernard W, François E, Patrick L, et al. Cerebral perturbations during exercise in hypoxia.Am J Physiol Regul Integr Comp Physiol 2012;302:903–916 [DOI] [PubMed] [Google Scholar]
- 21. Battisti-Charbonney A, Fisher J, Duffin J.The cerebrovascular response to carbon dioxide in humans.J Physiol 2011;589:3039–3048 [DOI] [PMC free article] [PubMed] [Google Scholar]


