

Background: The hexosamine biosynthesis pathway to UDP-GlcNAc has been implicated in glucose homeostasis.
Results: UDP-GlcNAc and Golgi N-acetylglucosaminyltransferases modify the N-glycans on glucagon receptor, which increases sensitivity to glucagon in vivo.
Conclusion: The hexosamine biosynthesis pathway contributes to glucose homeostasis, in part through N-glycan branching on glucagon receptor.
Significance: Hepatic Mgat5 and the N-glycan branching pathway may be a therapeutic target for control of glycemia.
Keywords: Gluconeogenesis, Glycosylation, Glycosyltransferase, Metabolism, Receptor Regulation, Golgi N-Acetylglucosaminyltransferases, Glucagon Receptor
Abstract
Glucose homeostasis in mammals is dependent on the opposing actions of insulin and glucagon. The Golgi N-acetylglucosaminyltransferases encoded by Mgat1, Mgat2, Mgat4a/b/c, and Mgat5 modify the N-glycans on receptors and solute transporter, possibly adapting activities in response to the metabolic environment. Herein we report that Mgat5−/− mice display diminished glycemic response to exogenous glucagon, together with increased insulin sensitivity. Glucagon receptor signaling and gluconeogenesis in Mgat5−/− cultured hepatocytes was impaired. In HEK293 cells, signaling by ectopically expressed glucagon receptor was increased by Mgat5 expression and GlcNAc supplementation to UDP-GlcNAc, the donor substrate shared by Mgat branching enzymes. The mobility of glucagon receptor in primary hepatocytes was reduced by galectin-9 binding, and the strength of the interaction was dependent on Mgat5 and UDP-GlcNAc levels. Finally, oral GlcNAc supplementation rescued the glucagon response in Mgat5−/− hepatocytes and mice, as well as glycolytic metabolites and UDP-GlcNAc levels in liver. Our results reveal that the hexosamine biosynthesis pathway and GlcNAc salvage contribute to glucose homeostasis through N-glycan branching on glucagon receptor.
Introduction
The major biological function of the pancreatic hormone glucagon is to counteract the glucose-lowering action of insulin and maintain blood glucose concentration during fasting (1, 2). Indeed, the severe hyperglycemia and glucose intolerance that characterizes insulin-deficient mice is reversed by a deficiency in glucagon receptor (Gcgr), although the mice are more sensitive to prolonged fasting (3–6). These experiments appear to unmask more ancient levels of feedback regulation that underpin insulin and glucagon signaling. In Saccharomyces cerevisiae, glucose perception and import are separate modules that interact through post-translational modifications signaling to regulate metabolism and growth rates (7, 8). Kinases and phosphatases mediate rapid allosteric regulation of enzymes, whereas protein N-glycosylation adapts cell surface receptors and transporters to extracellular conditions (9).
Biosynthesis of high energy post-translational modification substrates such as acetyl-CoA (10), and UDP-GlcNAc are key to nutrient sensing (11–15). Fructose-6P, glutamine, and acetyl-CoA are pivotal substrates in multiple pathways including the hexosamine biosynthesis pathway (HBP)3 to UDP-GlcNAc (9, 16). Both O-GlcNAcylation of transcription factors (17–19) and N-glycosylation of membrane proteins have been identified as effectors of UDP-GlcNAc in glucose homeostasis (12, 20). However, these effector pathways remain poorly understood (21).
Membrane receptors and solute transporters are cotranslationally modified in rough endoplasmic reticulum (ER) by oligosaccharyltransferase, which transfers the N-glycan from Glc3Man9GlcNAc2-pp-dolichol to Asn at NX(S/T) (where X ≠ P) sites. N-Glycosylation is found in all domains of life (22, 23) and has an ancient function that promotes protein folding in the endoplasmic reticulum. Protein synthesis and chaperone-assisted homeostasis consumes a large portion of cellular resources, and under stress conditions, reduced biosynthesis of Glc3Man9GlcNAc2-pp-dolichol activates the unfolded protein response, thus a metabolic mechanism of stress tolerance (24).
With metazoan evolution, the ER N-glycan modification became a platform for remodeling in the Golgi and additional functionality at the cell surface. The N-glycans are trimmed and rebuilt beginning with the branching N-acetyl-glucosaminyltransferases, encoded by the Mgat-1, Mgat-2, Mgat-4a/b/c, and Mgat-5 genes (25) (see Fig. 1A). The branching enzymes form a linear pathway and require the donor substrate UDP-GlcNAc. The GlcNAc branches are extended with galactose, poly-N-acetyllactosamine, fucose, and sialic acid, generating sequences recognized by galectins, C-type lectins, and siglecs at the cell surface. Galectin binding to Galβ1–4GlcNAcβ, a common sequence of N-glycan branches of membrane proteins, forms multivalent complexes, which results in a highly dynamic and heterogeneous lattice at the cell surface. Strong selective pressures on Golgi remodeling and its substrates during vertebrate evolution (26) have resulted in a layer of HBP-sensitive regulation for membrane receptors and solute transporters (12).
FIGURE 1.

Glucose distribution in male Mgat5+/+ and Mgat5−/− mice. A, proteins produced in the secretory pathway are N-glycosylated in the ER, followed by remodeling of the N-glycans in the Golgi. The medial Golgi N-acetylglucosaminyltransferases I, II, VI, and V (MGAT1, 2, 4, and 5 genes) initiate the GlcNAc branches sequentially. The trans-Golgi β1,4-galactosyltransferase extend GlcNAc branches forming ligands for galectins, where affinity is proportional to branching. B, serum glucose levels at 6 months in fed and fasted conditions. C and D, plasma glucagon (C) and plasma insulin (D) levels measured in male mice fasted 5 and 16 h (n = 4–8). E–H, IPGTT (E), OGTT (F), ITT (G), and GC tests (H) at 8–12 months. Bar graphs show the area under the curve (AUC, n = 5–11). The values are expressed as means ± S.E. *, p < 0.05; **, p < 0.01; ***, p < 0.001 by paired t test.
Glucose transporters (Glut) are dependent on N-glycan branching as reported for Glut2 in β-cells (20), Glut1 in tumor cells (27), and Glut4 (12, 28). The Mgat4a−/− mice display suppressed secretion of insulin in response to glucose caused by a failure to retain Glut2 at the surface of β-cells (20). The Mgat4a-branched N-glycan on Glut2 binds to galectin-9, which slows mobility at the cell surface and loss to endocytosis, thus increasing the transport of glucose, and thereby insulin secretion. Although Mgat4a−/− mice display hypoinsulinemia and excess weight gain on a high fat diet, Mgat5−/− mice are resistant to weight gain and display hyperglucagonemia (29), suggesting either a gain of function in glucagon secretion and/or a loss of function in hepatic Gcgr. Mice lacking Gcgr display resistance to obesity on a high fat diet with elevated circulating glucagon (30, 31). Receptor deficiencies often result inelevated levels of the cognate ligand caused by feedback up-regulation of ligand production or secretion and/or failure to internalize and clear the ligand in the absence of receptor. Therefore, we hypothesized that the Gcgr may be regulated by Mgat5-dependent N-glycan branching in an HBP-dependent manner.
The Gcgr is a member of the class B G protein-coupled receptor superfamily (32), and activation results in the replacement of GDP with GTP bound to the Gsα subunit of the α/β/γ heterotrimeric complex. The GTP-bound Gsα activates adenylyl cyclase, and cAMP stimulates PKA, glycogen phosphorylase kinase, and glycogen phosphorylase leading to hepatic glycogenolysis and gluconeogenesis (33). Inhibition of glucagon action attenuates hyperglycemia in experimental models and in subjects with type 2 diabetes (34). Here we report that Mgat5−/− mice and primary hepatocytes are hyposensitive to glucagon. The Mgat5-branched N-glycans on Gcgr increases receptor binding to galectin-9, which slows mobility and increases responsiveness to glucagon. GlcNAc supplementation increases UDP-GlcNAc flux to N-glycan branching in primary hepatocytes, and GlcNAc supplementation to Mgat5−/− mice restored the glycemic response to glucagon. Our findings reveal a role for HBP and N-glycan branching on Gcgr as a positive regulator of glucagon responsiveness.
EXPERIMENTAL PROCEDURES
Mice
Age- and sex-matched littermates on the C57BL/6 background were used in all the experiments. The Mgat5−/− mutation was described previously (35) and made isogenic on C57BL6 by 15 generations of backcrosses. The Mgat5−/− hypoglycemia phenotype has been validated on both 129/sv and C56BL6 backgrounds (29). Mice were maintained on a standard rodent chow (Teklad rodent diet, 18% protein, 6% fat, #2018) with a normal 12-h light/12-h dark cycle. In some experiments, mice were on low fat diet (Teklad rodent diet, 19% protein, 4% fat, #8604) or high fat diet (Teklad rodent diet, 19% protein, 9.8% fat, #2019) with or without GlcNAc (0.5 mg/ml) in the drinking water as indicated. Experiments were done according to protocols and guidelines approved by the Toronto Centre for Phenogenomics animal care committee.
Glucose Tolerance, Glucagon Challenge, or Insulin Tolerance Test
For intraperitoneal glucose tolerance tests (IPGTTs), mice were fasted for 16 h before intraperitoneal injection of 0.01 ml/g of body weight of a glucose solution containing 150 mg/ml. For oral glucose tolerance test (OGTT), a glucose solution was administered by oral gavage. Blood samples were drawn via the tail vain, and glucose was measured using a Glucometer Elite blood glucose meter (Bayer, Toronto, Canada). For the glucagon challenge (GC) test or insulin tolerance test (ITT), mice were fasted for 5 h and injected intraperitoneally with a glucagon solution of 1.6 μg/ml (0.01 ml/g body of weight) (16 μg/kg) or 0.75 units/kg of human insulin, respectively. Plasma glucagon and insulin were measured using a mouse endocrine LINCOplex kit (Linco Research) following the manufacturer's protocol. To measure the glycogen content in liver, 20–50 mg of tissue was acid-hydrolyzed in 2 m HCl at 95 °C for 2 h and neutralized using 2 m NaOH. The liberated glucose was assayed spectrophotometrically using the glucose reagent (hexokinase method) (Amresco, Solon, OH) following the manufacturer's protocol.
Primary Hepatocytes and Glucose Secretion
Murine hepatocytes were isolated as previously described (36), seeded in 6-well plates at 4 × 10⁵ cells/well in Williams E medium containing 5% FBS and 0.7 mm insulin for 3 h to allow attachment. The cells were washed with PBS and DMEM without glucose and phenol red. Cells were stimulated with 20 nm of glucagon, and medium was collected after 30 min, 1 h, 3 h, and 6 h and stored at −20 °C. To determine the residual glucose concentration in the cells, 2 n ice-cold HCl was added to cells, and lysates were incubated for 2 h at 95 °C followed by neutralization using 2 n NaOH. Glucose concentration in media and lysates were measured using the glucose reagent (hexokinase method) (Amresco, Solo, OH).
LC-MS/MS Analysis of Metabolites
Frozen liver tissue (80–100 mg) was crushed using the CellCrusherTM cryogenic tissue pulverizer under liquid nitrogen, and 1 ml of ice-cold solution of (40% acetonitrile, 40% methanol, and 20% water) was added for metabolite extraction. For cells grown in cell culture plates, metabolites were extracted by adding 1 ml of ice-cold extraction solution (40% acetonitrile, 40% methanol, and 20% water) to the plate, scraping the cells and collecting in 1.5-ml vials (16). Samples were separated twice on a reversed phase HPLC column Inertsil ODS-3 of 4.6-mm internal diameter, 150-mm length, and 3 μm particle size (Dionex Corporation, Sunnyvale, CA) for MS analysis in positive and negative modes. The eluted metabolites were analyzed at the optimum polarity in MRM mode on electrospray ionization triple-quadrupole mass spectrometer (4000 QTRAP; ABSciex, Toronto, Canada) as previously described (16).
Glucagon Signaling
Primary hepatocytes seeded on 24-well plates at a density of 1 × 10⁵cells/ml were cultured in Williams E medium without FBS for 16 h, then supplemented with 100 μmol/liter isomethyl butyl xanthine containing 0, 0.01, 0.1, 1.0, 10, 100, or 1000 nm glucagon, and incubated for 10 min at 37 °C. The reaction was stopped with ice-cold ethanol, and cAMP was measured by radioimmunoassay kit or targeted mass spectrometry using electrospray ionization triple-quadrupole ABSciex 4000 QTRAP (LC-MS/MS).
HEK293 Flp-In-TREx cells were purchased from Invitrogen and maintained in DMEM (Sigma) supplemented with 10% FBS, 2 mm Gln, penicillin/streptomycin, 3 μg/ml blastocidin, and 100 μg/ml Zeocin. Human Mgat5 cDNA was FLAG-tagged at the N terminus and cloned into the pcDNA5/FRT/TO expression vector. The plasmid was integrated into the genome at a preintegrated FRT recombination site, by cotransfection with Flp recombinase encoding POG44 plasmid, using Lipofectamine (Invitrogen) and OptiMEM medium lacking FBS or antibiotics. Following selection in 200 μg/ml of hygromycin, clones displayed 5–10-fold increase in Mgat5 enzyme activity when induced by 1 μg/ml tetracycline for 24 h. For Gcgr signaling in HEK293 Flp-In-TREx cells were transfected with 1 μg of Gcgr plasmid DNA using Lipofectamine 2000 reagent (Invitrogen). The next day cells were incubated with medium containing 1 μg/ml tetracycline and GlcNAc as indicated for 24 h. Cells were stimulated with glucagon as described, and cAMP was measured by targeted LC/MS-MS.
Membrane Preparation and Competitive Glucagon Binding Assay
Plasma membranes were prepared from primary hepatocytes using a cell surface isolation kit (Pierce) following the manufacturer's protocol. Plasma membrane preparation were analyzed via Western blot, and the ImageJ software was used to quantify signal intensity (37). For liver membrane preparations, ∼2 g of liver tissue were homogenized in 15 ml of 0.32 m sucrose solution at 4 °C using a Teflon tissue grind tube SZ23 (Kontess Class Co., Vinland, NJ). Homogenates were centrifuged at 4 °C for 10 min at 600 × g. The supernatant was transferred to an ultra-clear ultracentrifuge tube (25 × 89 mm; Beckmann Coulter, Inc., Brea, CA) and underlayed with 15 ml of a 41% sucrose solution, followed by centrifugation at 100,000 × g for 17 h at 4 °C. Membranes were collected at the interface and washed twice with 15 ml of 50 mm Tris/HCl buffer, pH 7.5, and protein concentration was measured using the Pierce BCA protein assay kit (Thermo Scientific, Rockford, IL).
125I-Labeled glucagon (50,000 cpm; PerkinElmer Life Sciences) was diluted in 100 μl of buffer. 40 μg of membrane preparation was dissolved in 200 μl buffer (25 mm HEPES, 2.5 mm CaCl2, 1.0 mm MgSO4, 0.05% bacitracin, 2% BSA, 0.003% Tween 20). Tracer, membrane preparation, and 200 μl of glucagon solution at a final concentration from 10−12 to 10−6 m were incubated for 1 h at room temperature. To measure nonspecific binding, 1 mm nonlabeled glucagon was added to control samples. Binding reaction was stopped with 3 ml of buffer and immediately filtered through glass microfiber filters (Whatman GF/B). Filters were washed twice, and radioactivity was measured in a γ-scintillation counter. Experiments were carried out in duplicate with four independent liver membrane preparations. Insulin binding was measured with 125I-labeled insulin (50,000 cpm; PerkinElmer Life Sciences) in 100 μl of buffer incubated with 40 μg of membrane preparation (200 μl).
Expression Vectors
Mouse Gcgr (NCBI clone NM_008101.2) was subcloned via EcoRI and HindIII restriction sites into a pcDNA3 (−) vector (Invitrogen). An internal FLAG tag (DYKDDDK) followed by a linker sequence containing four glycine residues were inserted at the N terminus of the Gcgr after the putative cleavage signal site at amino acid 27 using a double-joint PCR strategy (38). To generate a construct with an internal GFP tag or FLAG tag, the same double-joint PCR strategy was applied. GFP-Gcgr was subcloned into pEGFP-C1 vector with restriction enzymes AgeI and EcoRI. The glycosylation site mutants of Gcgr (i.e. N47Q, N60Q, N75Q, N79Q, and N118Q) were generated using site-directed mutagenesis. Mouse galectin-9 coding sequence (NCBI clone NM_001159301.1) was subcloned via Xho and EcoRI into pERFP-C1 vector (Clontech).
Western Blotting and Immunoprecipitation
Endogenous Gcgr was detected with ST-18 antibody (39). For chemical cross-linking to detect cell surface galectin and Gcgr, hepatocytes transfected with RFP-galectin-9 overnight were treated with 0.1 mg/ml 3,3′-dithiobis (sulfosuccinimidylpropionate) for 15 min at room temperature. Complexes were pulled down with rabbit anti-RFP antibody and protein G-Sepharose beads (GE Healthcare). For detection of FLAG-Gcgr, the anti-FLAG antibody M2 (Sigma-Aldrich) was used.
For leucoagglutinin (L-PHA) binding, cells in 96-well plates were fixed for 15 min with 4% paraformaldehyde, washed with PBS, and incubated for 1 h at 20 °C in 50 μl of PBS containing 1/5,000 of Hoechst 33342 and 2 μg/ml Alexa Fluor 488-conjugated L-PHA (Invitrogen). After washing with PBS, cell staining was quantified by IN Cell Analyzer 1000 automated fluorescence imaging.
Fluorescence Recovery after Photobleaching (FRAP) Analyses
Primary hepatocytes were seeded on 35-mm glass-bottomed culture dishes and transfected with 1 μg of GFP-Gcgr and/or RFP-galectin-9 using Lipofectamine 2000 reagent. The next morning FRAP analyses was performed at room temperature on a confocal FV1000 Olympus microscope, with a 405-nm laser at full power in a circular region of interest with 50-pixel diameter. Cells were incubated with 30 mm lactose for 4 h prior to the FRAP experiment or overnight with 100 μm castanospermine or 20 mm GlcNAc supplementation in Williams E medium. Fluorescence during recovery was normalized to the pre-bleach intensity, and the data were averaged for a minimum of four to five animals in independent experiments in which 6–10 cells were bleached.
Statistical Analyses
Statistical significance was assessed by one-way or two-way analysis of variance using Bonferroni's multiple comparison post-test and, where appropriate, by Student's t test using GraphPad Prism 5 (GraphPad Software, San Diego, CA). A p value of <0.05 was considered to be statistically significant.
RESULTS
Hypoglycemia and Impaired Glucagon Response in Mgat5−/− Mice
To characterize the metabolic phenotype in Mgat5+/+ and Mgat5−/− mice, blood glucose, glucagon, and insulin levels were measured in 6-month-old male mice. Significantly lower blood glucose was observed in Mgat5−/− mice, in both the fed state and after 5 h and 16 h of fasting, despite a 2-fold increase in serum glucagon levels and a 4-fold reduction in insulin levels in Mgat5−/− mice (Fig. 1, B–D). To examine the dynamics of glucose regulation in vivo, IPGTT and OGTTs were performed in 8–12-month-old male and female mice. Consistent with the propensity for glucose intolerance to increase with age (40), older male C57BL6 Mgat5+/+ mice exhibited a marked glucose intolerance (Fig. 1, E, and F) and impaired insulin sensitivity (Fig. 1G). However, the Mgat5−/− male mice displayed remarkably improved glucose tolerance in both IPGTT and OGTT. In the ITT, blood glucose in Mgat5−/− decreased to levels below those observed in wild type mice, and normalization was delayed, indicating a robust response to insulin but a deficient counter regulatory response to hypoglycemia (Fig. 1G). Indeed, the Mgat5−/− male mice displayed an impaired response in the GC test (Fig. 1H). At 6 months, Mgat5−/− female mice were comparable with wild type, but at 12 months of age also displayed the phenotype of reduced sensitivity to glucagon and improved glucose tolerance (Fig. 2, A–E).
FIGURE 2.

Age dependence of the Mgat5−/− phenotype in female mice. A and B, IPGTT (A) and GC (B) tests in female mice at 6 months of age. C–E, IPGTT (C), ITT (D), and GC (E) tests of the same group of mice at 1 year of age (n = 4–16). Bar graphs show the area under the curve (AUC). The values are expressed as means ± S.E. *, p < 0.05; **, p < 0.01; ***, p < 0.001.
As with human aging (41), older Mgat5+/+ mice exhibited increasing glucose intolerance, which is an important consideration in the natural history of type 2 diabetes. Therefore, IPGTT was performed in older mice to determine when mutant and wild type phenotypes could be distinguished. The mutant phenotype was more severe in older female mice (Fig. 2, A–E). Glucose tolerance was similar in Mgat5+/+ and Mgat5−/− mice at 3 and 4 months of age, whereas by 6 months Mgat5−/− mice displayed significantly improved glucose tolerance relative to Mgat5+/+ littermates (Fig. 3, A–D). In the ITT, blood glucose levels in Mgat5−/− mice dropped below that of controls, although the relative change from basal levels was similar, reflecting a near normal insulin response (Fig. 3E). Importantly, at 6 months of age Mgat5−/− mice displayed a significantly diminished glycemic response to glucagon (Fig. 3F).
FIGURE 3.

Age dependence of the Mgat5−/− phenotype in male mice. A–C, IPGTT of the same group of Mgat5−/− and control mice at 3 (A), 4 (B), and 6 (C) months of age (n = 6–13). E–F, at 6 months of age mice were tested in OGTT (D), ITT (E), and GC tests (F). Bar graphs show the area under the curve (AUC). The values are expressed as means ± S.E. *, p < 0.05; **, p < 0.01; ***, p < 0.001.
The Mgat5−/− defect in glucagon signaling was predicted to qualitatively phenocopy Gcgr−/− mice. Indeed, liver glycogen content in Mgat5−/− mice was increased in the fed state compared with wild type controls (Fig. 4A). Metabolite profiling using targeted LC-MS/MS revealed a significant 2–6-fold increase in hepatic amino acid content in Mgat5−/− liver (Fig. 4B). The glycogenic amino acids Ala, Thr, Gly, Arg, Ser, and Asn were most affected, similar to the metabolic profiles described in Gcgr−/− mice (42). The levels of glycolytic intermediates were reduced, consistent with reduced glucose availability and gluconeogenesis (Fig. 4C). HBP intermediates were also reduced, including UDP-GlcNAc, the donor substrate for N-glycan branching enzymes (Fig. 4D).
FIGURE 4.

Metabolite profiles in male Mgat5+/+ and Mgat5−/− livers. A, hepatic glycogen content in 8–12-month male mice (n = 4–5). B–D, hepatic amino acids (B), glycolysis metabolites (C), and HBP (D) measured by LC-MS/MS (n = 3) and expressed as fold change in mutant relative to wild type. The values are means ± S.E. *, p < 0.05; **, p < 0.01; ***, p < 0.001. The abbreviations used are: F1,6P, fructose 1,6-bisphosphate, 3PG, 3-phosphoglycerate; DHAP, dihydroxyacetone phosphate; G2P, 2-phosphoglycerate; PEP, phosphoenolpyruvate; Pyr, pyruvate; Oxa, oxaloacetate; G6P, glucose 6-phosphate; F6P, fructose 6-phosphate; GlcNAcp, N-acetylglucosamine-phosphate; Sia, sialic acid.
Gcgr in Liver Is Modified by Mgat5
To assess the contribution of Mgat5 activity to N-glycan structures on Gcgr, hepatic lysates were analyzed by gel electrophoresis and Western blotting. Gcgr from Mgat5−/− liver migrated at ∼70 kDa compared with ∼75 kDa in Mgat5+/+ extracts, consistent with the less branched N-glycans caused by an absence of the Mgat5 branch and its extension (Fig. 5A). After removal of N-glycans by peptide N-glycosidase (PNGase F) digestion, Mgat5+/+ and Mgat5−/−Gcgr migrated at an identical molecular mass of ∼50 kDa, confirming that the N-glycans were responsible for the difference observed in apparent molecular mass of Gcgr. Total Gcgr protein levels were similar in Mgat5+/+ and Mgat5−/− livers by Western blotting, suggesting no differences in Gcgr protein expression. FLAG-Gcgr expressed in Mgat5 and Mgat1 mutant CHO cell also indicated that Gcgr is a substrate of Mgat5, and the additional mass is distributed across multiple N-glycan sites (Fig. 5B).
FIGURE 5.
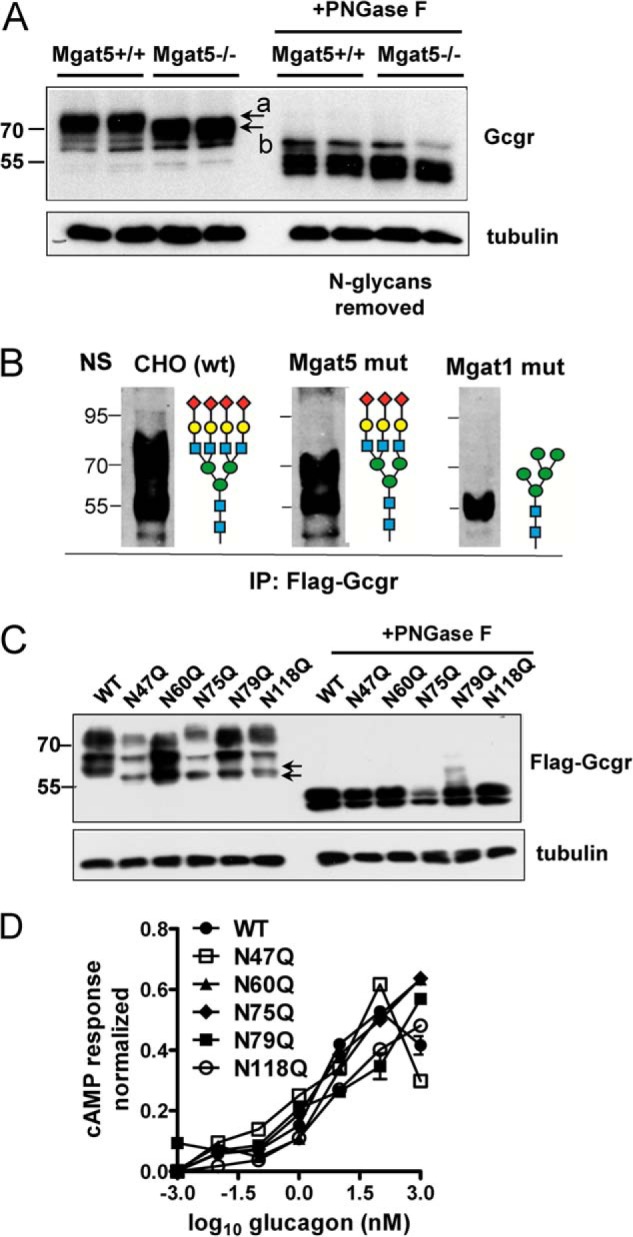
N-Glycosylation and cell surface expression in hepatocytes. A, Western blot analysis of endogenous Gcgr from liver lysates with and without peptide N-glycosidase F (PNGase F) pretreatment of lysates (n = 2). The apparent molecular mass of Gcgr was reduced by ∼5 kDa in Mgat5−/− hepatocytes (arrows marked a and b) consistent with the absence of the Mgat5-dependent β1,6GlcNAc branch and its extension (see Fig. 1A). B, Western blot for FLAG-Gcgr expressed in CHO (wt), Mgat1 (Lec1), and Mgat5 (Lec4) mutants CHO cell lines reveals that both enzymes contribute to N-glycan mass on the receptor. The wild type is N-glycans are preferred substrates for further extension of branches, resulting in the broad distribution of Gcgr in the gel. C, FLAG-Gcgr mutations at each of the five NX(S/T) site were transiently expressed in HEK293 cells and analyzed by Western blotting and anti-FLAG antibodies. Arrows point to early intermediates of Gcgr processing, where a shift is apparent, consistent with loss of single sites in the mutants. D, activity of FLAG-Gcgr mutants was measured by transient transfection in HEK293 cells, and after 48 h, cells were stimulated with glucagon for 10 min. cAMP was measured by LC-MS/MS, and the results were expressed a fraction of the response to forskolin, a chemical activator of adenylyl cyclase. IP, immunoprecipitation.
N-Glycan multiplicity (NX(S/T) sites per glycoprotein) increases affinity for lectins with functional consequences, as reported for ER chaperones calnexin and calreticulin, and the galectins at the cell surface (12, 43). To determine whether each of the five NX(S/T) sites in murine Gcgr are occupied by N-glycans, the sites were individually mutated from asparagine to glutamine. FLAG-Gcgr mutants and wild type FLAG-Gcgr were transiently expressed in HEK293 cells, and protein lysates were analyzed via Western blotting. All N-glycosylation site mutants displayed a small reduction in molecular mass for the lower molecular mass, pre-Golgi form of the glycoprotein, suggesting all five NX(S/T) sites carry N-glycans (Fig. 5C). The Golgi modifications generate size heterogeneity and contribute to the higher molecular mass forms of the receptor. Removal of N-glycans with peptide N-glycosidase treatment resulted in migration at the same molecular mass (∼50 kDa) for wild type and single-site mutants. The wild type and single site N-glycosylation mutants (N47Q, N60Q, N75Q, N79Q, and N118Q) expressed in HEK293 cells displayed similar cAMP response under glucagon stimulation, suggesting that individually, sites were not essential for folding in the ER nor for receptor activation (Fig. 5D). Therefore, N-glycan branching and functionality may be distributed over multiple sites.
Gcgr Signaling Is Impaired in Mgat5−/− Hepatocytes
Next we compared Gcgr signaling and glucose production in primary hepatocytes from Mgat5−/− and Mgat5+/+mice. Mgat5−/− hepatocytes were less sensitive to glucagon-induced activation of adenylyl cyclase, with a log EC50 of 1.016 ± 0.206 nm compared with 0.475 ± 0.247 in Mgat5+/+ hepatocytes. Maximum stimulation was also reduced by 40% (20.93 ± 1.36 and 33.61 ± 2.73 nm and 33.61 ± 2.73 nm) (Fig. 6A). Direct stimulation of adenylyl cyclase by forskolin treatment increased cAMP to similar levels in mutant and wild type hepatocytes, indicating that the Mgat5−/− deficiency is upstream of adenylyl cyclase (Fig. 6B). Glucagon-stimulated production and secretion of glucose was reduced in Mgat5−/− hepatocytes (Fig. 6C), whereas intracellular levels were not reduced (Fig. 6D). Glucose inside the cells during the initial 1 h of glucagon treatment declined at a similar rate, suggesting that secretion was not impaired in Mgat5−/− hepatocytes, but rather Gcgr-driven gluconeogenesis was reduced.
FIGURE 6.

Glucagon signaling in primary hepatocytes. A, glucagon-dependent induction of cAMP in hepatocytes. B, cAMP concentrations following 100 μm forskolin stimulation of adenylyl cyclase for 10 min (n = 7–9). C and D, glucose secretion by primary hepatocytes stimulated with 20 nm glucagon for the indicated times (C) and glucose remaining in the cell lysate (D) (n = 6–7). The values are expressed as means ± S.E. *, p < 0.05; **, p < 0.01; ***, p < 0.001.
Gcgr Binds Galectin-9
In tumor cells, the branching of N-glycans on EGF and TGF-β receptors drives affinity for galectins that restrict mobility at the cell surface and promote sensitivity to ligand (44). Therefore, we first compared Gcgr expression at the cell surface in primary hepatocytes by chemical tagging of surface proteins with biotin and affinity purification on streptavidin beads. Western blotting revealed similar amounts of biotinylated Gcgr on Mgat5+/+ and Mgat5−/− hepatocytes (Fig. 7, A and B). However, Gcgr in liver membrane preparations from Mgat5−/− exhibited reduced affinity in a competitive glucagon binding assay (Fig. 7C). Maximal binding was reduced by 18% and affinity for glucagon was also reduced from 1.17 × 10⁻¹⁰ m in Mgat5+/+ to 1.33 × 10⁻⁹ m in Mgat5−/−. Insulin binding was also measured and found to be similar in Mgat5+/+ and Mgat5−/− membrane preparations (Fig. 7D).
FIGURE 7.

Characterization of hepatocyte Gcgr. A, cell surface biotinylated Gcgr in extracts of Mgat5+/+ and Mgat5−/− hepatocytes (n = 3) by Western blotting with anti-Gcgr antibody. B, quantification of Gcgr normalized to cadherin (means ± S.E.). ns, not significant. C, competitive glucagon binding assays with Mgat5+/+ and Mgat5−/− liver membrane preparations (n = 4) and Gcgr−/− liver membranes (n = 2). Curve fitting R2 > 0.91 and 95% confidence intervals suggesting affinities were nonoverlapping. D, insulin binding assay with membrane preparations from Mgat5−/− and control mice to determine quality of membranes as described under “Experimental Procedures.” The data are mean values ± S.E. max., maximum. E, gene array data of galectin gene family expression in mouse liver generated by the Consortium of Functional Glycomics and reproduced with permission from Dr. J. Esko (45). F, immunoprecipitation (IP) of RFP-galectin-9 transiently expressed in primary hepatocytes, pretreated with (+) or without (−) lactose. Western blots probed for Gcgr, RFP-galectin-9 complex, and galectin-9.
The galectin-9 gene is more highly expressed in liver than other members of the galectin family, making it a likely candidate for interaction with Gcgr (45) (Fig. 7E). Therefore, RFP-galectin-9 was expressed in primary hepatocytes, followed by cross-linking, and protein complexes were captured on anti-RFP antibody-coated beads. Endogenous Gcgr was present in the RFP-galectin-9 captured glycoproteins and to a greater extent in Mgat5+/+ than Mgat5−/−(Fig. 7F). Pretreatment of the hepatocytes with lactose, a competitive inhibitor of galectin binding, reduced Gcgr-RFP-galectin-9 association, confirming that the carbohydrate-reactive domain of galectin-9 is required for this interaction.
Gcgr Dynamics Are Dependent on N-Glycan Branching, HBP, and Galectin-9
Branched N-glycans on glycoproteins are the major ligands for galectin binding at the cell surface (46). FRAP has previously been used to measure the interaction of EGF receptor with galectin-3 on tumor cells (47). The strength of the interaction is proportional to the half-time of recovery after photobleaching (t½). FRAP analyses were performed on GFP-Gcgr expressed in primary hepatocytes from Mgat5−/− and Mgat5+/+ mice (Fig. 8, A and B). GFP-Gcgr showed similar maximal recovery after photobleaching, but recovery was faster (i.e. lower t½) in Mgat5−/− cells, indicating greater mobility compared with Mgat5+/+ (Fig. 8C). Treatment of cells with lactose, a competitive inhibitor of galectin-binding, reduced t½ in Mgat5+/+ cells (Fig. 8, D and E). Similarly, inhibition of N-glycan branching with the α-glucosidase I/II inhibitor castanospermine decreased t½ in Mgat5+/+cells. Lactose and castanospermine did not further reduce t½ in the Mgat5−/−cells. Coexpression of galectin-9 with GFP-Gcgr increased t½, indicting decreased receptor mobility by ∼2-fold in both Mgat5+/+ and Mgat5−/− hepatocytes relative to their respective controls (Fig. 8, D and E). This is consistent with galectin-9 binding to Gcgr and presumably other glycoproteins at the cell surface with graded affinities proportional to branching.
FIGURE 8.

FRAP analysis of GFP-Gcgr mobility in Mgat5+/+ and Mgat5−/− mice primary hepatocytes. A, images taken from a time-lapsed series showing the target areas marked by the red squares before photobleaching (prebleach), immediately after photobleaching (bleach), and after recovery (55s). B, time course of fluorescence recovery normalized to the pre-bleach intensity and graphed as fractional total recovery (n = 5). C, bar graph of t½ for recovery (means ± S.E.). *, p < 0.05; **, p < 0.01; ***, p < 0.001. D and E, FRAP analysis of GFP-Gcgr transiently expressed in primary hepatocytes. Cells were treated as indicated with either 30 mm lactose, 100 μm castanospermine, and 20 mm GlcNAc prior to FRAP analyses or cotransfected with RFP-galectin-9 as described under “Experimental Procedures.” FRAP half-life (t½) represents a minimum of four or five animals in independent experiments in which 6–10 cells were bleached. The values are expressed as means ± S.E. *, p < 0.05; **, p < 0.01; ***, p < 0.001.
In immortalized cells and primary T cells, flux through the HBP and/or salvage of GlcNAc have been shown to increase intracellular UDP-GlcNAc levels, N-glycan branching, and receptor retention at the cell surface (14, 48). To explore this possibility for Gcgr, primary hepatocytes were supplemented with GlcNAc for 16 h prior to FRAP analysis. GlcNAc increased receptor t½ for both Mgat5−/− and Mgat5+/+ cells and hence decreased receptor mobility (Fig. 8, D, and E). Castanospermine treatment completely blocked the effects of GlcNAc supplementation on GFP-Gcgr mobility, confirming that GlcNAc strengthens galectin-glycoprotein interactions by enhancing N-glycan branching. The combination of galectin-9 expression and GlcNAc supplementation did not show an additive effect in Mgat5+/+, but a small enhancement over galectin-9 alone was observed for Mgat5−/− cells (Fig. 8, D and E), consistent with the expectation that N-glycan branching is more limiting in the mutant.
GlcNAc also enhanced glucagon-dependent stimulation of adenylyl cyclase in primary hepatocytes from Mgat5−/− mice but with less effect in Mgat5+/+ (Fig. 9A). The Mgat5 deficiency also results in increased salvage into GlcNAc-P (12), possibly reflecting feedback in the hypoglycemic state that normally increases HBP flux to N-glycan branching and enhanced Gcgr sensitivity (Fig. 9B). UDP-GlcNAc was increased by 5–7-fold in both mutant and wild type cells (Fig. 9B). GlcNAc ineffectiveness on Gcgr signaling in Mgat5+/+hepatocytes suggests negative feedback that normally opposes hyper-responsiveness to Gcgr.
FIGURE 9.

Gcgr signaling is dependent on N-glycan branching and HBP. A, cAMP levels in primary hepatocytes pretreated overnight with and without 20 mm GlcNAc and then stimulated with 10 nm glucagon or 100 μm forskolin for 10 min as described under “Experimental Procedures.” cAMP levels are normalized to nontreated hepatocytes and expressed as mean fold change ± S.E. *, p < 0.05; **, p < 0.01; ***, p < 0.001 (n = 5). B, HBP metabolites in Mgat5+/+ and Mgat5−/− hepatocytes with and without GlcNAc treatment were measured by LC-MS/MS. C, HEK293 cells with a FlpInTRex integrated tetracycline-inducible human Mgat5 were transiently transfected with Gcgr. After 48 h with or without 1 μg/ml tetracycline (Tet) and 20 mm GlcNAc treatment, cells were stimulated with 10 nm glucagon for 10 min, and cAMP was measured by LC-MS/MS. D, HBP metabolites in HEK293 tetracycline-inducible Mgat5 cells measured by LC-MS/MS. E, Mgat5-dependent N-glycan branching measured by Phaseolus vulgaris leucoagglutinin (L-PHA) lectin staining.
To reconstruct the molecular interactions between HBP and Mgat5 in an independent cell line, HEK293 cells with a tetracycline-inducible Mgat5 transgene were transiently transfected with a Gcgr expression vector. In these cells, glucagon-dependent stimulation of adenylyl cyclase was enhanced by GlcNAc supplementation alone, and tetracycline-induced Mgat5 had an additive effect (Fig. 9C). GlcNAc supplementation increased intracellular UDP-GlcNAc as observed in hepatocytes and increased Mgat5-dependent branching in a synergistic manner detected via Phaseolus vulgaris L-PHA staining of the cell surface (Fig. 9, D and E). Induced Mgat5 expression alone did not increase Gcgr activity, suggesting that UDP-GlcNAc supply is a limiting factor for the branching pathway and acts cooperatively with Mgat5. This relationship is consistent with results in primary hepatocytes (Fig. 9, C–E).
GlcNAc Supplementation Rescues Sensitivity to Glucagon in Mgat5−/− Mice
GlcNAc supplementation in the drinking water of mice increases N-glycan branching on T cell receptors and regulates sensitivity to autoimmune antigens (49). Therefore, we tested whether GlcNAc in the drinking water (0.5 mg/ml) could increase Gcgr sensitivity. This dose of GlcNAc was <1% of carbohydrate equivalents in the mouse diet. Moreover, catabolism of GlcNAc-6-P by deacetylase activity is very low or absent in mammalian cells (14). Thus salvaged GlcNAc contributes to the UPD-GlcNAc pool and downstream effector pathways rather than to the glucose pool (16). Because Mgat5−/− mice are hypoglycemic and resistant to weight gain on a high fat diet (29), we reasoned that rescue by GlcNAc may be more robust on a calorie-enriched diet. Mice were maintained on GlcNAc from weaning to 8 months of age, when GC and glucose tolerance were measured. GlcNAc supplementation resulted in a significantly improved response to glucagon in Mgat5−/− mice but little effect in Mgat5+/+ mice (Fig. 10, A and B). GlcNAc did not alter IPGTT in either genotype, indicating that supplementation did not cause insulin resistance (Fig. 10, C and D). UDP-GlcNAc and GlcNAc-P levels were increased in Mgat5−/− liver, consistent with enhanced HBP-dependent positive feedback in mutant mice (Fig. 10, E and F). The same trend in Mgat5+/+ did not reach significance. Hepatic glucose-P and fructose-P levels were increased in Mgat5−/− mice by GlcNAc, which is a reversal of the Mgat5−/− mutant phenotype (Figs. 10F and 4D).
FIGURE 10.

GlcNAc supplementation enhances the glucagon response in vivo. A–D, GC tests (A and B) and IPGTT (C and D) at 8 months of age. Bar graphs show the area under the curve (AUC). The values are expressed as means ± S.E. *, p < 0.05; **, p < 0.01; ***, p < 0.001. Mgat5+/+ and Mgat5−/− male mice at 3 weeks of age were provided a high fat diet ± GlcNAc in the drinking water as described under “Experimental Procedures” (n = 3–5 per group). E and F, hepatic metabolite levels normalized to nontreated animals, and the y axis is plotted as fold change. The values are expressed as means ± S.E. (n = 3–5 mice). *, p < 0.05 by Student's t test, and the treated and control in both genotype differed (p < 0.003 by two-way analysis of variance).
DISCUSSION
In this report, we tested the hypothesis that Gcgr sensitivity is dependent on modification by Mgat5 and more broadly, the N-glycan branching pathway. We demonstrate that Mgat5−/− mice are hypoglycemic, display improved glucose tolerance, and display decreased sensitivity to glucagon. HBP and glycolytic metabolites were decreased, whereas glycogen storage and free amino acids were increased in Mgat5−/−livers, a regulatory imbalance similar to that reported for Gcgr−/− mice (42). The Mgat5−/− mice displayed a remarkably similar glucoregulatory phenotype to mice deficient in either glucagon processing or Gcgr signaling (3, 30, 31). Furthermore, experiments with primary hepatocytes confirmed that glucagon-dependent cAMP signaling is impaired, and gluconeogenesis is reduced by the Mgat5 deficiency. Reduced hepatic catabolism of amino acids and glycogen may also contribute to lower glucose production and systemic hypoglycemia. The EC50 for glucagon-dependent activation of adenylyl cyclase was increased ∼4-fold in Mgat5−/− primary cells. Plasma membrane levels of Gcgr were similar, but glucagon binding sites were reduced by 18%, and affinity was reduced ∼10-fold in Mgat5−/− membrane preparations. GlcNAc supplementation and Mgat5 and N-glycan branching were shown to promote Gcgr association with galectin-9, which slows receptor mobility and enhances sensitivity to glucagon in primary hepatocytes. Finally, GlcNAc supplementation in the drinking water rescued glucagon sensitivity in Mgat5−/− mice, concordant with the GlcNAc rescue of Gcgr signaling and dynamics in cultured primary hepatocytes. Importantly, GlcNAc supplementation did not alter glucose tolerance in either wild type or mutant mice, suggesting that insulin action was not impaired by GlcNAc. The results suggest a model for metabolic feedback through HBP and N-glycan branching in the regulation of Gcgr (Fig. 11).
FIGURE 11.
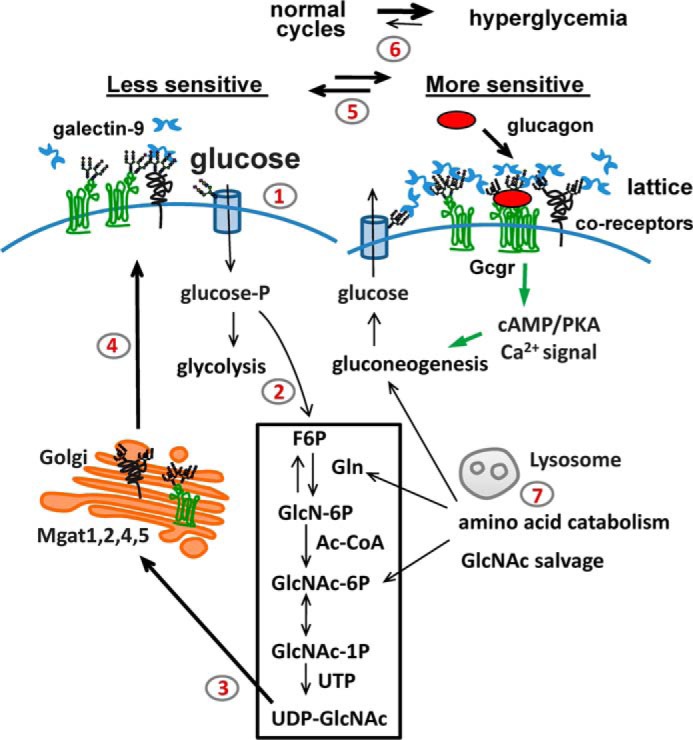
A model of metabolic feedback via HBP and N-glycan branching. Steps 1 and 2, in the fed state, hepatic glucose transport into the cell (step 1) and flux to HBP (step 2) increase intracellular UDP-GlcNAc supply to the medial Golgi. Step 3, UDP-GlcNAc is a rate-limiting substrate for the Mgat enzymes. Step 4, N-glycan branching on Gcgr and other glycoproteins increases (left to right). Step 5, equilibrium shifts in a cyclical manner with feeding and fasting. Mgat5 N-glycan branching enhances galectin-9 binding and sensitivity to glucagon. The galectin lattice may promote Gcgr receptor dimerization and/or recruit coreceptors. Increasing Gcgr sensitivity during feeding may be an adaptation that precedes and anticipates fasting in the normal feeding/fasting cycles. Step 6, increasing Gcgr sensitivity may contribute to glucagon signaling in the hyperglycemic state of diabetes. Step 7, high protein diet or salvage of amino acids during starvation may support UDP-GlcNAc concentrations and Gcgr sensitivity.
Experimental deletion of the N-glycosylation sites in Gcgr, GIP, and GLP-1 receptors blocks protein expression at the cell surface (50, 51), which is likely due to receptor instability or misfolding. The removal of NX(S/T) (where X ≠ P) sites is a blunt instrument that precludes the analysis of Golgi N-glycan remodeling pathways. The present study is the first to reveal that N-glycan remodeling is an effector downstream of HBP that regulates responsiveness of a critical receptor in glucose homeostasis. Individual sites in Gcgr were not critical, because mutation of each site did not disrupt receptor activities measured in HEK293 cells. This suggests that functionality of N-glycan branching may be cumulative and distributed over the five sites in Gcgr.
We show that galectin-9 binds to Gcgr and slows receptor mobility, with a dependence on Mgat5 activity and UDP-GlcNAc supply to the N-glycan branching pathway. Galectin-9 binding promotes cross-linking of glycoproteins and may facilitate Gcgr dimerization (52) or association with other glycoproteins. Dimerization of the GLP-1R promotes coupling with G protein-coupled receptors and sensitivity to ligand (53). All nine mammalian adenylyl cyclases share conserved N-glycosylation sites in extracellular loops 5 and 6 (54). N-Glycosylation of adenylyl cyclase 8 is required to target the enzyme into lipid raft domains (55), and Golgi modifications may play a role in efficient coupling of this adenylyl cyclase with Gcgr. RAMP-2 (receptor activity-modifying protein 2) is another transmembrane glycoprotein shown to be associated with Gcgr (56). It is likely that galectin-9 slows down not only the mobility of Gcgr but also other glycoproteins and regulates signaling efficiency. Thus galectin-9 binding to branched N-glycan on Gcgr may slow mobility and thereby enhance interactions with other regulatory glycoproteins. It is also possible that branched N-glycans interact within the receptor fold to enhance dimerization and/or affinity for ligand (57).
In the absence of Mgat5, compensating amounts of N-acetyllactosamine (Galβ1–4GlcNAcβ) branches can be made by Mgat1, Mgat2, and Mgat4 when supplied with GlcNAc (12, 58), which is converted into UDP-GlcNAc. Indeed, glucagon sensitivity in Mgat5−/− mice was rescued by GlcNAc supplied in the drinking water. GlcNAc supplementation at 0.5 mg/ml increased liver HBP metabolites in Mgat5−/− mice and rescued Gcgr membrane dynamics, as well as cAMP signaling in cultured primary hepatocytes. The interaction between Mgat5, UDP-GlcNAc, Gcgr, and cAMP signaling was engineered into HEK293 cells and found to be very similar to primary hepatocytes. Gcgr sensitivity to glucagon was highest when Mgat5 was induced in the presence of GlcNAc supplementation. Mgat5 has a low affinity for UDP-GlcNAc (Km = ∼10 mm) relative to Mgat1, Mgat2, and Mgat4. Therefore, Mgat5 activity is highly dependent on UDP-GlcNAc concentration and enzyme levels. Conversely, expression of Mgat5 is relatively low in liver compared with intestine and brain (59), suggesting that regulation of branching may be highly dependent on HBP and central metabolites. Mgat5 gene expression is stimulated by hepatic stress and growth factor-dependent activation of Ets transcription factors (60, 61). In β-cells, Mgat4a gene expression is inhibited by the Foxa2 transcription factor under replete conditions (62). Hepatic Foxa2 is activated downstream of glucagon signaling (fasting) and inhibited by insulin-Pi3k-Akt signaling (63). Additional studies are needed to map interactions between the expression of the Mgat genes and metabolite sensing both β-cells and hepatocytes.
Transgenic mice overexpressing the HBP enzyme, glutamine:fructose-6-phosphate amidotransferase in liver display obesity, glucose intolerance, and insulin resistance after 8 months of age (64). Here we have extended these observations by identifying the Golgi N-glycan branching pathway as an effector downstream of HBP that adapts hepatocyte responsiveness to glucagon. In addition to Gcgr, many other glycoproteins are known to be substrates for Mgat5 modification (65) and may contribute to glucose regulation. For example, TGF-β receptor II is up-regulated at the cell surface by HBP and Mgat5 in cultured cells (12, 44). TGF-β/Smad3 signaling regulates glucose homeostasis, and Smad3−/− mice have a phenotype similar to that of Mgat5−/− (66). As discussed earlier, GLUT-1, -2, and -4 glucose transporters are up-regulated at the cell surface by N-glycan branching (12, 20, 27, 28). Herein we have focused on Gcgr, because the action of glucagon is critically important for the development of hyperglycemia and insulin resistance (1, 2). Hence, selective reduction of Mgat5 activity or HBP in the liver may represent a novel approach for suppression of glucagon action and restoration of euglycemia in the setting of type 2 diabetes.
Acknowledgments
We thank Cecilia Unson for the ST-18 antibody and Cecile Boscher and Oliver Rocks for experiment advice.
This work was supported by Ontario Research Fund Grant GL-2, Canadian Institutes for Health Research Grants MOP-79405 and MOP-62975, Grant s from the Canada Research Chairs Program (to J. W. D. and D. J. D.), Canadian Institutes for Health Research Grants MOP-93749 and MOP-123391 (to D. J. D.), the Banting & Best Diabetes Centre (BBDC)-Novo Nordisk Chair in Incretin Biology (to D. J. D.), and Canadian Liver Foundation Graduate Studentship (to M. R.).
- HBP
- hexosamine biosynthesis pathway
- ER
- endoplasmic reticulum
- Glut
- glucose transporter
- Gcgr
- glucagon receptor
- L-PHA
- leucoagglutinin
- IPGTT
- intraperitoneal glucose tolerance test
- OGTT
- oral glucose tolerance test
- GC
- glucagon challenge
- ITT
- insulin tolerance test.
REFERENCES
- 1. Ali S., Drucker D. J. (2009) Benefits and limitations of reducing glucagon action for the treatment of type 2 diabetes. Am. J. Physiol. Endocrinol. Metab. 296, E415–E421 [DOI] [PubMed] [Google Scholar]
- 2. Unger R. H., Cherrington A. D. (2012) Glucagonocentric restructuring of diabetes: a pathophysiologic and therapeutic makeover. J. Clin. Invest. 122, 4–12 [DOI] [PMC free article] [PubMed] [Google Scholar]
- 3. Conarello S. L., Jiang G., Mu J., Li Z., Woods J., Zycband E., Ronan J., Liu F., Roy R. S., Zhu L., Charron M. J., Zhang B. B. (2007) Glucagon receptor knockout mice are resistant to diet-induced obesity and streptozotocin-mediated beta cell loss and hyperglycaemia. Diabetologia 50, 142–150 [DOI] [PubMed] [Google Scholar]
- 4. Lee Y., Berglund E. D., Wang M. Y., Fu X., Yu X., Charron M. J., Burgess S. C., Unger R. H. (2012) Metabolic manifestations of insulin deficiency do not occur without glucagon action. Proc. Natl. Acad. Sci. U.S.A. 109, 14972–14976 [DOI] [PMC free article] [PubMed] [Google Scholar]
- 5. Hancock A. S., Du A., Liu J., Miller M., May C. L. (2010) Glucagon deficiency reduces hepatic glucose production and improves glucose tolerance in adult mice. Mol. Endocrinol. 24, 1605–1614 [DOI] [PMC free article] [PubMed] [Google Scholar]
- 6. Vuguin P. M., Kedees M. H., Cui L., Guz Y., Gelling R. W., Nejathaim M., Charron M. J., Teitelman G. (2006) Ablation of the glucagon receptor gene increases fetal lethality and produces alterations in islet development and maturation. Endocrinology 147, 3995–4006 [DOI] [PMC free article] [PubMed] [Google Scholar]
- 7. Youk H., van Oudenaarden A. (2009) Growth landscape formed by perception and import of glucose in yeast. Nature 462, 875–879 [DOI] [PMC free article] [PubMed] [Google Scholar]
- 8. Thevelein J. M., Voordeckers K. (2009) Functioning and evolutionary significance of nutrient transceptors. Mol. Biol. Evol. 26, 2407–2414 [DOI] [PubMed] [Google Scholar]
- 9. Dennis J. W., Nabi I. R., Demetriou M. (2009) Metabolism, cell surface organization, and disease. Cell 139, 1229–1241 [DOI] [PMC free article] [PubMed] [Google Scholar]
- 10. Wellen K. E., Hatzivassiliou G., Sachdeva U. M., Bui T. V., Cross J. R., Thompson C. B. (2009) ATP-citrate lyase links cellular metabolism to histone acetylation. Science 324, 1076–1080 [DOI] [PMC free article] [PubMed] [Google Scholar]
- 11. Cooksey R. C., McClain D. A. (2002) Transgenic mice overexpressing the rate-limiting enzyme for hexosamine synthesis in skeletal muscle or adipose tissue exhibit total body insulin resistance. Ann. N.Y. Acad. Sci. 967, 102–111 [DOI] [PubMed] [Google Scholar]
- 12. Lau K. S., Partridge E. A., Grigorian A., Silvescu C. I., Reinhold V. N., Demetriou M., Dennis J. W. (2007) Complex N-glycan number and degree of branching cooperate to regulate cell proliferation and differentiation. Cell 129, 123–134 [DOI] [PubMed] [Google Scholar]
- 13. Metallo C. M., Vander Heiden M. G. (2010) Metabolism strikes back: metabolic flux regulates cell signaling. Genes Dev. 24, 2717–2722 [DOI] [PMC free article] [PubMed] [Google Scholar]
- 14. Wellen K. E., Lu C., Mancuso A., Lemons J. M., Ryczko M., Dennis J. W., Rabinowitz J. D., Coller H. A., Thompson C. B. (2010) The hexosamine biosynthetic pathway couples growth factor-induced glutamine uptake to glucose metabolism. Genes Dev. 24, 2784–2799 [DOI] [PMC free article] [PubMed] [Google Scholar]
- 15. Denzel M. S., Storm N. J., Gutschmidt A., Baddi R., Hinze Y., Jarosch E., Sommer T., Hoppe T., Antebi A. (2014) Hexosamine pathway metabolites enhance protein quality control and prolong life. Cell 156, 1167–1178 [DOI] [PubMed] [Google Scholar]
- 16. Abdel Rahman A. M., Ryczko M., Pawling J., Dennis J. W. (2013) Probing the hexosamine biosynthetic pathway in human tumor cells by multitargeted tandem mass spectrometry. ACS Chem. Biol. 8, 2053–2062 [DOI] [PubMed] [Google Scholar]
- 17. Yang X., Ongusaha P. P., Miles P. D., Havstad J. C., Zhang F., So W. V., Kudlow J. E., Michell R. H., Olefsky J. M., Field S. J., Evans R. M. (2008) Phosphoinositide signalling links O-GlcNAc transferase to insulin resistance. Nature 451, 964–969 [DOI] [PubMed] [Google Scholar]
- 18. Dentin R., Hedrick S., Xie J., Yates J., 3rd, Montminy M. (2008) Hepatic glucose sensing via the CREB coactivator CRTC2. Science 319, 1402–1405 [DOI] [PubMed] [Google Scholar]
- 19. Slawson C., Copeland R. J., Hart G. W. (2010) O-GlcNAc signaling: a metabolic link between diabetes and cancer? Trends Biochem. Sci. 35, 547–555 [DOI] [PMC free article] [PubMed] [Google Scholar]
- 20. Ohtsubo K., Takamatsu S., Minowa M. T., Yoshida A., Takeuchi M., Marth J. D. (2005) Dietary and genetic control of glucose transporter 2 glycosylation promotes insulin secretion in suppressing diabetes. Cell 123, 1307–1321 [DOI] [PubMed] [Google Scholar]
- 21. Macauley M. S., Shan X., Yuzwa S. A., Gloster T. M., Vocadlo D. J. (2010) Elevation of Global O-GlcNAc in rodents using a selective O-GlcNAcase inhibitor does not cause insulin resistance or perturb glucohomeostasis. Chem. Biol. 17, 949–958 [DOI] [PMC free article] [PubMed] [Google Scholar]
- 22. Banerjee S., Vishwanath P., Cui J., Kelleher D. J., Gilmore R., Robbins P. W., Samuelson J. (2007) The evolution of N-glycan-dependent endoplasmic reticulum quality control factors for glycoprotein folding and degradation. Proc. Natl. Acad. Sci. U.S.A. 104, 11676–11681 [DOI] [PMC free article] [PubMed] [Google Scholar]
- 23. Kowarik M., Numao S., Feldman M. F., Schulz B. L., Callewaert N., Kiermaier E., Catrein I., Aebi M. (2006) N-Linked glycosylation of folded proteins by the bacterial oligosaccharyltransferase. Science 314, 1148–1150 [DOI] [PubMed] [Google Scholar]
- 24. Shang J., Gao N., Kaufman R. J., Ron D., Harding H. P., Lehrman M. A. (2007) Translation attenuation by PERK balances ER glycoprotein synthesis with lipid-linked oligosaccharide flux. J. Cell Biol. 176, 605–616 [DOI] [PMC free article] [PubMed] [Google Scholar]
- 25. Dennis J. W., Lau K. S., Demetriou M., Nabi I. R. (2009) Adaptive regulation at the cell surface by N-glycosylation. Traffic 10, 1569–1578 [DOI] [PubMed] [Google Scholar]
- 26. Williams R., Ma X., Schott R. K., Mohammad N., Ho C. Y., Li C. F., Chang B. S., Demetriou M., Dennis J. W. (2014) Encoding asymmetry of the N-glycosylation motif facilitates glycoprotein evolution. PLoS One 9, e86088. [DOI] [PMC free article] [PubMed] [Google Scholar]
- 27. Kitagawa T., Tsuruhara Y., Hayashi M., Endo T., Stanbridge E. J. (1995) A tumor-associated glycosylation change in the glucose transporter GLUT1 controlled by tumor suppressor function in human cell hybrids. J. Cell Sci. 108, 3735–3743 [DOI] [PubMed] [Google Scholar]
- 28. Haga Y., Ishii K., Suzuki T. (2011) N-Glycosylation is critical for the stability and intracellular trafficking of glucose transporter GLUT4. J. Biol. Chem. 286, 31320–31327 [DOI] [PMC free article] [PubMed] [Google Scholar]
- 29. Cheung P., Pawling J., Partridge E. A., Sukhu B., Grynpas M., Dennis J. W. (2007) Metabolic homeostasis and tissue renewal are dependent on β1,6GlcNAc-branched N-glycans. Glycobiology 17, 828–837 [DOI] [PubMed] [Google Scholar]
- 30. Gelling R. W., Du X. Q., Dichmann D. S., Romer J., Huang H., Cui L., Obici S., Tang B., Holst J. J., Fledelius C., Johansen P. B., Rossetti L., Jelicks L. A., Serup P., Nishimura E., Charron M. J. (2003) Lower blood glucose, hyperglucagonemia, and pancreatic alpha cell hyperplasia in glucagon receptor knockout mice. Proc. Natl. Acad. Sci. U.S.A. 100, 1438–1443 [DOI] [PMC free article] [PubMed] [Google Scholar]
- 31. Sørensen H., Winzell M. S., Brand C. L., Fosgerau K., Gelling R. W., Nishimura E., Ahren B. (2006) Glucagon receptor knockout mice display increased insulin sensitivity and impaired beta-cell function. Diabetes 55, 3463–3469 [DOI] [PubMed] [Google Scholar]
- 32. Mayo K. E., Miller L. J., Bataille D., Dalle S., Göke B., Thorens B., Drucker D. J. (2003) International Union of Pharmacology. XXXV. The glucagon receptor family. Pharmacol. Rev. 55, 167–194 [DOI] [PubMed] [Google Scholar]
- 33. Jiang G., Zhang B. B. (2003) Glucagon and regulation of glucose metabolism. Am. J. Physiol. Endocrinol. Metabol. 284, E671–E678 [DOI] [PubMed] [Google Scholar]
- 34. Cho Y. M., Merchant C. E., Kieffer T. J. (2012) Targeting the glucagon receptor family for diabetes and obesity therapy. Pharmacol. Ther. 135, 247–278 [DOI] [PubMed] [Google Scholar]
- 35. Granovsky M., Fata J., Pawling J., Muller W. J., Khokha R., Dennis J. W. (2000) Suppression of tumor growth and metastasis in Mgat5-deficient mice. Nat. Med. 6, 306–312 [DOI] [PubMed] [Google Scholar]
- 36. Flock G., Baggio L. L., Longuet C., Drucker D. J. (2007) Incretin receptors for glucagon-like peptide 1 and glucose-dependent insulinotropic polypeptide are essential for the sustained metabolic actions of vildagliptin in mice. Diabetes 56, 3006–3013 [DOI] [PubMed] [Google Scholar]
- 37. Schneider C. A., Rasband W. S., Eliceiri K. W. (2012) NIH Image to ImageJ: 25 years of image analysis. Nat. Methods 9, 671–675 [DOI] [PMC free article] [PubMed] [Google Scholar]
- 38. Yu C. E., Devlin B., Galloway N., Loomis E., Schellenberg G. D. (2004) ADLAPH: A molecular haplotyping method based on allele-discriminating long-range PCR. Genomics 84, 600–612 [DOI] [PubMed] [Google Scholar]
- 39. Unson C. G., Cypess A. M., Wu C. R., Goldsmith P. K., Merrifield R. B., Sakmar T. P. (1996) Antibodies against specific extracellular epitopes of the glucagon receptor block glucagon binding. Proc. Natl. Acad. Sci. U.S.A. 93, 310–315 [DOI] [PMC free article] [PubMed] [Google Scholar]
- 40. Goren H. J., Kulkarni R. N., Kahn C. R. (2004) Glucose homeostasis and tissue transcript content of insulin signaling intermediates in four inbred strains of mice: C57BL/6, C57BLKS/6, DBA/2, and 129X1. Endocrinology 145, 3307–3323 [DOI] [PubMed] [Google Scholar]
- 41. Petersen K. F., Befroy D., Dufour S., Dziura J., Ariyan C., Rothman D. L., DiPietro L., Cline G. W., Shulman G. I. (2003) Mitochondrial dysfunction in the elderly: possible role in insulin resistance. Science 300, 1140–1142 [DOI] [PMC free article] [PubMed] [Google Scholar]
- 42. Yang J., MacDougall M. L., McDowell M. T., Xi L., Wei R., Zavadoski W. J., Molloy M. P., Baker J. D., Kuhn M., Cabrera O., Treadway J. L. (2011) Polyomic profiling reveals significant hepatic metabolic alterations in glucagon-receptor (GCGR) knockout mice: implications on anti-glucagon therapies for diabetes. BMC Genomics 12, 281. [DOI] [PMC free article] [PubMed] [Google Scholar]
- 43. Deprez P., Gautschi M., Helenius A. (2005) More than one glycan is needed for ER glucosidase II to allow entry of glycoproteins into the calnexin/calreticulin cycle. Mol. Cell 19, 183–195 [DOI] [PubMed] [Google Scholar]
- 44. Partridge E. A., Le Roy C., Di Guglielmo G. M., Pawling J., Cheung P., Granovsky M., Nabi I. R., Wrana J. L., Dennis J. W. (2004) Regulation of cytokine receptors by Golgi N-glycan processing and endocytosis. Science 306, 120–124 [DOI] [PubMed] [Google Scholar]
- 45. Bishop J. R., Foley E., Lawrence R., Esko J. D. (2010) Insulin-dependent diabetes mellitus in mice does not alter liver heparan sulfate. J. Biol. Chem. 285, 14658–14662 [DOI] [PMC free article] [PubMed] [Google Scholar]
- 46. Patnaik S. K., Potvin B., Carlsson S., Sturm D., Leffler H., Stanley P. (2006) Complex N-glycans are the major ligands for galectin-1, -3, and -8 on Chinese hamster ovary cells. Glycobiology 16, 305–317 [DOI] [PubMed] [Google Scholar]
- 47. Lajoie P., Partridge E. A., Guay G., Goetz J. G., Pawling J., Lagana A., Joshi B., Dennis J. W., Nabi I. R. (2007) Plasma membrane domain organization regulates EGFR signaling in tumor cells. J. Cell Biol. 179, 341–356 [DOI] [PMC free article] [PubMed] [Google Scholar]
- 48. Grigorian A., Lee S.-U., Tian W., Chen I.-J., Gao G., Mendelsohn R., Dennis J. W., Demetriou M. (2007) Control of T cell mediated autoimmunity by metabolite flux to N-glycan biosynthesis. J. Biol. Chem. 282, 20027–20035 [DOI] [PubMed] [Google Scholar]
- 49. Grigorian A., Araujo L., Naidu N. N., Place D. J., Choudhury B., Demetriou M. (2011) N-Acetylglucosamine inhibits T-helper 1 (Th1) / T-helper 17 (Th17) responses and treats experimental autoimmune encephalomyelitis. J. Biol. Chem. 286, 40133–40141 [DOI] [PMC free article] [PubMed] [Google Scholar]
- 50. Unson C. G., Cypess A. M., Kim H. N., Goldsmith P. K., Carruthers C. J., Merrifield R. B., Sakmar T. P. (1995) Characterization of deletion and truncation mutants of the rat glucagon receptor. Seven transmembrane segments are necessary for receptor transport to the plasma membrane and glucagon binding. J. Biol. Chem. 270, 27720–27727 [DOI] [PubMed] [Google Scholar]
- 51. Whitaker G. M., Lynn F. C., McIntosh C. H., Accili E. A. (2012) Regulation of GIP and GLP1 receptor cell surface expression by N-glycosylation and receptor heteromerization. PLoS One 7, e32675. [DOI] [PMC free article] [PubMed] [Google Scholar]
- 52. Schelshorn D., Joly F., Mutel S., Hampe C., Breton B., Mutel V., Lütjens R. (2012) Lateral allosterism in the glucagon receptor family: glucagon-like peptide 1 induces G-protein-coupled receptor heteromer formation. Mol. Pharmacol. 81, 309–318 [DOI] [PubMed] [Google Scholar]
- 53. Harikumar K. G., Wootten D., Pinon D. I., Koole C., Ball A. M., Furness S. G., Graham B., Dong M., Christopoulos A., Miller L. J., Sexton P. M. (2012) Glucagon-like peptide-1 receptor dimerization differentially regulates agonist signaling but does not affect small molecule allostery. Proc. Natl. Acad. Sci. U.S.A. 109, 18607–18612 [DOI] [PMC free article] [PubMed] [Google Scholar]
- 54. Wu G. C., Lai H. L., Lin Y. W., Chu Y. T., Chern Y. (2001) N-Glycosylation and residues Asn805 and Asn890 are involved in the functional properties of type VI adenylyl cyclase. J. Biol. Chem. 276, 35450–35457 [DOI] [PubMed] [Google Scholar]
- 55. Pagano M., Clynes M. A., Masada N., Ciruela A., Ayling L. J., Wachten S., Cooper D. M. (2009) Insights into the residence in lipid rafts of adenylyl cyclase AC8 and its regulation by capacitative calcium entry. Am. J. Physiol. Cell Physiol. 296, C607–C619 [DOI] [PMC free article] [PubMed] [Google Scholar]
- 56. Christopoulos A., Christopoulos G., Morfis M., Udawela M., Laburthe M., Couvineau A., Kuwasako K., Tilakaratne N., Sexton P. M. (2003) Novel receptor partners and function of receptor activity-modifying proteins. J. Biol. Chem. 278, 3293–3297 [DOI] [PubMed] [Google Scholar]
- 57. McElroy C. A., Dohm J. A., Walsh S. T. (2009) Structural and biophysical studies of the human IL-7/IL-7Rα complex. Structure 17, 54–65 [DOI] [PMC free article] [PubMed] [Google Scholar]
- 58. Dennis J. W., Brewer C. F. (2013) Density-dependent lectin-glycan interactions as a paradigm for conditional regulation by posttranslational modifications. Mol. Cell Proteomics 12, 913–920 [DOI] [PMC free article] [PubMed] [Google Scholar]
- 59. Campbell R. M., Metzler M., Granovsky M., Dennis J. W., Marth J. D. (1995) Complex asparagine-linked oligosaccharides in Mgat1-null embryos. Glycobiology 5, 535–543 [DOI] [PubMed] [Google Scholar]
- 60. Buckhaults P., Chen L., Fregien N., Pierce M. (1997) Transcriptional regulation of N-acetylglucosaminyltransferase V by the src oncogene. J. Biol. Chem. 272, 19575–19581 [DOI] [PubMed] [Google Scholar]
- 61. Kang R., Saito H., Ihara Y., Miyoshi E., Koyama N., Sheng Y., Taniguchi N. (1996) Transcriptional regulation of the N-acetylglucosaminyltranserase V gene in human bile duct carcinoma cells (HuCC-T1) is mediated by Ets-1. J. Biol. Chem. 271, 26706–26712 [DOI] [PubMed] [Google Scholar]
- 62. Ohtsubo K., Chen M. Z., Olefsky J. M., Marth J. D. (2011) Pathway to diabetes through attenuation of pancreatic beta cell glycosylation and glucose transport. Nat. Med. 17, 1067–1075 [DOI] [PMC free article] [PubMed] [Google Scholar]
- 63. von Meyenn F., Porstmann T., Gasser E., Selevsek N., Schmidt A., Aebersold R., Stoffel M. (2013) Glucagon-induced acetylation of Foxa2 regulates hepatic lipid metabolism. Cell Metab. 17, 436–447 [DOI] [PubMed] [Google Scholar]
- 64. Veerababu G., Tang J., Hoffman R. T., Daniels M. C., Hebert L. F., Jr., Crook E. D., Cooksey R. C., McClain D. A. (2000) Overexpression of glutamine: fructose-6-phosphate amidotransferase in the liver of transgenic mice results in enhanced glycogen storage, hyperlipidemia, obesity, and impaired glucose tolerance. Diabetes 49, 2070–2078 [DOI] [PubMed] [Google Scholar]
- 65. Abbott K. L., Aoki K., Lim J. M., Porterfield M., Johnson R., O'Regan R. M., Wells L., Tiemeyer M., Pierce M. (2008) Targeted glycoproteomic identification of biomarkers for human breast carcinoma. J. Proteome Res. 7, 1470–1480 [DOI] [PMC free article] [PubMed] [Google Scholar]
- 66. Yadav H., Quijano C., Kamaraju A. K., Gavrilova O., Malek R., Chen W., Zerfas P., Zhigang D., Wright E. C., Stuelten C., Sun P., Lonning S., Skarulis M., Sumner A. E., Finkel T., Rane S. G. (2011) Protection from obesity and diabetes by blockade of TGF-β/Smad3 signaling. Cell Metab. 14, 67–79 [DOI] [PMC free article] [PubMed] [Google Scholar]