

Background: Endosomal cholesterol storage in Niemann-Pick type C1 deficiency is associated with elevated mitochondrial cholesterol and alterations in energy metabolism.
Results: Blocking endosomal cholesterol transport to mitochondria prevented the metabolic alterations in NPC1-deficient cells.
Conclusion: Mitochondrial cholesterol accumulation increases oxidative stress and alters energy metabolism.
Significance: Mitochondrial cholesterol is a regulator of energy metabolism and mitochondrial function.
Keywords: Cholesterol Metabolism, Glucose Metabolism, Glutamine, Oxidative Stress, Respiration, Mitochondrial Cholesterol, Niemann-Pick Type C
Abstract
Niemann-Pick type C1 (NPC1) is a late endosomal transmembrane protein, which, together with NPC2 in the endosome lumen, mediates the transport of endosomal cholesterol to the plasma membrane and endoplasmic reticulum. Loss of function of NPC1 or NPC2 leads to cholesterol accumulation in late endosomes and causes neuronal dysfunction and neurodegeneration. Recent studies indicate that cholesterol also accumulates in mitochondria of NPC1-deficient cells and brain tissue and that NPC1 deficiency leads to alterations in mitochondrial function and energy metabolism. Here, we have investigated the effects of increased mitochondrial cholesterol levels on energy metabolism, using RNA interference to deplete Chinese hamster ovary cells of NPC1 alone or in combination with MLN64, which mediates endosomal cholesterol transport to mitochondria. Mitochondrial cholesterol levels were also altered by depletion of NPC2 in combination with the expression of NPC2 mutants. We found that the depletion of NPC1 increased lactate secretion, decreased glutamine-dependent mitochondrial respiration, and decreased ATP transport across mitochondrial membranes. These metabolic alterations did not occur when transport of endosomal cholesterol to mitochondria was blocked. In addition, the elevated mitochondrial cholesterol levels in NPC1-depleted cells and in NPC2-depleted cells expressing mutant NPC2 that allows endosomal cholesterol trafficking to mitochondria were associated with increased expression of the antioxidant response factor Nrf2. Antioxidant treatment not only prevented the increase in Nrf2 mRNA levels but also prevented the increased lactate secretion in NPC1-depleted cells. These results suggest that mitochondrial cholesterol accumulation can increase oxidative stress and in turn cause increased glycolysis to lactate and other metabolic alterations.
Introduction
Niemann-Pick type C (NPC)2 disease is an autosomal recessive, neurodegenerative disorder caused by loss-of-function mutations in NPC1 or NPC2. NPC1 is a late endosomal transmembrane protein, whereas NPC2 localizes to the endosome lumen. Both NPC1 and NPC2 bind cholesterol and functionally interact to transport cholesterol from endosomes to the plasma membrane and endoplasmic reticulum (1–3). Mutations in either NPC1 or NPC2 lead to cholesterol accumulation in late endosomes and impaired cellular cholesterol homeostasis. Over recent years, it has become apparent that cholesterol also builds up in mitochondria of NPC1-deficient brain, which can affect mitochondrial function (4–6). Thus, mitochondria isolated from NPC1-deficient murine brain are more sensitive to oxidative stress and have decreased rates of ATP synthesis under certain conditions (4, 6, 7). Moreover, mitophagy was impaired in human pluripotent stem cell-derived NPC1-deficient neurons (8). In other model systems, elevated cholesterol levels have been associated with decreased mitochondrial membrane fluidity and permeability and with altered function of mitochondrial transporters (9–13). Our recent metabolomic and gene expression analysis of Npc1−/− murine brain showed significant alterations in energy metabolism and, in particular, suggested impaired pyruvate oxidation, increased glycolysis, and activation of oxidative stress responses in presymptomatic Npc1−/− cerebellum (7). Oxidative stress markers are also elevated in several NPC1-deficient cell and animal models (7, 14–17). Increased mitochondrial cholesterol levels are also observed in several other pathological conditions (13, 18–24).
Here, we have investigated the relationship between mitochondrial cholesterol and mitochondrial function using two approaches to manipulate mitochondrial cholesterol levels based on the cholesterol transport characteristics of NPC1, NPC2, and a third endosomal protein, MLN64. MLN64 is anchored in the late endosomal perimeter membrane and has a cytosolic steroidogenic acute regulatory protein-related lipid transfer domain (START domain), which can bind cholesterol and transfer it to mitochondria (25, 26). Transport of endosomal cholesterol to mitochondria is mediated by NPC2 and MLN64 but bypasses NPC1 (5, 27). Accordingly, the elevated mitochondrial cholesterol content in an NPC1-deficient Chinese hamster ovary (CHO) cell line is lowered by depletion of MLN64 (5). Transport of endosomal cholesterol to mitochondria is also decreased by depletion of NPC2 (27). Expression of a mutant NPC2, which can bind cholesterol but cannot transfer it to NPC1 (1), restores cholesterol transport to mitochondria in NPC2-depleted cells (27). We show that RNA interference-mediated depletion of NPC1 in combination with MLN64 and depletion of NPC2 in combination with the expression of mutant NPC2 generated CHO cells with elevated or normal mitochondrial cholesterol levels. Several metabolic parameters, including lactate formation, oxygen consumption, and mitochondrial ATP homeostasis, were affected by mitochondrial cholesterol levels, as was the expression of the antioxidant response factor Nrf2.
EXPERIMENTAL PROCEDURES
Materials
Cell culture media, FBS, and other medium supplements were obtained from Invitrogen. [3H]Deoxyglucose (2-[1,2-3H]deoxyglucose; 1 mCi/ml; 25–50 Ci/mmol) was obtained from PerkinElmer Life Sciences. Unless otherwise indicated, other materials were obtained from Sigma or Thermo Fisher Scientific.
Cell Culture
Wild type and NPC1-deficient CHO cells expressing NPC1G660R were obtained from L. Liscum (Tufts University, Boston, MA) and have been described and characterized previously (28). For siRNA transfection, CHO cells were incubated with siRNA (Thermo Scientific Dharmacon) complexed to jetPRIME (Polyplus Transfection, New York, NY) as described (5, 27). All experiments were performed 72 h after transfection. siRNAs targeting NPC1, MLN64, and NPC2 were previously validated in CHO cells by quantitative PCR and immunoblotting (5, 27). Stable NPC1-deficient cell lines and NPC2-deficient cell lines expressing human NPC2 mutants were generated by lentivirus-mediated transduction of wild type CHO cells with shRNA expression vectors based on the pLKO1-TRC cloning vector (Addgene 10878) and selection with puromycin. To generate the shRNA vectors, a cassette consisting of the CMV promoter and the cDNA sequence for mCherry was inserted into pLKO1-TRC, and then oligonucleotides encoding shRNA hairpin sequences targeting hamster NPC1 or NPC2 or encoding non-targeting shRNA hairpins (MWG Operon, Huntsville, AL) were inserted into the shRNA cloning site of the resulting pLKO1-mCherry vector. shRNAs were as follows (top strand sequences): shNT (5′-ccgggcaacaagatgaagagcaccgacgagtgctcttcatcttgttgctttttt-3′), shNPC1 (hamster) (5′-ccggcgagtaagccgagcagaagactgcagtcttctgctcggcttactcggttttt-3′), and shNPC2 (hamster) (5′-ccggggttgtaagtctggaatcaactgcagttgattccagacttacaacctttttt-3′). For the expression of NPC2 mutants, DNA encoding mCherry was replaced by cDNA encoding human wild type NPC2 (NPC2WT) or NPC2 with point mutation V81D or Y119S (NPC2V81D or NPC2Y119S). These mutants have been described previously (1, 27) and correspond to mutations in Val-62 and Tyr-100 in mature NPC2 (29). All CHO cells were maintained in Ham's F-12 medium with 5% FBS and with 3 μg/ml puromycin if transfected with shRNA vectors.
Immunoblotting Analysis
Cell lysates were prepared in 0.1% SDS in PBS with protease inhibitors (5 μg/ml leupeptin, 5 μg/ml aprotinin, 50 μm PMSF, and 1 μm pepstatin) and phosphatase inhibitors (2 mm orthovanadate and 1 mm sodium fluoride), separated by SDS-PAGE, and transferred to polyvinylidene fluoride membranes. Membranes were blocked in 5% skim milk powder or 2% polyvinylpyrrolidone and phosphatase inhibitors (for phosphorylated pyruvate dehydrogenase detection) in Tris-buffered saline with 5% Tween (TTBS; pH 7.4) and incubated with anti-NPC1 (Novus Biologicals, Littleton, CO), anti-Lamp1 (Abcam, Cambridge, MA), anti-VDAC1 (Abcam), anti-protein-disulfide isomerase (Assay Designs Enzo Life Sciences, Farmingdale, NY), anti-phosphorylated pyruvate dehydrogenase (Cell Signaling Technology, Danvers, MA), anti-pyruvate dehydrogenase (PDH) (Cell Signaling Technology), or anti-actin (Santa Cruz Biotechnology, Inc.). Secondary horseradish peroxidase-conjugated donkey anti-rabbit, donkey anti-mouse, or donkey anti-goat antibodies (Jackson Immunoresearch, West Grove, PA) were diluted 1:10,000 in TTBS and detected by enhanced chemiluminescence (Roche Applied Science). Actin was used as a loading control.
Filipin Staining
Cells grown on glass coverslips were fixed and stained with 50 μg/ml filipin in PBS as described (5). Images were acquired on a Nikon TE2000 epifluorescence microscope with a charge-coupled device camera at filter settings of 387/11 nm (excitation) and 447/60 nm (emission), using a ×20 objective.
Isolation of Mitochondria and Cholesterol Determination
Mitochondria were isolated from cells as described (5). Briefly, cells were grown to confluence, harvested, and ruptured by nitrogen cavitation (30) (Parr Instrument Co.). Crude mitochondria were separated from cytosol by differential centrifugation and treated with 0.1% trypsin for 10 min, followed by the addition of soybean trypsin inhibitor at 0.5 mg/ml. Ultracentrifugation over a 30% Percoll gradient at 95,000 × g yielded a lower density endosomal fraction and a higher density mitochondrial fraction. Cholesterol was measured with the Amplex Red assay (Invitrogen) and expressed per mitochondrial protein determined with a bicinchoninic acid-based photometric assay (BCA assay; Thermo Fisher Scientific).
Assays for Lactate Secretion, Deoxyglucose Uptake, and ATP Levels
For all assays, cells were washed and preincubated in glucose-free Hepes-buffered saline (124 mm NaCl, 3 mm KCl, 10 mm Hepes, pH 7.4, 2 mm CaCl2, 1 mm MgCl2) for 30 min, followed by a 30-min incubation in phenol red-free DMEM without glucose, pyruvate, or glutamine but supplemented with the indicated metabolites (incubation medium). Cellular protein was collected into 0.1% SDS/PBS-containing protease and phosphatase inhibitors and determined with the BCA assay.
Lactate Secretion
Incubation medium was collected after 30 min. Fifty μl of medium were added to a reaction mix (2 mm NAD+, 48 μm resazurin, 1 unit/ml diaphorase, and 18.5 units/ml l-lactate dehydrogenase) in Tris buffer (75 mm Tris/HCl, pH 8.9, 100 mm KCl, 0.0004% Triton X-100) for 30 min. Fluorescence was measured at 544/590 nm (excitation/emission), and lactate concentrations were calculated based on a calibration curve on the same assay plate. Data were derived from triplicate incubations in at least four independent experiments.
Deoxyglucose Uptake
Cells were incubated with 2-[1,2-3H]deoxyglucose (2 μCi, 0.08 mm) in incubation medium for 30 min. Cells were washed three times with PBS and collected into 0.1% SDS in PBS, and cell-associated radioactivity was quantified by scintillation counting. Data were derived from three independent experiments in triplicate.
Cellular ATP Levels
Following a 30-min exposure to incubation medium, cells were harvested into ice-cold PBS, and total cellular ATP was immediately measured using the ATP-GloTM bioluminometric assay (Biotium, Hayward, CA). Data were derived from three independent experiments in triplicate.
Measurement of Mitochondrial Respiration
Three days after transfection with siRNA against NPC1 or MLN64 or with a mixture of siRNAs against both proteins, CHO cells were plated in XF96 polystyrene cell culture microplates (Seahorse Bioscience) at a density of 35,000 cells/well. After an overnight incubation, cells were washed and preincubated for 30 min in unbuffered XF assay medium with or without glutamine (2 mm) supplemented with 5.5 mm d-glucose and 1 mm sodium pyruvate at 37 °C in a non-CO2 environment. The oxygen consumption rate (OCR) was measured every 7 min using an XF96 extracellular flux analyzer (Seahorse Bioscience) during consecutive addition of 1 μm oligomycin, 2 μm carbonyl cyanide p-trifluoromethoxyphenylhydrazone (FCCP), and 2.5 μm antimycin A (final concentrations are given).
Measurement of Mitochondrial ATP
CHO cells stably expressing non-targeting shRNA or shRNA targeting NPC1 were transiently transfected with the fluorescence resonance energy transfer (FRET)-based ATP indicator mtAT1.03 (31). The sensor was excited at 430 nm using a high-speed polychromator system VisiChrome (Visitron Systems, Puchheim, Germany), and emission was measured at 535 and 480 nm (Versatile Filter Wheel Systems, Visitron Systems), to measure FRET-dependent and cyan fluorescent protein-dependent fluorescence, respectively, as described previously (32).
Reactive Oxygen Species Generation
Cellular reactive oxygen species (ROS) production was measured using an Amplex Red-based fluorometric assay (Invitrogen). Briefly, cells were grown in a 96-well clear bottom plate, washed with glucose-free Hepes-buffered saline, and incubated at 37 °C in 200 μl of reaction mix (Hepes-buffered saline with 2.5 mm glucose, 12.5 μg/ml Amplex Red, 0.3 units/ml horseradish peroxidase). Fluorescence was measured every 2 min for 30 min in a FluoStar plate reader at 544 nm (excitation) and 590 nm (emission). ROS generation was calculated as the fluorescence increase over 30 min and standardized to cell protein.
Gene Expression Analysis
Total RNA was prepared from CHO cells by TRIzol extraction (TriReagent). One μg of RNA was used to prepare cDNA using iScript reverse transcriptase (Bio-Rad). The mRNA levels of hamster Npc2 and Nrf2 relative to cyclophilin (Ppia) mRNA levels were analyzed by quantitative PCR using the iSYBR Green Mastermix (Bio-Rad) and calculated by the ΔΔCt method. For analysis of human NPC2, PCR was performed on 100 ng of reverse transcribed RNA using Taq recombinant polymerase (Invitrogen). Amplicons were quantified by agarose gel electrophoresis. Primer sequences were as follows: cyclophilin, Ppia-F (5′-tcttcttgctggtcttgccattcc-3′) and Ppia-R (5′-tccaaagacagcagaaaactttcg-3′) and Nrf2-F (5′-gcttctttccattcccgaattac-3′) and Nrf2-R (5′-tgagctggctggcgtcttc-3′); hamster, Npc2-F (5′-cggctctaaggttggactc-3′) and Npc2-R (5′-tggcagagctgttctccgactg-3′); human, NPC2-F (5′-tatagctagccgccaccatgcgtttcctggcagc-3′) and NPC2-R (5′-tataggatccttagagatgagaaacgatctg-3′).
Statistical Analysis
For comparison of two groups, Student's two-tailed t test was used. For comparison of three or more groups, significance was calculated using analysis of variance. Significance was assumed for p < 0.05.
RESULTS
Elevated Mitochondrial Cholesterol Levels and Increased Lactate Production in NPC1-depleted CHO Cells
Our previous work has shown that CHO-4-4-19 cells, which carry a loss-of-function mutation in NPC1 (28), have elevated levels of mitochondrial cholesterol compared with the parental CHO cells (5). Because this cell line was established nearly 2 decades ago, we first determined whether mitochondrial cholesterol also accumulated during shorter periods of NPC1 deficiency. NPC1-deficient CHO cells were generated by transfection with an shRNA vector targeting hamster NPC1 and short selection in puromycin over two generations (10 days). Immunoblotting and filipin staining showed the depletion of NPC1 protein and the characteristic filipin accumulation in cells transfected with shRNA targeting NPC1 but not in cells transfected with a non-targeting control shRNA vector (Fig. 1A). Separation of endosomes and mitochondria was verified by immunoblotting (Fig. 1B). Mitochondria isolated from NPC1-deficient cells had 2-fold higher cholesterol levels than mitochondria isolated from control cells (Fig. 1C). Moreover, NPC1-deficient cells secreted significantly more lactate than control cells within 30 min (Fig. 1D), indicating that energy metabolism was altered by depletion of NPC1. In wild type CHO cells, the lactate concentration in the medium increased linearly over the first 2 h and could be further increased by inhibition of ATP synthase with oligomycin (not shown), and we therefore assumed that the lactate concentration measured after 30 min in the medium reflected lactate production by the cells.
FIGURE 1.
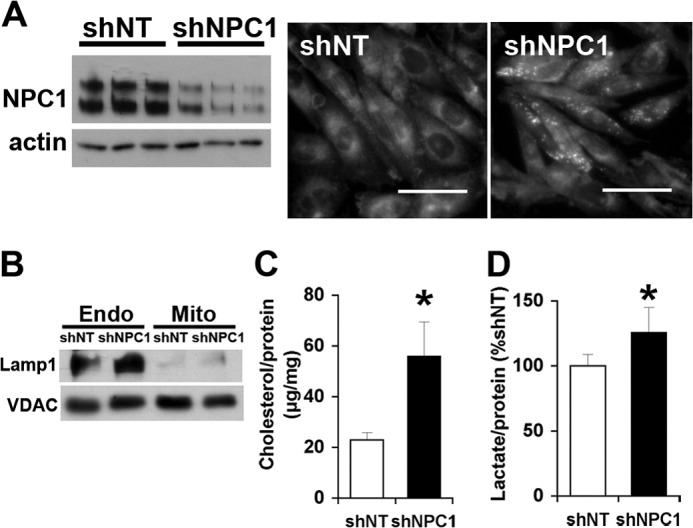
Elevated mitochondrial cholesterol levels and increased lactate formation in NPC1-depleted CHO cells. CHO cells were transfected with shNT or shNPC1 and selected with puromycin for 10 days. A, filipin stain and NPC1 immunoblot. Scale bars, 50 μm. B, immunoblot for endosomal LAMP1 and mitochondrial VDAC1 in endosomes (Endo) and purified mitochondria (Mito) prepared from CHO cells expressing shNT or shNPC1. C, cholesterol levels of mitochondria isolated from CHO cells expressing shNT or shNPC1. D, lactate levels in incubation medium containing 2.5 mm glucose and incubated for 30 min with CHO cells expressing shNT or shNPC1. Data are means ± S.E. (error bars) of three independent experiments in triplicate (*, p < 0.05).
Cells Depleted of Both NPC1 and MLN64 Produce Normal Levels of Lactate and Decrease Glucose Uptake in Response to Glutamine
To determine whether the metabolic alterations were a consequence of the increased mitochondrial cholesterol levels, we transfected CHO cells with siRNAs against NPC1 or against MLN64 alone or with a mixture of siRNAs against the two proteins. The use of siRNA was more suitable for co-transfections and avoided nonspecific adaptations during the brief selection process. Transfection with siRNA targeting NPC1 increased cellular lactate production (Fig. 2A), similar to the transfection with shRNA against NPC1. In contrast, cells depleted of both NPC1 and MLN64 or of MLN64 alone secreted the same amount of lactate as control cells transfected with non-targeting siRNA (Fig. 2A). Increased lactate formation is often observed when mitochondrial function is impaired. Conversely, mitochondrial ATP production normally decreases glycolysis. Glutamine is a mitochondrial energy substrate used by CHO cells and is, unlike fatty acids, also available to the brain. The addition of glutamine did not change lactate production in any of the CHO cells compared with incubation with glucose alone (Fig. 2A). However, lactate can also be produced from glutamine when malic enzyme is active and converts malate to pyruvate (33), so that lactate secretion may not reflect glycolysis in the presence of glutamine. We therefore measured glucose uptake using radiolabeled 2-[3H]deoxyglucose, which is taken up into cells and phosphorylated by hexokinase but not further metabolized. In the presence of glucose alone, 2-[3H]deoxyglucose uptake was the same in all cells (Fig. 2B), suggesting that the higher lactate production in NPC1-depleted CHO cells was due to a diversion of pyruvate into anaerobic metabolism. The addition of glutamine decreased 2-[3H]deoxyglucose uptake in control non-targeting siRNA (siNT) cells, suggesting that these cells oxidized glutamine and in response decreased glucose oxidation and uptake. Similarly, cells depleted of both NPC1 and MLN64 or of MLN64 alone took up less 2-[3H]deoxyglucose in the presence than in the absence of glutamine (Fig. 2B). In contrast, glutamine did not affect 2-[3H]deoxyglucose uptake in cells depleted of NPC1 alone (Fig. 2B), in line with an impaired mitochondrial utilization of glutamine as an energy substrate.
FIGURE 2.
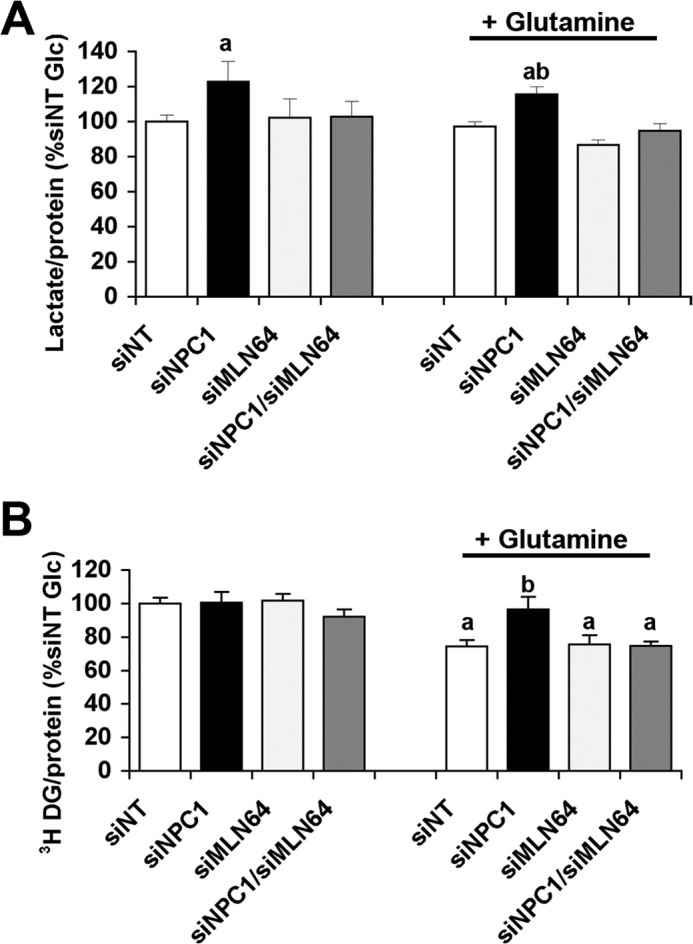
Increased lactate secretion in NPC1-depleted cells is prevented by co-depletion of MLN64. CHO cells were transfected with siNT or with siRNA targeting NPC1 (siNPC1), MLN64 (siMLN64), or a combination of both (siNPC1/siMLN64). A, lactate concentrations in incubation medium containing 2.5 mm glucose (Glc) with or without 1 mm glutamine and incubated for 30 min with CHO cells as indicated. B, cell-associated radioactivity in cells transfected with siNT, siNPC1, and/or siMLN64 after a 30-min incubation with 2-[3H]deoxyglucose and 2.5 mm glucose with or without 1 mm glutamine. Data are means ± S.E. (error bars) of three independent experiments in triplicate (a, p < 0.05 versus siNT glucose; b, p < 0.05 versus siNT glutamine).
Glutamine Increases Mitochondrial Respiration in Cells Depleted of Both NPC1 and MLN64 but Not in Cells Depleted of NPC1 Alone
For a closer analysis of the mitochondrial metabolism of glucose and glutamine, we measured the OCR in the presence of glucose or glucose and glutamine. OCR was measured during the consecutive addition of oligomycin, FCCP, and antimycin to obtain the basal OCR, ATP synthase-dependent OCR, maximum respiratory capacity, and non-mitochondrial respiration (34). In the presence of glucose alone, there were no significant differences in any of these aspects of the OCR among control cells and cells depleted of NPC1 and/or MLN64 (Fig. 3, A–D). In the presence of glutamine and glucose, control siNT cells and cells depleted of NPC1 and MLN64 or of MLN64 alone increased their basal and ATP synthase-dependent OCR and had a higher maximum respiratory activity compared with measurements in the presence of glucose alone (Fig. 3, E–H), indicating that glutamine was used as a substrate for respiration. In contrast, NPC1-depleted cells showed no differences in the basal OCR or in any of its components in the presence or absence of glutamine (Fig. 3, E–H) and had significantly lower mitochondrial respiration rates than control cells or cells depleted of both NPC1 and MLN64 when glucose and glutamine were available as energy substrates. Non-mitochondrial components of oxygen consumption, given by the OCR in the presence of antimycin A, were similar in all cells (Fig. 3E), demonstrating that the decreased OCR in NPC1-deficient cells was due to decreased mitochondrial respiration. The levels of total cellular ATP were the same in all cells in the presence of glucose alone (Fig. 3I), reflecting the lack of differences in mitochondrial respiration rates and glucose uptake. In the presence of glutamine and glucose as energy substrates, however, cellular ATP levels were higher in NPC1-depleted cells than in control siNT cells or cells depleted of both NPC1 and MLN64 (Fig. 3I), possibly reflecting increased glycolysis in NPC1-depleted cells.
FIGURE 3.

Impaired glutamine-dependent mitochondrial respiration in NPC1-depleted cells is prevented by co-depletion of MLN64. A–H, OCRs of CHO cells transfected with siNT or with siNPC1, siMLN64, or siNPC1/siMLN64 were measured using a Seahorse Bioanalyzer XF96 in the presence of glucose alone (A–D) or in the presence of glucose and glutamine (E–H) during the consecutive addition of 1 μm oligomycin, 2 μm FCCP, and 2.5 μm antimycin, as indicated. A and E, OCR monitored over 77 min in cells transfected with non-targeting siRNA or siRNA against NPC1, MLN64, or NPC1 and MLN64. B and F, average basal OCR prior to the addition of oligomycin; C and G, ATP turnover calculated as the difference between basal OCR and the OCR in the presence of oligomycin. D and H, maximum respiratory rates; OCR in the presence of FCCP (*, p < 0.05; **, p < 0.01). I, total cellular ATP levels in cells that were incubated with media containing 2.5 mm glucose with or without 1 mm glutamine for 30 min, standardized to protein, and expressed as a percentage of the average of siNT. All data shown are means ± S.E. (error bars) (a, p < 0.05 versus siNT glucose; b, p < 0.05 versus siNT glutamine).
Impaired Mitochondrial ATP Transport in NPC1-deficient Cells
To further investigate the low mitochondrial respiration in NPC1-depleted cells even when glutamine is available as an energy substrate, we used the genetically encoded, mitochondrially targeted ATP sensor mtAT1.03 to measure mitochondrial ATP (mitoATP) levels in a live cell imaging approach (31, 35). Basal ratio signals of the mitochondrially targeted ATP probe were not significantly different in cells expressing shRNA against NPC1 (shNPC1) compared with control cells expressing non-targeting shRNA (shNT), indicating similar mitoATP levels in both groups (Fig. 4A). As expected, the addition of oligomycin caused a rapid drop in mitoATP levels due to inhibition of ATP synthase. However, in control shNT cells, mitoATP levels recovered substantially within minutes of oligomycin addition and in the continued presence of oligomycin, indicating transport of cytosolic ATP into mitochondria, whereas recovery was minimal in NPC1-deficient cells (Fig. 4A). For a quantitative analysis of this effect, the FRET ratio measured over time was normalized to the basal FRET ratio in the absence of inhibitors (Fig. 4B). Calculation of the averaged normalized FRET ratio revealed a more pronounced decrease of mitoATP levels in NPC1-deficient cells upon the addition of oligomycin and significantly lower mitoATP levels during the continued exposure to oligomycin compared with control shNT cells (Fig. 4B), indicating that mitochondrial ATP import was impaired in NPC1-deficient cells. Inhibition of glycolysis with deoxyglucose also decreased mitoATP levels in all cells (Fig. 4C); however, the decrease in mitoATP in response to deoxyglucose was much less pronounced in shNPC1 cells than in control shNT cells (Fig. 4C), consistent with decreased transport of mitochondrial ATP into the cytosol. MitoATP levels partially recovered in control cells even in the presence of deoxyglucose, whereas recovery was again minimal in NPC1-deficient cells (Fig. 4C), probably due to decreased oxidative phosphorylation in NPC1-deficient cells.
FIGURE 4.

Impaired mitochondrial ATP transport in NPC1-deficient cells. CHO cells expressing shNT or shNPC1 were transiently transfected with the FRET-based ATP sensor mtAT1.03. MitoATP levels ([ATP]mito) were measured as the ratio of emission at 535 nm/480 nm (Ratio(F535 nm/F480 nm)), with excitation at 435 nm in the presence of glucose and glutamine. A, mitoATP levels in shNT and shNPC1 cells during the addition of 1 μm oligomycin. Ratio(F535 nm/F480 nm) was measured for 2.5 min prior to the addition of oligomycin (basal Ratio(F535 nm/F480 nm)) and continued in the presence of oligomycin. The bar graph shows basal [ATP]mito as means ± S.E. B, changes in ATP levels (Δ[ATP]mito) were calculated from the measurements shown in A as the Ratio(F535 nm/F480 nm)/R0 with R0 as the Ratio(F535 nm/F480 nm) at the beginning of the measurement. Center panel (+ Oligomycin), maximum decrease in [ATP]mito following the addition of oligomycin, calculated as the difference between basal Ratio(F535 nm/F480 nm)/R0 and the lowest Ratio(F535 nm/F480 nm)/R0. Right panel (Recovery), increase in [ATP]mito calculated as the difference between the lowest Ratio(F535 nm/F480 nm)/R0 and the highest Ratio(F535 nm/F480 nm)/R0 following the addition of oligomycin. The lowest and highest Ratio(F535 nm/F480 nm)/R0 are indicated by the markers on the plot of Δ[ATP]mito over time. C, changes in mitoATP levels (Δ[ATP]mito) in shNT and shNPC1 cells during the addition of deoxyglucose calculated as the Ratio(F535 nm/F480 nm)/R0. The Ratio(F535 nm/F480 nm) was measured for 2.5 min prior to the addition of deoxyglucose and continued in the presence of deoxyglucose. The bar graph shows the maximum decrease in [ATP]mito following the addition of deoxyglucose, calculated as the difference between basal Ratio(F535 nm/F480 nm)/R0 and the lowest Ratio(F535 nm/F480 nm)/R0. Data in the bar graphs and markers are shown as means ± S.E. (error bars). Data were derived from three independent experiments. *, p < 0.05.
The Increased Lactate Production by NPC1-depleted Cells Is Not Primarily Caused by Inactivation of Pyruvate Dehydrogenase
One possible reason for an increase in glycolysis to lactate and decreased pyruvate oxidation is a deficiency in PDH levels or activity, as found in Npc1−/− cerebellum (7, 36). If PDH inactivation contributed to the higher lactate production in NPC1-depleted CHO cells, we would expect a decrease in lactate production to the same levels in all cells by treatment with dichloroacetate, which indirectly activates PDH through inhibition of PDH kinase. As expected, lactate production decreased in all cells in the presence of dichloroacetate and was no longer significantly higher in NPC1-depleted cells (Fig. 5A), suggesting that impaired PDH activity may have contributed to some extent to the increase in lactate formation in NPC1-depleted cells (Fig. 5A). However, the levels of phosphorylated and of total PDH were not significantly different in NPC1-depleted cells compared with control cells or with cells transfected with siRNA against NPC1 and MLN64 or against MLN64 alone (Fig. 5, B and C).
FIGURE 5.
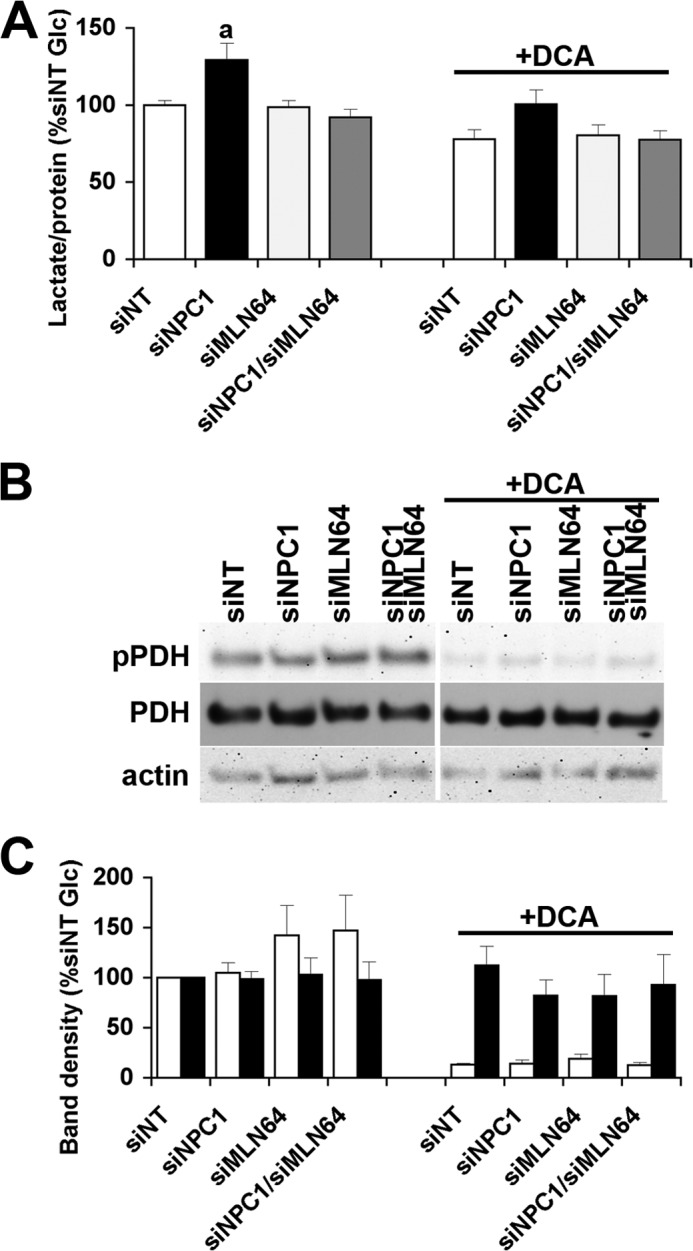
Unchanged levels of total and phosphorylated PDH in NPC1-depleted cells. A, lactate concentration in incubation media supplemented with 2.5 mm glucose ± 10 mm dichloroacetate (DCA) and incubated for 30 min with CHO cells with siNT or with siNPC1, siMLN64, or siNPC1/siMLN64. B, representative immunoblot of lysates prepared from cells used in A probed with antibodies against phosphorylated (pPDH) and total PDH and actin as a loading control. C, density analysis of bands from the immunoblot. Data shown are means ± S.E. (error bars) (n = 3). a, p < 0.05 versus siNT without dichloroacetate.
Increased Expression of the Antioxidant Response Factor Nrf2 in NPC1-depleted Cells Is Prevented by Co-depletion of MLN64
Mitochondrial dysfunction is often associated with an increased generation of ROS, and increased levels of oxidative stress have been found in several cell and animal models of NPC disease (7, 14–17). ROS production, measured as H2O2, was also increased in the long term NPC1-deficient CHO-4-4-19 cell line (Fig. 6A). In contrast to CHO-4-4-19 cells, acute depletion of NPC1 by siRNA transfection did not lead to an increase in ROS production (Fig. 6B). However, mRNA levels of the antioxidant response factor Nrf2 were increased in NPC1-depleted cells (Fig. 6C). This increase was prevented by either treatment with the antioxidant N-acetylcysteine (NAC) or co-depletion of MLN64 in addition to NPC1 (Fig. 6C), suggesting that low levels of oxidative stress develop very soon after the loss of NPC1 without yet causing a measurable increase in ROS in the cellular environment and indicating a role for mitochondrial cholesterol in the development of oxidative stress. Treatment with NAC for 48 h also prevented the increased lactate production in NPC1-depleted cells (Fig. 6D), suggesting that initial mild increases in oxidative stress contribute to the metabolic alterations in NPC1-deficient cells.
FIGURE 6.
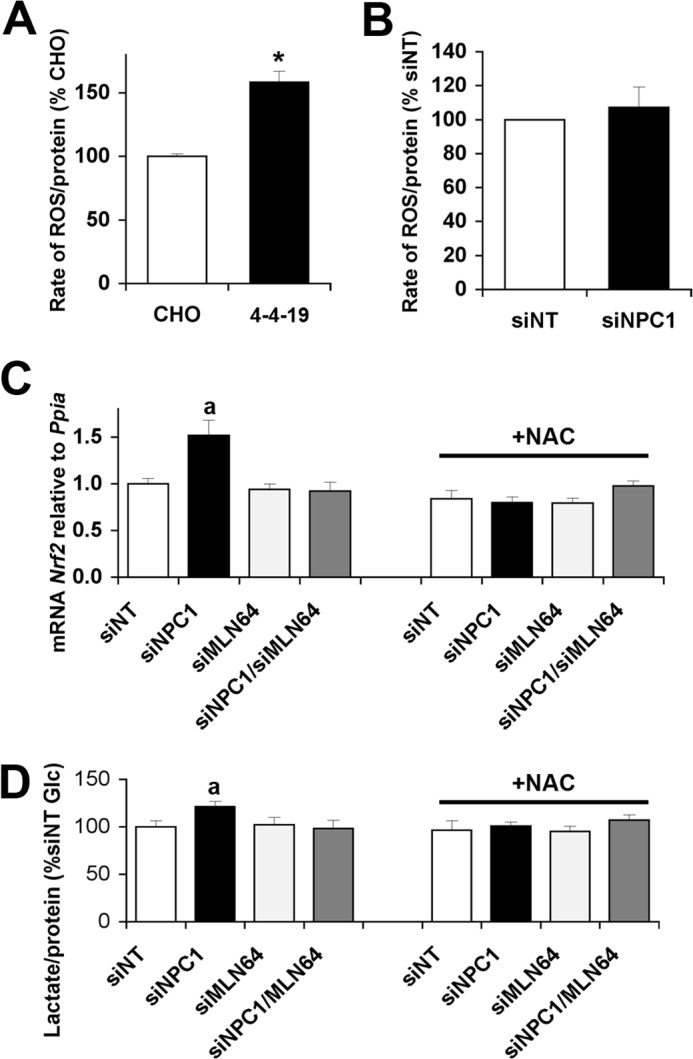
Oxidative stress contributes to increased lactate production in NPC1-depleted cells. A, reactive oxygen species (H2O2) production by wild type or NPC1-deficient CHO cells (4-4-19). B, H2O2 production by CHO cells transfected with siNT or siNPC1. C, Nrf2 mRNA levels relative to cyclophilin (Ppia) in cells transfected with siNT, siNPC1, siMLN64, or siNPC1 and siMLN64 and incubated with or without NAC for 48 h. D, lactate levels in incubation medium supplemented with 2.5 mm glucose and incubated with cells transfected with siNT, siNPC1, and/or siMLN64 and treated with or without 1 mm NAC for 48 h. a, p < 0.05 versus siNT without NAC. Error bars, S.E.
Increased Mitochondrial Cholesterol Levels, Lactate Production, and Nrf2 mRNA Levels in NPC2-depleted CHO Cells Expressing NPC2V81D
Although depletion of MLN64 alone did not have any effects on the metabolic parameters we measured, it was still possible that MLN64 depletion in NPC1-deficient cells had effects in addition to the decrease in mitochondrial cholesterol levels. We therefore used a second approach to manipulate mitochondrial cholesterol levels, based on the known transport characteristics of NPC2 proteins with different point mutations (1, 27). NPC2V81D cannot transfer cholesterol to NPC1 (1), but its expression allows cholesterol transport to mitochondria in NPC2-depleted cells (27). NPC2Y119S cannot bind or transfer cholesterol at all (1, 27). Stable CHO cell lines were generated using expression vectors encoding an shRNA sequence against hamster NPC2 in addition to cDNA sequences for mCherry or human NPC2WT, NPC2V81D, or NPC2Y119S. Control cells expressed the corresponding non-targeting shRNA vector with cDNA encoding mCherry. Our previous work has shown no effects on cholesterol transport when NPC2 mutants were expressed in addition to endogenous NPC2 (27). Transfection with shRNA reduced the levels of hamster NPC2 mRNA by ∼50% compared with shNT control cells (0.51 ± 0.01, 0.52 ± 0.07, 0.39 ± 0.06, and 0.33 ± 0.07 relative to shNT cells in mCherry-, NPC2WT-, NPC2V81D-, or NPC2Y119S-expressing shNPC2 cells, respectively). The levels of human NPC2 mRNA were comparable in the three lines expressing NPC2WT, NPC2V81D, or NPC2Y119S (117 and 87% of NPC2WT in NPC2V81D and NPC2Y119S, respectively) and undetectable in the mCherry-expressing cells. Mitochondrial fractions isolated from these cell lines were devoid of markers for endoplasmic reticulum and endosomes (Fig. 7A). Mitochondrial cholesterol levels in cells expressing shRNA targeting endogenous NPC2 in combination with expression of mCherry, NPC2WT, or NPC2Y119S were similar to those in cells expressing non-targeting shRNA (Fig. 7B). However, cells expressing shRNA against endogenous NPC2 and expressing NPC2V81D had increased levels of mitochondrial cholesterol (Fig. 7B), thus resembling NPC1-depleted cells. Lactate secretion and Nrf2 mRNA levels were significantly increased in cells depleted of endogenous NPC2 and expressing NPC2V81D but unchanged in cells depleted of endogenous NPC2 and expressing mCherry, NPC2WT, or NPC2Y119S (Fig. 7, C and D). These findings provided further evidence that mitochondrial cholesterol accumulation could increase oxidative stress and affect energy metabolism.
FIGURE 7.

Increased mitochondrial cholesterol, lactate production, and Nrf2 mRNA levels in cells depleted of NPC2 and expressing NPC2V81D. A, immunoblot for protein-disulfide isomerase (endoplasmic reticulum marker), endosomal LAMP1, and mitochondrial VDAC1 in cytosolic (Cyto) and endosomal (Endo) fractions and in purified mitochondria (Mito) prepared from cells expressing shNT or shNPC2 and expressing mCherry (mCh), wild type NPC2 (WT), NPC2V81D (VD), or NPC2Y119S (YS). The lower band in the VDAC1 immunoblot is a nonspecific band that appeared when the membrane was probed with other antibodies. B, cholesterol levels of mitochondria isolated from cells in cells expressing shNT or shNPC2 and mCherry, wild type NPC2, NPC2V81D, or NPC2Y119S. C, lactate levels in medium containing 2.5 mm glucose and incubated with cells expressing shNT or shNPC2 and mCherry, wild type NPC2, NPC2V81D, or NPC2Y119S. D, Nrf2 mRNA levels relative to cyclophilin in cells expressing shNT or shNPC2 and mCherry, wild type NPC2, NPC2V81D, or NPC2Y119S. *, p < 0.05 versus shNPC2 mCH. Error bars, S.E.
DISCUSSION
In addition to the well known accumulation of cholesterol in late endosomes, NPC1-deficient cells have increased levels of cholesterol in mitochondria. The consequences of imbalances in mitochondrial cholesterol homeostasis are not well characterized. Previous studies have shown mitochondrial deficiencies and an increase in lactate levels in Npc1−/− murine brain (4, 7). Here we have investigated the alterations in energy metabolism caused by NPC1 deficiency and the role of mitochondrial cholesterol in precipitating these changes in CHO cells. Metabolic alterations in NPC1-deficient cells included increased lactate production, mitochondrial respiration defects, impaired ATP transport across mitochondrial membranes, and increased oxidative stress. In two different experimental models, most of these metabolic changes occurred only when mitochondrial cholesterol levels were increased and were prevented by blocking endosomal cholesterol transport to mitochondria.
The increased lactate production observed in NPC1-depleted CHO cells pointed to defects in mitochondrial energy metabolism, which became apparent when glutamine was added as a mitochondrial energy substrate. The seemingly normal mitochondrial respiration rates in NPC1-depleted CHO cells in the presence of glucose alone were probably due to generally low levels of mitochondrial respiration in CHO cells under these conditions (Fig. 3, A–D) and were consistent with the known high glycolytic flux to lactate in proliferating CHO cells (33, 37). In the presence of glutamine, OCRs were lower in NPC1-depleted cells compared with control cells until the addition of antimycin (Fig. 3, E–H), clearly indicating defects in the three main components of mitochondrial respiration, namely ATP turnover, proton leak activity, and substrate oxidation (34). ATP turnover and substrate oxidation are each influenced by several processes. Thus, ATP synthase activity, ATP/ADP exchange, and turnover of ATP in the extramitochondrial space determine overall ATP turnover, whereas substrate oxidation requires substrate uptake and metabolism as well as electron transport activity (34). Mitochondrial protein levels and the extent of mitochondrial staining with fluorescent dyes were similar in NPC1-deficient and control cells (data not shown); therefore, the differences in mitochondria respiration were unlikely to be due to decreased mitochondrial abundance. Further investigation using a genetically encoded fluorescent ATP sensor that localizes to mitochondria (31, 32, 35) revealed deficiencies in the transport of ATP between mitochondrial matrix and cytosol in NPC1-deficient cells (Fig. 4). Mitochondrial ATP transport occurs in exchange for ADP and is mediated by the adenine nucleotide translocator in the inner membrane and the voltage-dependent anion channel (VDAC) in the outer mitochondrial membrane. Impaired ATP/ADP exchange would also limit the availability of ADP to ATP synthase and thus limit oxidative phosphorylation in NPC1-deficient cells, consistent with the observed decrease in ATP turnover and basal OCR (Fig. 3). Impaired ATP/ADP transport could also explain some of the metabolic alterations observed in murine Npc1−/− brain, where lactate levels increase even before onset of symptoms, followed by an up-regulation of glycolytic gene expression and dysregulation of other metabolic pathways (7), and, at very late stages of NPC disease, a decrease in ATP levels and mitochondrial ATP generation (4). In contrast to CHO cells, the brain strongly relies on the oxidative metabolism of glucose and might be particularly sensitive to metabolic alterations caused by mitochondrial cholesterol accumulation. Moreover, decreased levels of non-phosphorylated, active PDH in Npc1−/− murine cerebellum (7, 36) and impaired mitochondrial ATP generation in the presence of pyruvate (7) indicate additional defects in pyruvate oxidation in NPC1-deficient brain.
The metabolic alterations and defects in mitochondrial respiration in NPC1-depleted CHO cells were prevented by co-depletion of MLN64 to inhibit endosomal cholesterol transport to mitochondria. Similarly, mitochondrial cholesterol accumulation following depletion of endogenous NPC2 and expression of NPC2V81D led to increased lactate production, which was not observed in the presence of an NPC2 mutant unable to support endosomal cholesterol mobilization to mitochondria (Fig. 7). Sphingolipids, gangliosides, and sphingosine also accumulate in NPC1- or NPC2-deficient endosomes and could be transported to a greater extent to mitochondria. However, MLN64 specifically binds cholesterol (38–40), and depletion of MLN64 is not expected to reverse effects caused by lipids other than cholesterol. Moreover, because overexpression or depletion of MLN64 does not alter the endosomal cholesterol accumulation in NPC1-deficient cells (5, 25), it is also unlikely to alter the endosomal accumulation of sphingolipids or their nonspecific transport to mitochondria. A similar argument can be made for the depletion and expression of NPC2 mutants, which bind cholesterol but not sphingolipids (41, 42). Thus, our findings indicated that the adaptations in energy metabolism were caused by mitochondrial cholesterol accumulation due to increased transport of endosomal cholesterol to mitochondria. Elevated mitochondrial cholesterol levels have been observed in several (patho)physiological conditions, including in certain types of cancer cells, during cardiac ischemia and hepatic steatosis and in the brains of a murine model of Alzheimer disease (13, 18–24, 43). All of these conditions are also associated with alterations in energy metabolism. On the other hand, enrichment of the prostate cancer cell line LNCaP with cholesterol complexed to cyclodextrin increased mitochondrial cholesterol levels but had no effects on cellular respiration (44). Thus, the cellular context and the pathways leading to the build-up of mitochondrial cholesterol may influence which aspects of mitochondrial function are most affected. Mitochondrial cholesterol decreases membrane fluidity and permeability and lowers proton leak activity (12). Elevated mitochondrial cholesterol levels have also been linked to impaired glutathione and pyruvate import (18, 45), decreased phosphate carrier activity (46, 47), and higher citrate export from mitochondria (20), suggesting that several mitochondrial transport processes can be affected by cholesterol. Of particular interest in the context of the present study are reports that both the adenine nucleotide translocator and VDAC are influenced by cholesterol (13, 48–52), which may explain our observation of decreased ATP transport across the mitochondrial membranes (Fig. 4). Moreover, alterations in VDAC permeability represent one mechanism through which accumulation of cholesterol mainly in the mitochondrial outer membrane could affect ATP production without a direct effect on the mitochondrial inner membrane, as was observed in a study using isolated mitochondria enriched with cholesterol (9). Where cholesterol accumulates in NPC1-deficient cells is not entirely clear and may depend on the cellular context and stage of the disease. In NPC1-deficient CHO cells, it seems likely that cholesterol accumulates mainly in the mitochondrial outer membrane because arrival at the inner membrane is not increased compared with control cells (5, 27). However, one study found increased inner membrane cholesterol levels in murine brain mitochondria isolated at a late stage of NPC disease (4).
Several reports in recent years have indicated a role for oxidative stress in NPC disease (7, 14–17, 53). Oxidative stress can increase as a consequence of mitochondrial dysfunction and ROS production, and excessive ROS generation impairs mitochondrial function through oxidative damage of mitochondrial proteins, DNA, or lipids (11, 54, 55). Our findings suggest that elevated mitochondrial cholesterol levels contribute to the development of oxidative stress (e.g. through defects in oxidative phosphorylation or in mitochondrial glutathione import) (18) and that oxidative stress in turn promotes metabolic alterations. Initially, NPC1-deficient cells appear to be able to control ROS production through antioxidant response systems; however, over time, ROS generation may overwhelm cellular antioxidant capacities and become apparent as in the NPC1-deficient CHO-4-4-19 cells. Whether a similar sequence of mitochondrial cholesterol accumulation, oxidative stress, and metabolic alterations would occur in NPC1-deficient brain and at what stage of the disease these alterations would develop are not clear. In murine Npc1−/− cerebellum, mRNA levels of the antioxidant response factor Nrf2, which is expressed as a cellular response to even mild oxidative stress (56), are increased presymptomatically and remain elevated in later stages of NPC disease (7). Treatment of NPC1-deficient mice with the antioxidant NAC starting at the onset of symptoms caused only limited improvements of disease pathology (16). Antioxidant treatment at even earlier stages might be more beneficial, but it is difficult to implement in human patients, where diagnosis is often delayed beyond the onset of overt symptoms.
Our findings show that mitochondrial cholesterol can regulate mitochondrial function and energy metabolism. It therefore seems likely that increased mitochondrial cholesterol levels also lead to metabolic alterations in NPC1-deficient brains. However, the consequences of such metabolic alterations on the neuropathology in NPC disease are not yet known.
Acknowledgments
The excellent technical help of Debra Fice and René Rost is gratefully acknowledged. We thank Laura Liscum for the CHO-4-4-19 cells and parental CHO-K1 cells and thank Hiromi Imamura (Osaka University, Japan) for the generous gift of the mtAT1.03 vector.
This work was supported by Nova Scotia Health Research Foundation Grant MED-PROJECT-2010-6804 and Natural Sciences and Engineering Research Council of Canada Discovery Grant 401978-2011.
- NPC
- Niemann-Pick type C
- PDH
- pyruvate dehydrogenase
- OCR
- oxygen consumption rate
- FCCP
- carbonyl cyanide p-trifluoromethoxyphenylhydrazone
- ROS
- reactive oxygen species
- mitoATP
- mitochondrial ATP
- shNT
- non-targeting shRNA
- shNPC1 and shNPC2
- shRNA against NPC1 and NPC2, respectively
- VDAC
- voltage-dependent anion channel
- siNT
- non-targeting siRNA
- siNPC1
- siRNA targeting NPC1
- siMLN64
- siRNA targeting MLN64
- NAC
- N-acetylcysteine.
REFERENCES
- 1. Wang M. L., Motamed M., Infante R. E., Abi-Mosleh L., Kwon H. J., Brown M. S., Goldstein J. L. (2010) Identification of surface residues on Niemann-Pick C2 essential for hydrophobic handoff of cholesterol to NPC1 in lysosomes. Cell Metab. 12, 166–173 [DOI] [PMC free article] [PubMed] [Google Scholar]
- 2. Deffieu M. S., Pfeffer S. R. (2011) Niemann-Pick type C1 function requires lumenal domain residues that mediate cholesterol-dependent NPC2 binding. Proc. Natl. Acad. Sci. U.S.A. 108, 18932–18936 [DOI] [PMC free article] [PubMed] [Google Scholar]
- 3. Infante R. E., Wang M. L., Radhakrishnan A., Kwon H. J., Brown M. S., Goldstein J. L. (2008) NPC2 facilitates bidirectional transfer of cholesterol between NPC1 and lipid bilayers, a step in cholesterol egress from lysosomes. Proc. Natl. Acad. Sci. U.S.A. 105, 15287–15292 [DOI] [PMC free article] [PubMed] [Google Scholar]
- 4. Yu W., Gong J. S., Ko M., Garver W. S., Yanagisawa K., Michikawa M. (2005) Altered cholesterol metabolism in Niemann-Pick type C1 mouse brains affects mitochondrial function. J. Biol. Chem. 280, 11731–11739 [DOI] [PubMed] [Google Scholar]
- 5. Charman M., Kennedy B. E., Osborne N., Karten B. (2010) MLN64 mediates egress of cholesterol from endosomes to mitochondria in the absence of functional Niemann-Pick Type C1 protein. J. Lipid Res. 51, 1023–1034 [DOI] [PMC free article] [PubMed] [Google Scholar]
- 6. Fernández A., Llacuna L., Fernández-Checa J. C., Colell A. (2009) Mitochondrial cholesterol loading exacerbates amyloid β peptide-induced inflammation and neurotoxicity. J. Neurosci. 29, 6394–6405 [DOI] [PMC free article] [PubMed] [Google Scholar]
- 7. Kennedy B. E., LeBlanc V. G., Mailman T. M., Fice D., Burton I., Karakach T. K., Karten B. (2013) Pre-symptomatic activation of antioxidant responses and alterations in glucose and pyruvate metabolism in Niemann-Pick type c1-deficient murine brain. PLoS One 8, e82685. [DOI] [PMC free article] [PubMed] [Google Scholar]
- 8. Ordonez M. P., Roberts E. A., Kidwell C. U., Yuan S. H., Plaisted W. C., Goldstein L. S. (2012) Disruption and therapeutic rescue of autophagy in a human neuronal model of Niemann Pick type C1. Hum. Mol. Genet. 21, 2651–2662 [DOI] [PMC free article] [PubMed] [Google Scholar]
- 9. Echegoyen S., Oliva E. B., Sepulveda J., Díaz-Zagoya J. C., Espinosa-García M. T., Pardo J. P., Martínez F. (1993) Cholesterol increase in mitochondria: its effect on inner-membrane functions, submitochondrial localization and ultrastructural morphology. Biochem. J. 289, 703–708 [DOI] [PMC free article] [PubMed] [Google Scholar]
- 10. Feo F., Canuto R. A., Garcea R., Gabriel L. (1975) Effect of cholesterol content on some physical and functional properties of mitochondria isolated from adult rat liver, fetal liver, cholesterol-enriched liver and hepatomas AH-130, 3924A and 5123. Biochim. Biophys. Acta 413, 116–134 [DOI] [PubMed] [Google Scholar]
- 11. Montero J., Mari M., Colell A., Morales A., Basañez G., Garcia-Ruiz C., Fernández-Checa J. C. (2010) Cholesterol and peroxidized cardiolipin in mitochondrial membrane properties, permeabilization and cell death. Biochim. Biophys. Acta 1797, 1217–1224 [DOI] [PMC free article] [PubMed] [Google Scholar]
- 12. Baggetto L. G., Clottes E., Vial C. (1992) Low mitochondrial proton leak due to high membrane cholesterol content and cytosolic creatine kinase as two features of the deviant bioenergetics of Ehrlich and AS30-D tumor cells. Cancer Res. 52, 4935–4941 [PubMed] [Google Scholar]
- 13. Colell A., García-Ruiz C., Lluis J. M., Coll O., Mari M., Fernández-Checa J. C. (2003) Cholesterol impairs the adenine nucleotide translocator-mediated mitochondrial permeability transition through altered membrane fluidity. J. Biol. Chem. 278, 33928–33935 [DOI] [PubMed] [Google Scholar]
- 14. Vázquez M. C., Balboa E., Alvarez A. R., Zanlungo S. (2012) Oxidative stress: a pathogenic mechanism for Niemann-Pick type C disease. Oxid. Med. Cell Longev. 2012, 205713. [DOI] [PMC free article] [PubMed] [Google Scholar]
- 15. Fu R., Yanjanin N. M., Bianconi S., Pavan W. J., Porter F. D. (2010) Oxidative stress in Niemann-Pick disease, type C. Mol. Genet. Metab. 101, 214–218 [DOI] [PMC free article] [PubMed] [Google Scholar]
- 16. Fu R., Wassif C. A., Yanjanin N. M., Watkins-Chow D. E., Baxter L. L., Incao A., Liscum L., Sidhu R., Firnkes S., Graham M., Ory D. S., Porter F. D., Pavan W. J. (2013) Efficacy of N-acetylcysteine in phenotypic suppression of mouse models of Niemann-Pick disease, type C1. Hum. Mol. Genet. 22, 3508–3523 [DOI] [PMC free article] [PubMed] [Google Scholar]
- 17. Jiang X., Sidhu R., Porter F. D., Yanjanin N. M., Speak A. O., te Vruchte D. T., Platt F. M., Fujiwara H., Scherrer D. E., Zhang J., Dietzen D. J., Schaffer J. E., Ory D. S. (2011) A sensitive and specific LC-MS/MS method for rapid diagnosis of Niemann-Pick C1 disease from human plasma. J. Lipid Res. 52, 1435–1445 [DOI] [PMC free article] [PubMed] [Google Scholar]
- 18. Marí M., Caballero F., Colell A., Morales A., Caballeria J., Fernandez A., Enrich C., Fernandez-Checa J. C., García-Ruiz C. (2006) Mitochondrial free cholesterol loading sensitizes to TNF- and Fas-mediated steatohepatitis. Cell Metab. 4, 185–198 [DOI] [PubMed] [Google Scholar]
- 19. Montero J., Morales A., Llacuna L., Lluis J. M., Terrones O., Basañez G., Antonsson B., Prieto J., García-Ruiz C., Colell A., Fernández-Checa J. C. (2008) Mitochondrial cholesterol contributes to chemotherapy resistance in hepatocellular carcinoma. Cancer Res. 68, 5246–5256 [DOI] [PubMed] [Google Scholar]
- 20. Parlo R. A., Coleman P. S. (1984) Enhanced rate of citrate export from cholesterol-rich hepatoma mitochondria. The truncated Krebs cycle and other metabolic ramifications of mitochondrial membrane cholesterol. J. Biol. Chem. 259, 9997–10003 [PubMed] [Google Scholar]
- 21. Rouslin W., MacGee J., Gupte S., Wesselman A., Epps D. E. (1982) Mitochondrial cholesterol content and membrane properties in porcine myocardial ischemia. Am. J. Physiol. 242, H254–H259 [DOI] [PubMed] [Google Scholar]
- 22. Paradis S., Leoni V., Caccia C., Berdeaux A., Morin D. (2013) Cardioprotection by the TSPO ligand 4′-chlorodiazepam is associated with inhibition of mitochondrial accumulation of cholesterol at reperfusion. Cardiovasc. Res. 98, 420–427 [DOI] [PubMed] [Google Scholar]
- 23. Colell A., Fernández A., Fernández-Checa J. C. (2009) Mitochondria, cholesterol and amyloid beta peptide: a dangerous trio in Alzheimer disease. J. Bioenerg. Biomembr. 41, 417–423 [DOI] [PubMed] [Google Scholar]
- 24. Barbero-Camps E., Fernández A., Martínez L., Fernández-Checa J. C., Colell A. (2013) APP/PS1 mice overexpressing SREBP-2 exhibit combined Abeta accumulation and tau pathology underlying Alzheimer's disease. Hum. Mol. Genet. 22, 3460–3476 [DOI] [PMC free article] [PubMed] [Google Scholar]
- 25. Alpy F., Stoeckel M. E., Dierich A., Escola J. M., Wendling C., Chenard M. P., Vanier M. T., Gruenberg J., Tomasetto C., Rio M. C. (2001) The steroidogenic acute regulatory protein homolog MLN64, a late endosomal cholesterol-binding protein. J. Biol. Chem. 276, 4261–4269 [DOI] [PubMed] [Google Scholar]
- 26. Zhang M., Liu P., Dwyer N. K., Christenson L. K., Fujimoto T., Martinez F., Comly M., Hanover J. A., Blanchette-Mackie E. J., Strauss J. F., 3rd (2002) MLN64 mediates mobilization of lysosomal cholesterol to steroidogenic mitochondria. J. Biol. Chem. 277, 33300–33310 [DOI] [PubMed] [Google Scholar]
- 27. Kennedy B. E., Charman M., Karten B. (2012) Niemann-Pick Type C2 protein contributes to the transport of endosomal cholesterol to mitochondria without interacting with NPC1. J. Lipid Res. 53, 2632–2642 [DOI] [PMC free article] [PubMed] [Google Scholar]
- 28. Dahl N. K., Reed K. L., Daunais M. A., Faust J. R., Liscum L. (1992) Isolation and characterization of Chinese hamster ovary cells defective in the intracellular metabolism of low density lipoprotein-derived cholesterol. J. Biol. Chem. 267, 4889–4896 [PubMed] [Google Scholar]
- 29. Storch J., Xu Z. (2009) Niemann-Pick C2 (NPC2) and intracellular cholesterol trafficking. Biochim. Biophys. Acta 1791, 671–678 [DOI] [PMC free article] [PubMed] [Google Scholar]
- 30. Kristián T., Hopkins I. B., McKenna M. C., Fiskum G. (2006) Isolation of mitochondria with high respiratory control from primary cultures of neurons and astrocytes using nitrogen cavitation. J. Neurosci. Methods 152, 136–143 [DOI] [PMC free article] [PubMed] [Google Scholar]
- 31. Imamura H., Nhat K. P., Togawa H., Saito K., Iino R., Kato-Yamada Y., Nagai T., Noji H. (2009) Visualization of ATP levels inside single living cells with fluorescence resonance energy transfer-based genetically encoded indicators. Proc. Natl. Acad. Sci. U.S.A. 106, 15651–15656 [DOI] [PMC free article] [PubMed] [Google Scholar]
- 32. Waldeck-Weiermair M., Jean-Quartier C., Rost R., Khan M. J., Vishnu N., Bondarenko A. I., Imamura H., Malli R., Graier W. F. (2011) Leucine zipper EF hand-containing transmembrane protein 1 (Letm1) and uncoupling proteins 2 and 3 (UCP2/3) contribute to two distinct mitochondrial Ca2+ uptake pathways. J. Biol. Chem. 286, 28444–28455 [DOI] [PMC free article] [PubMed] [Google Scholar]
- 33. Ahn W. S., Antoniewicz M. R. (2013) Parallel labeling experiments with [1,2-13C]glucose and [U-13C]glutamine provide new insights into CHO cell metabolism. Metab. Eng. 15, 34–47 [DOI] [PubMed] [Google Scholar]
- 34. Brand M. D., Nicholls D. G. (2011) Assessing mitochondrial dysfunction in cells. Biochem. J. 435, 297–312 [DOI] [PMC free article] [PubMed] [Google Scholar]
- 35. Vishnu N., Jadoon Khan M., Karsten F., Groschner L. N., Waldeck-Weiermair M., Rost R., Hallström S., Imamura H., Graier W. F., Malli R. (2014) ATP increases within the lumen of the endoplasmic reticulum upon intracellular Ca2+-release. Mol. Biol. Cell 25, 368–379 [DOI] [PMC free article] [PubMed] [Google Scholar]
- 36. Cologna S. M., Jiang X. S., Backlund P. S., Cluzeau C. V., Dail M. K., Yanjanin N. M., Siebel S., Toth C. L., Jun H. S., Wassif C. A., Yergey A. L., Porter F. D. (2012) Quantitative proteomic analysis of Niemann-Pick disease, type C1 cerebellum identifies protein biomarkers and provides pathological insight. PLoS One 7, e47845. [DOI] [PMC free article] [PubMed] [Google Scholar]
- 37. Ahn W. S., Antoniewicz M. R. (2011) Metabolic flux analysis of CHO cells at growth and non-growth phases using isotopic tracers and mass spectrometry. Metab. Eng. 13, 598–609 [DOI] [PubMed] [Google Scholar]
- 38. Tuckey R. C., Bose H. S., Czerwionka I., Miller W. L. (2004) Molten globule structure and steroidogenic activity of N-218 MLN64 in human placental mitochondria. Endocrinology 145, 1700–1707 [DOI] [PubMed] [Google Scholar]
- 39. Murcia M., Faráldo-Gómez J. D., Maxfield F. R., Roux B. (2006) Modeling the structure of the StART domains of MLN64 and StAR proteins in complex with cholesterol. J. Lipid Res. 47, 2614–2630 [DOI] [PubMed] [Google Scholar]
- 40. Reitz J., Gehrig-Burger K., Strauss J. F., 3rd, Gimpl G. (2008) Cholesterol interaction with the related steroidogenic acute regulatory lipid-transfer (START) domains of StAR (STARD1) and MLN64 (STARD3). FEBS J. 275, 1790–1802 [DOI] [PubMed] [Google Scholar]
- 41. Xu S., Benoff B., Liou H. L., Lobel P., Stock A. M. (2007) Structural basis of sterol binding by NPC2, a lysosomal protein deficient in Niemann-Pick type C2 disease. J. Biol. Chem. 282, 23525–23531 [DOI] [PMC free article] [PubMed] [Google Scholar]
- 42. Ko D. C., Binkley J., Sidow A., Scott M. P. (2003) The integrity of a cholesterol-binding pocket in Niemann-Pick C2 protein is necessary to control lysosome cholesterol levels. Proc. Natl. Acad. Sci. U.S.A. 100, 2518–2525 [DOI] [PMC free article] [PubMed] [Google Scholar]
- 43. Garcia-Ruiz C., Mari M., Colell A., Morales A., Caballero F., Montero J., Terrones O., Basañez G., Fernández-Checa J. C. (2009) Mitochondrial cholesterol in health and disease. Histol. Histopathol. 24, 117–132 [DOI] [PubMed] [Google Scholar]
- 44. Prabhu A. V., Krycer J. R., Brown A. J. (2013) Overexpression of a key regulator of lipid homeostasis, Scap, promotes respiration in prostate cancer cells. FEBS Lett. 587, 983–988 [DOI] [PubMed] [Google Scholar]
- 45. Paradies G., Ruggiero F. M. (1990) Age-related changes in the activity of the pyruvate carrier and in the lipid composition in rat-heart mitochondria. Biochim. Biophys. Acta 1016, 207–212 [DOI] [PubMed] [Google Scholar]
- 46. Paradies G., Ruggiero F. M., Dinoi P. (1991) The influence of hypothyroidism on the transport of phosphate and on the lipid composition in rat-liver mitochondria. Biochim. Biophys. Acta 1070, 180–186 [DOI] [PubMed] [Google Scholar]
- 47. Paradies G., Ruggiero F. M. (1991) Effect of aging on the activity of the phosphate carrier and on the lipid composition in rat liver mitochondria. Arch. Biochem. Biophys. 284, 332–337 [DOI] [PubMed] [Google Scholar]
- 48. Pastorino J. G., Hoek J. B. (2008) Regulation of hexokinase binding to VDAC. J. Bioenerg. Biomembr. 40, 171–182 [DOI] [PMC free article] [PubMed] [Google Scholar]
- 49. Hiller S., Garces R. G., Malia T. J., Orekhov V. Y., Colombini M., Wagner G. (2008) Solution structure of the integral human membrane protein VDAC-1 in detergent micelles. Science 321, 1206–1210 [DOI] [PMC free article] [PubMed] [Google Scholar]
- 50. Campbell A. M., Chan S. H. (2007) The voltage dependent anion channel affects mitochondrial cholesterol distribution and function. Arch. Biochem. Biophys. 466, 203–210 [DOI] [PubMed] [Google Scholar]
- 51. Mlayeh L., Chatkaew S., Léonetti M., Homblé F. (2010) Modulation of plant mitochondrial VDAC by phytosterols. Biophys. J. 99, 2097–2106 [DOI] [PMC free article] [PubMed] [Google Scholar]
- 52. Thinnes F. P., Burckhardt G. (2012) On a fully closed state of native human type-1 VDAC enriched in Nonidet P40. Mol. Genet. Metab. 107, 632–633 [DOI] [PubMed] [Google Scholar]
- 53. Klein A., Maldonado C., Vargas L. M., Gonzalez M., Robledo F., Perez de Arce K., Muñoz F. J., Hetz C., Alvarez A. R., Zanlungo S. (2011) Oxidative stress activates the c-Abl/p73 proapoptotic pathway in Niemann-Pick type C neurons. Neurobiol. Dis. 41, 209–218 [DOI] [PubMed] [Google Scholar]
- 54. Shigenaga M. K., Hagen T. M., Ames B. N. (1994) Oxidative damage and mitochondrial decay in aging. Proc. Natl. Acad. Sci. U.S.A. 91, 10771–10778 [DOI] [PMC free article] [PubMed] [Google Scholar]
- 55. Lin M. T., Beal M. F. (2006) Mitochondrial dysfunction and oxidative stress in neurodegenerative diseases. Nature 443, 787–795 [DOI] [PubMed] [Google Scholar]
- 56. Bell K. F., Al-Mubarak B., Fowler J. H., Baxter P. S., Gupta K., Tsujita T., Chowdhry S., Patani R., Chandran S., Horsburgh K., Hayes J. D., Hardingham G. E. (2011) Mild oxidative stress activates Nrf2 in astrocytes, which contributes to neuroprotective ischemic preconditioning. Proc. Natl. Acad. Sci. U.S.A. 108, E1–E2 [DOI] [PMC free article] [PubMed] [Google Scholar]