

Background: The structure and function of NAD glycohydrolases (NADases) with pure hydrolytic activity are unclear.
Results: We show that a novel NADase, exclusively expressed in rabbit reticulocytes, affects erythropoiesis.
Conclusion: The intracellular NAD level regulated by the NADase is critical for erythropoiesis.
Significance: We show that NADase activity regulates erythropoiesis of hematopoietic stem cells.
Keywords: CD38, Erythrocyte, Erythropoiesis, Nicotinamide, Nicotinamide Adenine Dinucleotide (NAD), NAD Glycohydrolase, Hematopoietic Stem Cell, Intracellular NAD, Reticulocytes
Abstract
NAD glycohydrolases (NADases) catalyze the hydrolysis of NAD to ADP-ribose and nicotinamide. Although many members of the NADase family, including ADP-ribosyltransferases, have been cloned and characterized, the structure and function of NADases with pure hydrolytic activity remain to be elucidated. Here, we report the structural and functional characterization of a novel NADase from rabbit reticulocytes. The novel NADase is a glycosylated, glycosylphosphatidylinositol-anchored cell surface protein exclusively expressed in reticulocytes. shRNA-mediated knockdown of the NADase in bone marrow cells resulted in a reduction of erythroid colony formation and an increase in NAD level. Furthermore, treatment of bone marrow cells with NAD, nicotinamide, or nicotinamide riboside, which induce an increase in NAD content, resulted in a significant decrease in erythroid progenitors. These results indicate that the novel NADase may play a critical role in regulating erythropoiesis of hematopoietic stem cells by modulating intracellular NAD.
Introduction
Nicotinamide adenine dinucleotide (NAD) and NAD phosphate (NADP) are important coenzymes in metabolic reactions and substrates for a variety of signaling enzymes, including NAD glycohydrolases (NADases),2 poly(ADP-ribose) polymerases, ADP-ribosyltransferases (ARTs), ADP-ribosyl cyclases, and Sirtuins. These enzymes catalyze specific reactions using NAD(P) as substrates. NADases catalyze the hydrolysis of NAD to ADP-ribose (ADPR) and nicotinamide; ARTs mono-ADP-ribosylate proteins; poly(ADP-ribose) polymerases poly(ADP-ribosyl)ate proteins; ADP-ribosyl cyclases synthesize Ca2+-signaling second messengers, cyclic ADP-ribose, and nicotinic acid adenine dinucleotide phosphate and catalyze their hydrolysis; and Sirtuins synthesize O-acetyl-ADPR and deacetylate protein.
An NADase with relatively pure NAD hydrolytic activity from Neurospora crassa has long been known (1). Another enzyme from the Gram-positive pathogen Streptococcus pyogenes was reported to be an NADase with no apparent ART, ADP-ribosyl cyclase, or cyclic ADPR hydrolase activities (2). We identified and characterized a rabbit erythrocyte enzyme with pure NADase activity (3) that was anchored to the plasma membrane via a glycosylphosphatidylinositol (GPI) linkage and could be solubilized by incubation with Bacillus cereus phosphatidylinositol-specific phospholipase C (PI-PLC) (4, 5).
Of the NAD-degrading enzymes, which have the potential to control of NAD(P) levels, CD38, a mammalian ADP-ribosyl cyclase that exhibits significant NADase activity in addition to its intrinsic ADP-ribosyl cyclase activity, has been the most extensively studied (6). CD38 knock-out mice showed significantly higher tissue NAD levels than wild type, suggesting that CD38 may play a role in the control of NAD(P) levels (7). A previous study investigated a correlation between CD38 expression and erythroid differentiation in CD34+ progenitor cells. The CD34+/CD38+ population included 25–30% clonogenic progenitors with a mature erythroid phenotype, whereas the CD34+/CD38− population was mostly primitive progenitors (8), suggesting that CD38 might affect erythroid differentiation.
In the erythroid lineage, the earliest committed progenitors, the slowly proliferating burst-forming unit-erythroid (BFU-E) cells, divide and further differentiate through the maturation stage into rapidly dividing colony-forming unit-erythroid (CFU-E). CFU-E progenitors divide and differentiate into red blood cells (9). BFU-E cells respond to many hormones and cytokines, including erythropoietin, stem cell factor, insulin-like growth factor 1, glucocorticoids, IL-3, and IL-6, whereas the terminal proliferation and differentiation of CFU-E progenitors are stimulated by erythropoietin, which is induced under hypoxic conditions (10). However, additional regulatory factors for proliferation and differentiation of these progenitor cells are being investigated.
In the present study, we report for the first time a novel enzyme from eukaryotes with pure NADase activity (designated as “NADase” here). We characterized this enzyme on a molecular level, especially in comparison with rabbit skeletal muscle ART, which exhibits the most similar primary structure but has different enzymatic activity. The rabbit enzyme showed a restricted pattern of tissue expression limited to erythroid. We also found that the novel NADase plays a critical role in regulating erythropoiesis of hematopoietic stem cells by modulating intracellular NAD content.
EXPERIMENTAL PROCEDURES
Materials
Erythrocytes were obtained from New Zealand White rabbits (3 months old). PI-PLC from Bacillus cereus was purified as described (4). Nicotinamide 1,N6-ethenoadenine dinucleotide (ϵ-NAD+), Cibacron Blue 3GA, and Sephacryl S-200HR were purchased from Sigma-Aldrich. Octyl-Sepharose CL-4B was from GE Healthcare. Total RNA preparation kits (easy-Blue and easy-spin Total RNA Extraction kit) were from iNtRON Biotechnology (Seongnam, Korea). SuperScriptTM II reverse transcriptase was from Invitrogen. CapFishingTM Full-length cDNA Premix kit was from Seegene (Seoul, Korea). [α-32P]dCTP (3,000 Ci/mmol) and β-[adenine-2,8-3H]NAD (28.6 Ci/mmol) were from PerkinElmer Life Sciences. The Prime-a-Gene Labeling System was from Promega (Madison, WI).
Purification of NADase
NADase was purified from rabbit erythrocytes as described (3). One liter of packed rabbit erythrocytes was washed three times with ice-cold PBS and incubated for 1 h with shaking with bacterial PI-PLC (1 μg/ml) in PBS. After incubation, the supernatant was collected by centrifugation (1,000 × g) at 4 °C and applied to a Cibacron Blue 3GA column (5 × 30 cm), which had been equilibrated with buffer A (10 mm potassium phosphate, pH 6.8, 50 mm NaCl, 0.1 mm PMSF). The column was washed and eluted with a linear gradient of buffer B (2 m NaCl in buffer A). Fractions containing NADase activity were applied to an octyl-Sepharose CL4B column (3 × 30 cm) equilibrated with buffer B followed by washing with buffer B and elution with a linear gradient of buffer C (30% ethylene glycol in buffer A). The eluted fractions were concentrated to 1 ml (Centriprep YM-10). The resulting solution was loaded on a Sephacryl S-200HR gel filtration column (1.5 × 120 cm), which was equilibrated and eluted with buffer A. High activity fractions were subjected to SDS-PAGE. A summary of the purification is given in Table 1.
TABLE 1.
Summary of purification of NAD glycohydrolase from rabbit erythrocytes
NAD glycohydrolase activity of each fraction was determined by measuring the formation of the fluorescent product ϵ-ADPR from the substrate ϵ-NAD+.
| Purification step | Protein | Total activity | Specific activity | -Fold | Yield |
|---|---|---|---|---|---|
| mg | μmol·min−1 | μmol·min−1·mg−1 | % | ||
| PI-PLC extracts | 1,230.0 | 1,130.0 | 0.9 | 1 | 100 |
| Cibacron Blue 3GA | 22.0 | 812.0 | 48.5 | 53 | 72 |
| Octyl-Sepharose CL-4B | 1.1 | 76.4 | 69.5 | 76 | 6.8 |
| Sephacryl S-200HR | 0.8 | 59.6 | 74.5 | 81 | 5.3 |
In-gel Activity Measurement of NADase
Purified NADase was separated by non-reducing SDS-PAGE (12% gel), and the activity of NADase in the gel was measured with 150 μm ϵ-NAD+ as described previously (11). The apparent molecular mass of a protein corresponding to a fluorescent band was estimated by marking the band with a needle and, after staining the gel with Coomassie Brilliant Blue, comparing its position with those of marker proteins.
Mass Spectrometry
Quadrupole TOF analysis of trypsin-digested peptide fragments of purified proteins was performed by PROTEINWORKS Inc. (Daejeon, Korea).
5′- and 3′-Rapid Amplification of cDNA Ends (RACE)
The first cDNA strand was synthesized from 2 μg of total RNA using SuperScript II reverse transcriptase by following the manual from the CapFishing cDNA isolation kit. PCR was performed using i-StarTaq DNA polymerase (iNtRON Biotechnology) with 5′- or 3′-RACE primers and gene-specific RACE primers. Full-length cDNA was generated by two-step PCR following the manufacturer's protocol.
RT-PCR
Total RNA was isolated from rabbit reticulocytes and reverse transcribed into cDNA with oligo(dT)12–18 and amplified using primers to generate a partial PCR product (Table 2). Forty cycles of amplification were carried out as follows: 1 min at 94 °C, 1 min at 62 °C, and 1 min at 72 °C followed by 10-min elongation at 72 °C. The amplified products were separated on 1.5% agarose gels, blotted, and hybridized with 32P-labeled specific probes; bound radioactivity was quantified by autoradiography.
TABLE 2.
Oligonucleotides used in the analysis of NADase
Oligonucleotides are listed from 5′ to 3′. H stands for A, T, and C; R stands for A and G; Y stands for C and T; N stands for A, T, G, and C; and D stands for G, A, and T.
| Name | Sequence (5′–3′) | Amino acids |
|---|---|---|
| For partial PCR product | ||
| rbNA-5′ | ATHCARGAYGCNCARCTNGAYAT | 20–26 |
| rbAR-3′ | TCRAANGGNGGDATNAGNACYTC | 227–220 |
| rbAR-r | GATGACCTGGAAGGTCTC | 232–227 |
| For 5′-, 3′-RACE PCR | ||
| NA-m1-f | TGGAGGCAAGACAGAAGTGGCA | 66–73 |
| NA-m1-r | TGCCACTTCTGTCTTGCCTCCA | 73–66 |
| NA-m2-f | CCCCACAAGGCTGCCCCCCT | 80–86 |
| NA-m2-r | AGGGGGGCAGCCTTGTGGGG | 86–80 |
Glycosylation Assay
Purified rabbit erythrocyte NADase was denatured and treated with peptide-N-glycosidase F (PNGase F) (New England Biolabs) according to the manufacturer's instructions before Western blot analysis.
Cell Culture
HEK293 cells were cultured in Dulbecco's modified Eagle's medium (DMEM) supplemented with 10% fetal bovine serum (FBS), 100 units/ml penicillin, and 100 μg/ml streptomycin.
Preparation of the Antibody
Antibodies against purified NADase were raised in mice.
Treatment of NADase-transfected Cells with PI-PLC
For PI-PLC treatment, HEK293 cells transfected with NADase were incubated either in the absence or presence of 1 μg/ml PI-PLC at 37 °C for 1 h in 7 ml of HEPES buffer (156 mm NaCl, 3 mm KCl, 2 mm MgSO4, 1.25 mm KH2PO4, 10 mm d-glucose, 2 mm CaCl2, 10 mm HEPES, pH 7.4). The incubation medium was then collected and concentrated 10-fold using an Amicon Ultra centrifugal filter (3-kDa cutoff).
Confocal Microscopy
Green fluorescent protein (GFP)-NADase-transfected HEK293 cells were visualized using a confocal microscope (Carl Zeiss LSM 510 Meta). The respective excitation and emission wavelengths were 488 and 505–530 nm for GFP.
Western Blot Analysis
Lysed cells and purified samples were reduced and separated by SDS-PAGE (12% gel). The resolved proteins were transferred to a nitrocellulose membrane (Bio-Rad). The blots were blocked with 5% skim milk powder dissolved in TTBS (20 mm Tris-HCl, pH 7.6, 137 mm NaCl with 0.1% Tween 20). The blot was incubated with the primary antibody (mouse anti-rabbit NADase antiserum, 1:2,000 dilution; rabbit anti-FLAG polyclonal antibody (Sigma), 1:2,000 dilution) for 2 h at room temperature. The blot was washed five times with TTBS and then incubated with the secondary antibody (anti-mouse IgG conjugated to horseradish peroxidase, 1:5,000 dilution; anti-rabbit conjugated to horseradish peroxidase (Santa Cruz Biotechnology), 1:2,000 dilution) for 2 h at room temperature. The blots were developed using an enhanced chemiluminescence kit (Amersham Biosciences) and exposed to an LAS 1000 Image Reader Lite (Fujifilm, Tokyo, Japan). Protein concentrations were determined using a Bio-Rad protein assay kit with bovine serum albumin (BSA) as the standard.
Plasmids and Transfection
Wild-type NADase cDNA was cloned from rabbit reticulocyte cDNA, and ART active site mutant NADases Q218E, Q218A, and Q218D (NADase Q218E, NADase Q218A, and NADase Q218D) were synthesized by replacing glutamine with glutamate, alanine and aspartate, respectively. Rabbit ART (ART) was cloned from rabbit skeletal muscle cDNA. NADase, NADase Q218E, NADase Q218A, NADase Q218D, and ART were amplified by PCR using EcoRI-NAex forward (5′-CGGAATTCCATGTGGGTTCCTGCCGTGGCG-3′) and SalI-NAex reverse (5′-ACGCGTCGACGAAGAGGCCTGGGCTTCCTGGGA-3′) primers. The italicized nucleotides are restriction enzyme sequences. The PCR products were gel-purified and digested with restriction enzymes, and the resulting 891-bp fragment (NADase and NADase Q218E, NADase Q218A, and NADase Q218D) and 981-bp fragment (ART) were ligated into a pFLAG-CMV2 expression vector. NADase was ligated into a pEGFP-C1 expression vector for GFP-NAD fusion protein expression. HEK293 cells were transfected with the plasmids using Lipofectamine 2000 transfection reagent (Invitrogen) according to the manufacturer's instructions. Cells were used 24 h post-transfection. For NADase and ART assays, transfected cells were resuspended in 1 ml of ice-cold lysis buffer (50 mm potassium phosphate, pH 7.2, 150 mm NaCl, 1 mm PMSF, 1% Nonidet P-40) and solubilized at 4 °C overnight.
Site-directed Mutagenesis
Site-directed mutagenesis was performed according to methods reported previously (12–14). Site-directed mutagenesis of NADase was performed using a Muta-DirectTM site-directed mutagenesis kit (iNtRON Biotechnology). The following oligonucleotides were used for the mutagenesis of NADase: 5′-GTCTTCCCTGGGGAGGCAGAGGTGCTGATC-3′ (Q218E), and 5′-GTCTTCCCTGGGGATGCAGAGGTGCTGATC-3′ (Q218D), 5′-GTCTTCCCTGGGGCGGCAGAGGTGCTGATC-3′ (Q218A) where the underlined nucleotide(s) was altered. Mutant clones were selected by sequencing. A pFLAG-CMV2 vector carrying either the wild-type or mutant NADase cDNA was expressed in HEK293 cells.
Northern Blot Analysis
Total RNA was isolated from rabbit tissues. For Northern blot analysis, 20 μg of total RNA was subjected to electrophoresis in a denaturing 1.2% agarose gel containing formaldehyde and ethidium bromide and then transferred to Hybond-N membranes (GE Healthcare). Membranes were prehybridized at 42 °C for 1–2 h in hybridization buffer (50% formamide, 5× saline/sodium phosphate/EDTA, 5× Denhardt's solution, 0.1% SDS, 100 μg/ml denatured salmon sperm DNA) and then hybridized overnight to the probe labeled with [α-32P]dCTP in a hybridization buffer. The membranes were washed twice at room temperature for 10 min in 2× SSC, 0.1% SDS; twice at room temperature for 15 min in 1× SSC, 0.1% SDS; and twice at 65 °C for 15 min in 0.1× SSC, 0.1% SDS. After air drying, membranes were evaluated by image analysis using a BAS 2000 system (Fujifilm).
NADase and ART Assays
NADase activity was determined by measuring etheno-ADPR formation fluorometrically using ϵ-NAD+ as a substrate (15, 16). Samples (20 μg) were incubated in the presence of 200 μm ϵ-NAD+ with or without an appropriate protein in an assay buffer (50 mm potassium phosphate, pH 7.2, 150 mm NaCl, 0.1% Nonidet P-40; final volume of 50 μl). The reaction mixture was incubated at 37 °C for 20 min. The reaction was stopped by adding 50 μl of trichloroacetic acid (10%). The samples were centrifuged at 15,000 × g for 10 min, and the supernatant (80 μl) was diluted with 720 μl of 100 mm sodium phosphate buffer, pH 7.2. Fluorescence of etheno-ADPR in solution was determined at excitation/emission wavelengths of 297/410 nm (Hitachi F-2500 fluorescence spectrophotometer). Assays were repeated five times.
ART activity was assayed in 300 μl of 50 mm potassium phosphate, pH 7.5 with 20 mm agmatine and 0.1 mm β-[adenine-2,8-3H]NAD (0.2 μCi). The reaction was initiated with enzyme (20 μg); after incubation at 30 °C for 1 h, samples (100 μl) were applied to a 2-ml column of Dowex AG 1-X2. [3H]ADP-ribosylagmatine was eluted with 5 ml of H2O (17, 18). 1 ml of elution sample was mixed with 2 ml of liquid scintillation counter mixture for liquid scintillation counting. Assays were repeated three times.
Preparation of shRNA-expressing Lentivirus
Experiments involving shRNA-expressing lentivirus were performed according to the method of Han et al. (19) with some modifications. Oligonucleotides (NA42 shRNA, 5′-GGGCCTTCTGGAAGCAATTCACTCGAGTGAATTGCTTCCAGAAGGCCCTTTTT-3′; NA145 shRNA, 5′-AATCTCAACCTCACAGAGTTCCTCGAGGAACTCTGTGAGGTTGAGATTTTTTT-3′; NA751 shRNA, 5′-AAGCACAGTTCATACAACTGCCTCGAGGCAGTTGTATGAACTGTGCTTTTTTT-3′ for rabbit NADase and 5′-GGACAGGTATCGGGGTTACTCCTCGAGGAGTAACCCCGATACCTGTCCTTTTT-3′ for a scrambled sequence) containing the sense, loop, and antisense sequences and a polythymidine tract were annealed and ligated into pLK0.1 downstream of the U6 promoter. To produce shRNA-expressing lentiviral particles, HEK293-FT cells were transfected with 9 μg of Virapower packaging mixture (Invitrogen) and 3 μg of pLK0.1-NADase shRNAs or pLK0.1-scrambled shRNA with Lipofectamine 2000 (Invitrogen).
Purification and Lentiviral Transduction of Bone Marrow
Purification of bone marrow cells was performed according to the method of Lutton et al. (20). Adult New Zealand White rabbits were used as bone marrow donors. Rabbits were sacrificed by anesthesia. Bone marrow cells were harvested from femora and tibiae. Bone marrow was flushed with Iscove's modified Dulbecco's medium. Bone marrow cells were washed three times with ice-cold PBS, and red blood cells (RBCs) were removed by RBC lysis buffer. After removing adherent cells, the cells were prestimulated in Iscove's modified Dulbecco's medium containing 10% FBS and the following growth factors: mouse stem cell factor, human thrombopoietin, and human Flt3 ligand (R&D System) at 10 ng/ml each for 24 h. The prestimulated bone marrow cells were infected with scrambled or NADase shRNA-expressing lentivirus in the presence of Polybrene (8 μg/ml) and selected with puromycin at 5.0 μg/ml for 3 days.
Quantification of Erythropoiesis
The cells transduced with shRNAs expressing lentivirus were plated in triplicate at a density of 2 × 10⁵ cells/plate in MethoCult M3334 (StemCell Technologies) to quantify the formation of CFU-E and mature BFU-E following the manufacturer's instructions. Colonies were scored after 7–10 days.
Measurement of Intracellular NAD Concentration ([NAD]i) and ADPR Concentration ([ADPR]i)
Cells were sonicated with 0.2 ml of 0.6 m perchloric acid. Precipitates were removed by centrifugation at 20,000 × g for 10 min at 4 °C, and perchloric acid was neutralized with 60 μl of 2 m KHCO3 (21). After centrifugation at 16,000 × g for 10 min at 4 °C, the precipitates were removed. The [NAD]i was measured using a cyclic enzyme assay as described previously (22). Briefly, the supernatants (100 μl/tube) were further incubated with 100 μl of a cycling reagent solution (2% ethanol, 100 μg/ml alcohol dehydrogenase, 20 μm resazurin, 10 μg/ml diaphorase, 10 μm riboflavin 5′-phosphate, 10 mm nicotinamide, 0.1 mg/ml BSA, 100 mm sodium phosphate, pH 8.0) at room temperature for 2 h. An increase in the resorufin fluorescence was measured at 544-nm excitation and 590-nm emission using a fluorescence plate reader (Spectra-Max GEMINI, Molecular Devices). Various known concentrations of NAD were also included in the cycling reaction to generate a standard curve. The [ADPR]i was measured using LC-MS/MS as described (23). Briefly, to determine the [ADPR]i, the supernatants were loaded onto a Waters ACQUITY UPLC system coupled to a Waters Xevo TQ-S mass spectrometer and separated by a BEH Amide column (Waters ACQUITY UPLC BEH Amide, 130 Å, 1.7 μm, 2.1 × 50 mm). All chromatographic separations were performed using each mobile phase combination at a flow rate of 0.5 ml/min. The column was equilibrated with 100% buffer B (90% acetonitrile, 10% 50 mm ammonium formate) and eluted in a 5-min gradient to 60% buffer A (10 mm ammonium formate in water). The column was then rinsed with 100% buffer A and re-equilibrated with buffer B before the next injection. The following parameters were optimized for ADPR MS analysis: cone gas, 150 liters/h; nebulizer, 7 bars; and desolvation temperature, 350 °C. The confirmation ion transitions for quantification were m/z 558.17 → 346.01 for ADPR.
Statistical Analysis
Data represent the means ± S.E. of at least three separate experiments. Statistical analysis was performed using Student's t test. A value of p < 0.05 was considered significant.
RESULTS AND DISCUSSION
Purification and Characterization of NADase
The purification procedure was essentially the same as described in our previous report, beginning with the PI-PLC-cleaved enzyme obtained from intact rabbit erythrocytes (4). The NADase was purified 81-fold with respect to the PI-PLC-treated supernatant (Table 1). The purified enzyme gave a single protein band with an apparent molecular mass of 40 kDa by electrophoresis in 12% SDS-polyacrylamide gels (Fig. 1A). Tryptic digestion and amino acid sequencing of the tryptic peptides were performed using the activity fractions of Sephacryl S-200HR.
FIGURE 1.
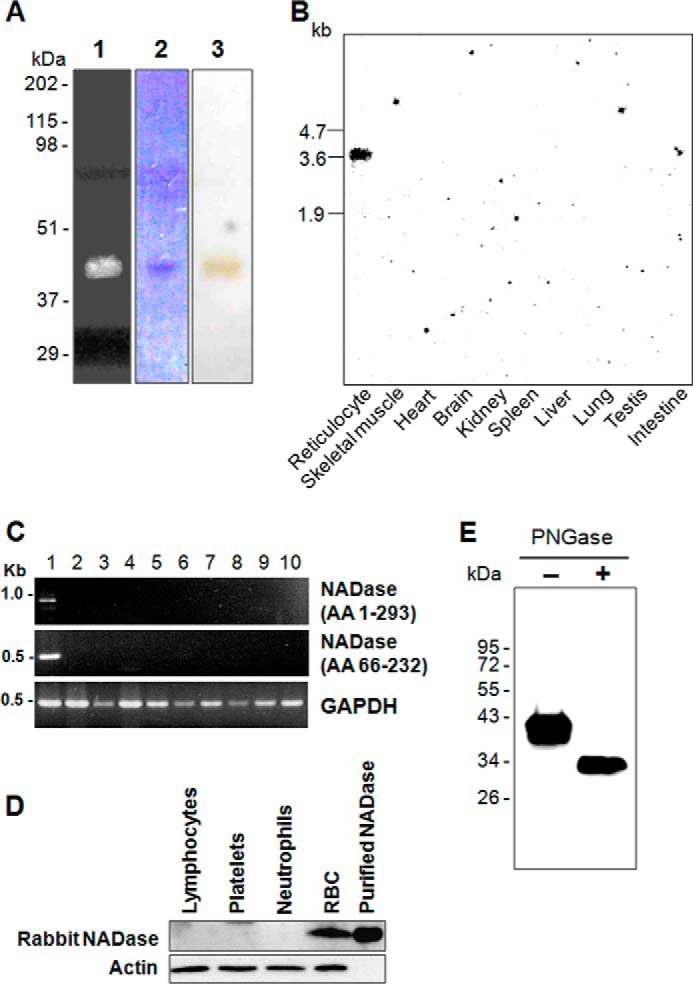
Expression and purification of NADase in rabbit erythrocytes. A, purification of NADase from rabbit erythrocytes. Visualization of NADase with an in-gel assay (lane 1), Coomassie Blue staining (lane 2), and silver staining (lane 3) is shown. The gel was washed with 0.1% Triton X-100 and incubated with 150 μm ϵ-NAD+ as described under “Experimental Procedures.” Fluorescence of NADase in lane 1 was visualized under UV light (254 nm). Purification was repeated five times. B, Northern blot analysis of NADase using rabbit tissues. Each lane contains 20 μg of total RNA from rabbit tissues. Positions of RNA standards (kilobases (kb)) are indicated (n = 3). C, RT-PCR analysis of NADase in rabbit tissues. Total RNA was isolated from various rabbit tissues. Lane 1, reticulocytes; lane 2, skeletal muscle; lane 3, heart; lane 4, brain; lane 5, kidney; lane 6, spleen; lane 7, liver; lane 8, lung; lane 9, testis; lane 10, intestine. AA, amino acids. D, Western blot analysis of NADase in rabbit blood cells. Western blot analysis was performed using an anti-NADase antibody. E, NADase is a glycosylated protein. Western blot analysis was performed using an anti-NADase antibody. Samples were treated with (+) or without (−) PNGase F as described under “Experimental Procedures.”
Cloning of NADase
The amino acid sequence of one of the tryptic peptides (amino acids 20–40) was used to synthesize two sets of degenerate oligonucleotides, which were used as primers in PCR amplification, following rabbit reticulocyte first-strand cDNA synthesis. Significant amounts of PCR products were obtained with primers (rbNA-5′, rbAR-3′, and rbAR-r). On the basis of the partial cDNA sequence, oligonucleotide primers for 5′- and 3′-RACE PCR were designed. The cDNA obtained by RACE-PCR was 1,491 bp in length, encoding a 293 amino acid-long polypeptide with a calculated molecular mass of 32,769 Da (Fig. 2). The deduced amino acid sequence of this protein includes the sequences of all four tryptic peptides from the NADase protein. The NADase gene is located downstream of ART1 and ART1-like gene in chromosome 1 (Fig. 3). To confirm the tissue distribution of NADase, which was red blood cell-specific in the Western blot, we performed Northern blot and RT-PCR analyses with total RNA isolated from various rabbit tissues. The Northern blot analysis showed a 3.6 kb mRNA for the NADase (Fig. 1B), and the NADase-specific band appeared only in reticulocytes in both Northern blot and RT-PCR analyses (Fig. 1, B and C). To further examine whether other blood cells also express NADase, we performed Western blot analysis with various types of rabbit blood cells. NADase was expressed in red blood cells but not expressed in lymphocytes, platelets, and neutrophils (Fig. 1D).
FIGURE 2.

Nucleotide and deduced amino acid sequences of NADase. Nucleotide and amino acid sequences are numbered relative to the initiating methionine codon and the initiating methionine, respectively. Sequences found in tryptic peptides are underlined. Two in-frame stop codons upstream from the initiator codon are double underlined, and potential N-glycosylation sites are marked below the amino acids ( ).
).
FIGURE 3.

Genomic structure of rabbit NADase. A, nucleotide sequence of the rabbit NADase gene (GenBankTM accession number NW_003159229). The nucleotide sequence is shown as capital letters in exon and bp numbers in introns. B, genomic structures of rabbit ART1, ART1-like, and NADase. The exons are depicted as boxes with filled and open boxes representing translated regions and untranslated regions, respectively. Gray boxes represent GPI anchor sites. The numbers indicate chromosome 1 genomic nucleotide sequence position. The arrows indicate the direction from 5′-flanking region to 3′-flanking region.
Structural Characterization
To examine whether the NADase is glycosylated, we performed Western blot analysis of purified NADase treated with or without PNGase F. PNGase F-treated NADase showed a molecular weight of 33 kDa compared with 40 kDa for untreated NADase (Fig. 1E), indicating that the NADase is an N-glycosylated protein. Consistent with the findings that the NADase is modified by PNGase F-sensitive N-glycosylation (Fig. 1E) and that GPI-linked proteins are often heavily glycosylated (24, 25), three potential sites for N-linked glycosylation were found in the deduced amino acid sequence: Asn51, Asn211, and Asn233 (Fig. 2). The hydrophilicity plot showed hydrophobic N and C termini with a hydrophilic center (data not shown). The hydrophobic N-terminal region was reported to serve as a leader sequence, and the hydrophobic sequence near the C terminus was reported to serve as a recognition signal for GPI modification in the endoplasmic reticulum (26, 27). To determine localization of NADase on the plasma membrane, we performed immunocytochemical analysis in conjunction with confocal microscopy. GFP-NADase was exclusively localized on the plasma membrane in HEK293 cells (Fig. 4A). To confirm that NADase exists as a GPI-anchored form on the plasma membrane, HEK293 cells transfected with FLAG-NADase were incubated with bacterial PI-PLC. Western blot analysis and an NADase activity assay showed release of NADase into the medium by PI-PLC treatment (Fig. 4, B and C), indicating that the NADase is a GPI-anchored protein.
FIGURE 4.

NADase exists as a GPI-anchored species on the plasma membrane of HEK293 cells. A, confocal fluorescence images of HEK293 cells expressing GFP-NADase. NADase expression was detected by GFP fluorescence. DIC, differential interference contrast. B, FLAG-NADase-expressing HEK293 cells were treated with (+) or without (−) PI-PLC, and solubilized NADase was determined in the supernatant by Western blot analysis. C, FLAG-vector- or FLAG-NADase-expressing HEK293 cells were treated with (+) or without (−) PI-PLC, and NADase activity was measured in the supernatant. *, p < 0.001, non-PI-PLC-treated NADase versus 1 μg/ml PI-PLC-treated NADase. The means ± S.E. (error bars) of three independent experiments are shown.
Catalytic Glutamine of NADase Is a Crucial Residue for NADase Activity
A homology search of the deduced amino acid sequence of NADase was performed at the National Center for Biotechnology Information by using BLAST (databases, April 2013) (Table 3). The highest homology score was obtained for rabbit ART1 protein, which is expressed in skeletal and cardiac muscle (28). In comparison with ART1, the amino acid sequence in the vicinity of the catalytic glutamate residue was notably different in NADase (Fig. 5). Typical ART enzymes, including ART1, have an EEE motif, whereas NADase has 218QAE220, and ART enzymes possessing NADase activity contain a QEE motif. This finding suggests that the NADase may function as a NADase but not as an ART as it is enzymatically more similar to rat RT6 rather than to mouse Rt6 (13, 24, 25, 29). To test this hypothesis, we used site-directed mutagenesis with subsequent synthesis of recombinant NADase and ART1 proteins in HEK293 cells (Fig. 6A). A recombinant protein from the full-length NADase cDNA showed NADase activity with very low ART activity, whereas recombinant ART1 exhibited ART activity only (Fig. 6, B and C). Replacement of glutamine with glutamate at position 218 (Q218E) of the recombinant NADase resulted in a loss of NADase activity and an increase of ART activity, similar to the recombinant ART (Fig. 6, B and C). We also examined enzyme activity after replacing glutamine at position 218 with other amino acids. Replacement of glutamine with aspartate at position 218 (Q218D) resulted in a loss of NADase activity, similar to Q218E, but the ART activity was not significantly increased. Replacement of glutamine with alanine (Q218A) resulted in loss of both NADase and ART activities (Fig. 6, B and C). Taken together, these findings indicate that glutamine 218 is a crucial determinant of NADase and ART activities.
TABLE 3.
Amino acid sequence identity between NADase and ART family members
The extent of identity (colored boxes) and similarity (white boxes) was calculated with BLASTp and ClustalW. m, mouse; r, rat; h, human; rb, rabbit. The following references were used: Refs. 5, 25, 28, and 32–34.

FIGURE 5.

Alignment of ART deduced amino acid sequence (Clustal program) of NADase. Identical, strongly conserved, and weakly conserved amino acids are indicated by asterisks, colons, and dots, respectively, based on the methods of Higgins and Sharp (35) as utilized by the Clustal program. Dashes indicate gaps to maximize alignment. Nucleophilic arginine or histidine (R-H) and acidic amino acid regions, believed to be involved in the formation of the active site, are boxed (25). RbART1, rabbit skeletal muscle ART; mART1, mouse ART1; mART2a, mouse ART2a; mART2b, mouse ART2b; mRt6-1, mouse Rt6-1; mRt6-2, mouse Rt6-2; rART1, rat ART1; rART2a, rat ART2a; rART2b, rat ART2b; rRt6-1, rat Rt6-1; rRt6-2, rat Rt6-2.
FIGURE 6.

NADase and ART activities of wild-type and mutant NADases and ART1. HEK293 cells transfected with plasmids (vector, NADase, NADase Q218E, NADase Q218A, NADase Q218D, and ART1) were lysed and assayed for NADase and ART activities. Activity was determined as described under “Experimental Procedure.” A, Western blot analysis of proteins from cells overexpressing NADase and mutant NADases. Western blot analysis was performed using anti-FLAG antibody for comparison of NADase expression levels among HEK293 cells transfected with NADase and mutant NADase genes. B, NADase activity of HEK293 cells transfected with indicated plasmids. *, p < 0.001, vector versus NADase; **, p < 0.001, NADase versus mutant NADases or ART. C, ART activity of HEK293 cells transfected with indicated plasmids. #, p < 0.001, vector or NADase versus ART1 or NADase Q218E; ##, p < 0.001, ART1 versus NADase Q218A or NADase Q218D. The means ± S.E. (error bars) of three independent experiments are shown.
NADase Is Involved in Erythropoiesis in Bone Marrow Cells
Because NADase is exclusively expressed in erythrocytes, we speculated that NADase may play a role in erythroid differentiation of bone marrow cells. We quantified colony formation (CFU-E and BFU-E). For lentivirus transduction, we first prestimulated bone marrow cells with stem cell factor, thrombopoietin, and Flt3 ligand and then infected them with scrambled or NADase shRNA-expressing lentivirus. NADase was significantly reduced in bone marrow cells treated with NADase shRNAs compared with those treated with scrambled shRNA (Fig. 7A). CFU-E formation was significantly reduced in NADase knockdown cells compared with those with scrambled shRNA lentivirus (Fig. 7, B and C), suggesting that NADase is involved in erythropoiesis of bone marrow cells. Mature BFU-E formation was not observed in bone marrow cells treated with NADase shRNAs probably due to the effect of puromycin in the process of selection (Fig. 7C).
FIGURE 7.

Role of rabbit NADase in erythroid differentiation of bone marrow cells. Rabbit (Rb) bone marrow cells were infected with scrambled or NADase shRNA-expressing lentivirus and selected with puromycin. A, Western blot analysis of NADase in lentivirus-infected bone marrow cells (scrambled or NADase shRNAs). B, in vitro methylcellulose colony formation of CFU-E and BFU-E. Methylcellulose cultures for erythroid colonies of bone marrow cells were infected with scrambled or NADase shRNA-expressing lentivirus for 10 days. Colonies were examined under a Zeiss microscope (Axiovert 40 CFL, Carl Zeiss). C, CFU-E and mature BFU-E were scored in scrambled or NADase shRNA-expressing lentivirus-infected bone marrow cells for 10 days. Mean values of three independent experiments ±S.D. (error bars) are shown. ND, not detected. *, p < 0.005, scrambled shRNA CFU-E versus NADase shRNA CFU-E. D, intracellular NAD concentration in scrambled shRNA- or NADase shRNA-expressing lentivirus-infected bone marrow cells. $, p < 0.005, scrambled shRNA versus NADase shRNAs. E, intracellular ADPR concentration in scrambled shRNA- or NADase shRNA-expressing lentivirus-infected bone marrow cells. #, p < 0.01, scrambled shRNA versus NADase shRNAs.
To investigate further the mechanism by which NADase affects erythropoiesis and a possible role of the metabolites generated by the NADase, we examined concentrations of substrate, NAD, and a product, ADP-ribose, in control cells or cells in which the NADase had been suppressed. Bone marrow cells with NADase reduced by shRNA treatment showed a significant increase in NAD content and a decrease in ADPR content compared with control cells (Fig. 7, D and E). We reasoned that an increased NAD level might affect erythropoiesis of bone marrow cells. Therefore, we examined whether erythropoiesis is affected in the bone marrow cells with increased NAD level by supplementation with an NAD precursor, nicotinamide riboside (NR) (30, 31). NR-treated cells showed a significant decrease in CFU-E formation and BFU-E formation (Fig. 8A). The NR-treated cells showed an increase in intracellular NAD but not in ADPR level compared with control cells (Fig. 8, B and C). These results indicate that the NAD level affects erythropoiesis of bone marrow cells. To further corroborate these findings, we examined the effects of extracellular NAD, ADPR, and nicotinamide on erythropoiesis of bone marrow cells. Treatment of bone marrow cells with NAD or nicotinamide, which resulted in an increase in intracellular NAD level, significantly decreased CFU-E and BFU-E formation, whereas ADPR-treated cells showed no difference from control vehicle-treated cells (Fig. 9). These results confirm that the NAD level regulates erythropoiesis of bone marrow cells. A previous report on hematopoietic progenitor cell content of mouse bone marrow cells showed that CFU-E formation and mature BFU-E formation of CD34+/CD38− cells were significantly decreased compared with those of CD34+/CD38+ cells (8), suggesting that another NADase family, CD38, also plays a role in erythropoiesis. Given that CD38 is also an NAD-degrading enzyme, the expression of the enzyme in bone marrow cells may regulate erythropoiesis in hematopoietic stem cells by modulating the NAD level, similar to the rabbit NADase. Therefore, to confirm whether a decrease in erythropoiesis in the bone marrow cells from CD38-deficient mice was due to an increase in NAD level, we examined erythropoiesis and NAD levels of bone marrow cells prepared from CD38 wild-type (WT) and knock-out (KO) mice. As expected, bone marrow cells from CD38 KO mice showed a significant increase in NAD level and a decrease in erythropoiesis compared with those of CD38 WT mice (Fig. 10). These findings further support the hypothesis that the NAD level affects erythropoiesis in hematopoietic stem cells.
FIGURE 8.

Effect of NR on erythroid differentiation of bone marrow cells. A, rabbit bone marrow cells were treated with 0.5 mm NR. CFU-E formation and mature BFU-E formation were scored at day 10 of culture with NR. Mean values of three independent experiments ±S.D. (error bars) are shown. *, p < 0.01, vehicle (Veh) versus NR. B, rabbit bone marrow cells were treated with 0.5 mm NR for 24 h, and intracellular NAD concentration was measured. $, p < 0.05, vehicle versus NR. C, intracellular ADPR concentration in NR-treated bone marrow cells.
FIGURE 9.

Effect of NAD, ADP-ribose, and nicotinamide on erythroid differentiation of bone marrow cells. A, rabbit bone marrow cells were treated with 200 μm NAD, ADP-ribose, or nicotinamide, and CFU-E formation and mature BFU-E formation were scored at day 10 of culture with NAD, ADP-ribose, or nicotinamide. Mean values of three independent experiments ±S.D. (error bars) are shown. *, p < 0.05, vehicle (Veh) versus NAD or nicotinamide. B, intracellular NAD concentration in rabbit bone marrow cells treated with NAD, ADP-ribose, or nicotinamide. **, p < 0.0005, vehicle versus NAD or nicotinamide.
FIGURE 10.
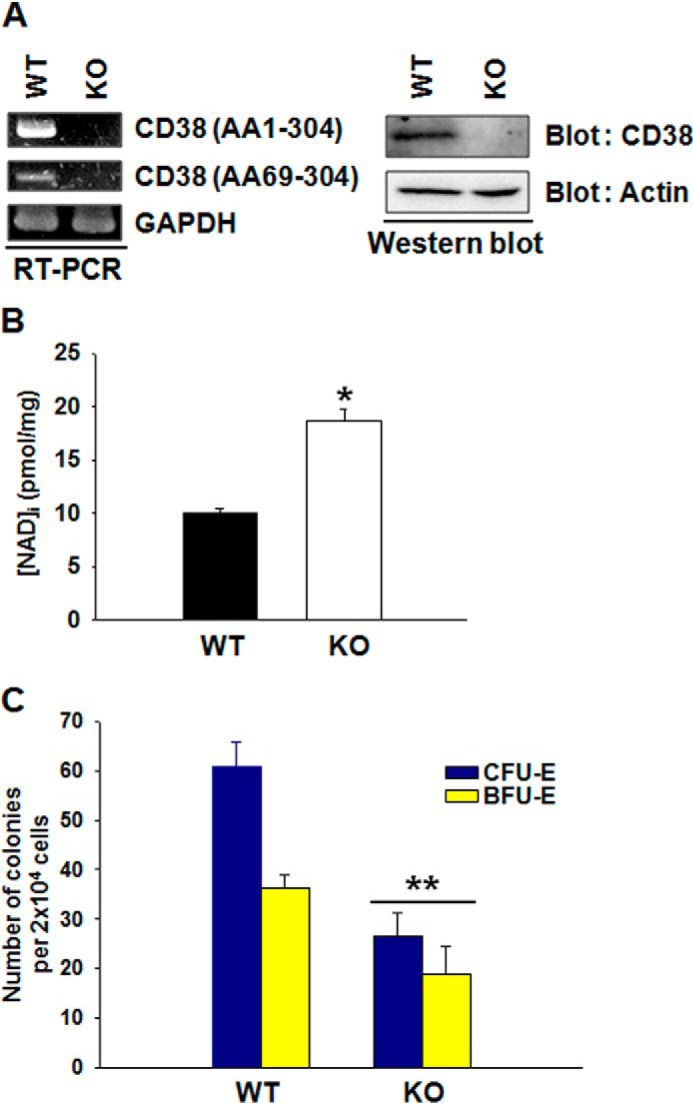
Erythroid differentiation of bone marrow cells prepared from CD38 WT or KO mice. A, RT-PCR and Western blot analysis of CD38 in bone marrow cells from CD38 WT or KO mice. B, intracellular NAD concentration in CD38 WT or KO mouse bone marrow cells. *, p < 0.0005, WT versus KO. C, CFU-E formation and mature BFU-E formation were scored at day 10. Mean values of three independent experiments ±S.D. (error bars) are shown. *, p < 0.001, WT versus KO.
In conclusion, we have cloned and characterized a novel NADase specifically expressed in rabbit reticulocytes. This novel NADase showed only NADase activity but not ART activity. Although homologs of this enzyme were not found in other species, this enzyme shows unique characteristics in enzymatic function as well as in exclusive expression in erythrocytes, consistent with its role in regulating erythropoiesis.
This work was supported, in whole or in part, by the National Institutes of Health Intramural Research Program, NHLBI (to J. M.). This work was also supported by National Research Foundation Grant 2012R1A3A2026453 funded by the Korean government (to U.-H. K.) and the Chonbuk National University for the International Collaborative Research (2009) (to U.-H. K.).
The nucleotide sequence(s) reported in this paper has been submitted to the GenBankTM/EBI Data Bank with accession number(s) JN798515.
- NADase
- NAD glycohydrolase
- GPI
- glycosylphosphatidylinositol
- ART
- ADP-ribosyltransferase
- ADPR
- ADP-ribose
- PI-PLC
- phosphatidylinositol-specific phospholipase C
- BFU-E
- burst-forming unit-erythroid
- CFU-E
- colony-forming unit-erythroid
- ϵ-NAD+
- 1,N6-ethenoadenine dinucleotide
- RACE
- rapid amplification of cDNA ends
- PNGase F
- peptide-N-glycosidase F
- SSC
- saline-sodium citrate
- NR
- nicotinamide riboside.
REFERENCES
- 1. Cho Y.-S., Han M.-K., Kwark O.-S., Phoe M. S., Cha Y.-S., An N.-H., Kim U.-H. (1998) Auto-ADP-ribosylation of NAD glycohydrolase from Neurospora crassa. Comp. Biochem. Physiol. B Biochem. Mol. Biol. 120, 175–181 [DOI] [PubMed] [Google Scholar]
- 2. Ghosh J., Anderson P. J., Chandrasekaran S., Caparon M. G. (2010) Characterization of Streptococcus pyogenes β-NAD+ Glycohydrolase. J. Biol. Chem. 285, 5683–5694 [DOI] [PMC free article] [PubMed] [Google Scholar]
- 3. Kim U.-H., Kim M.-K., Kim J.-S., Han M.-K., Park B.-H., Kim H.-R. (1993) Purification and characterization of NAD glycohydrolase from rabbit erythrocytes. Arch. Biochem. Biophys. 305, 147–152 [DOI] [PubMed] [Google Scholar]
- 4. Kim U.-H., Rockwood S. F., Kim H. R., Daynes R. A. (1988) Membrane-associated NAD+ glycohydrolase from rabbit erythrocytes is solubilized by phosphatidylinositol-specific phospholipase C. Biochim. Biophys. Acta 965, 76–81 [DOI] [PubMed] [Google Scholar]
- 5. Okazaki I. J., Kim H.-J., McElvaney N. G., Lesma E., Moss J. (1996) Molecular Characterization of a glycosylphosphatidylinositol-linked ADP-ribosyltransferase from lymphocytes. Blood 88, 915–921 [PubMed] [Google Scholar]
- 6. Zocchi E., Franco L., Guida L., Benatti U., Bargellesi A., Malavasi F., Lee H. C., De Flora A. (1993) A single protein immunologically identified as CD38 displays NAD+ glycohydrolase, ADP-ribosyl cyclase and cyclic ADP-ribose hydrolase activities at the outer surface of human erythrocytes. Biochem. Biophys. Res. Commun. 196, 1459–1465 [DOI] [PubMed] [Google Scholar]
- 7. Aksoy P., White T. A., Thompson M., Chini E. N. (2006) Regulation of intracellular levels of NAD: a novel role for CD38. Biochem. Biophys. Res. Commun. 345, 1386–1392 [DOI] [PubMed] [Google Scholar]
- 8. Issaad C., Croisille L., Katz A., Vainchenker W., Coulombel L. (1993) A murine stromal cell line allows the proliferation of very primitive human CD34++/CD38− progenitor cells in long-term cultures and semisolid assays. Blood 81, 2916–2924 [PubMed] [Google Scholar]
- 9. Elliott S., Pham E., Macdougall I. C. (2008) Erythropoietins: a common mechanism of action. Exp. Hematol. 36, 1573–1584 [DOI] [PubMed] [Google Scholar]
- 10. Hattangadi S. M., Wong P., Zhang L., Flygare J., Lodish H. F. (2011) From stem cell to red cell: regulation of erythropoiesis at multiple levels by multiple proteins, RNAs, and chromatin modifications. Blood 118, 6258–6268 [DOI] [PMC free article] [PubMed] [Google Scholar]
- 11. Xie G.-H., Rah S.-Y., Kim S.-J., Nam T.-S., Ha K.-C., Chae S.-W., Im M.-J., Kim U.-H. (2005) ADP-ribosyl cyclase couples to cyclic AMP signaling in the cardiomyocytes. Biochem. Biophys. Res. Commun. 330, 1290–1298 [DOI] [PubMed] [Google Scholar]
- 12. Maehama T., Hoshino S., Katada T. (1996) Increase in ADP-ribosyltransferase activity of rat T lymphocyte alloantigen RT6.1 by a single amino acid mutation. FEBS Lett. 388, 189–191 [DOI] [PubMed] [Google Scholar]
- 13. Hara N., Tsuchiya M., Shimoyama M. (1996) Glutamic acid 207 in rodent T-cell RT6 antigens is essential for arginine-specific ADP-ribosylation. J. Biol. Chem. 271, 29552–29555 [DOI] [PubMed] [Google Scholar]
- 14. Kunkel T. A., Roberts J. D., Zakour R. A. (1987) Rapid and efficient site-specific mutagenesis without phenotypic selection. Methods Enzymol. 154, 367–382 [DOI] [PubMed] [Google Scholar]
- 15. Ziegler M., Jorcke D., Zhang J., Schneider R., Klocker H., Auer B., Schweiger M. (1996) Characterization of detergent-solubilized beef liver mitochondrial NAD+ glycohydrolase and its truncated hydrosoluble form. Biochemistry 35, 5207–5212 [DOI] [PubMed] [Google Scholar]
- 16. Graeff R. M., Walseth T. F., Fryxell K., Branton W. D., Lee H. C. (1994) Enzymatic synthesis and characterizations of cyclic GDP-ribose. A procedure for distinguishing enzymes with ADP-ribosyl cyclase activity. J. Biol. Chem. 269, 30260–30267 [PubMed] [Google Scholar]
- 17. Moss J., Stanley S. J. (1981) Histone-dependent and histone-independent forms of an ADP-ribosyltransferase from human and turkey erythrocytes. Proc. Natl. Acad. Sci. U.S.A. 78, 4809–4812 [DOI] [PMC free article] [PubMed] [Google Scholar]
- 18. Weng B., Thompson W. C., Kim H.-J., Levine R. L., Moss J. (1999) Modification of the ADP-ribosyltransferase and NAD glycohydrolase activities of a mammalian transferase (ADP-ribosyltransferase 5) by auto-ADP-ribosylation. J. Biol. Chem. 274, 31797–31803 [DOI] [PubMed] [Google Scholar]
- 19. Han M.-K., Song E.-K., Guo Y., Ou X., Mantel C., Broxmeyer H. E. (2008) SIRT1 regulates apoptosis and Nanog expression in mouse embryonic stem cells by controlling p53 subcellular localization. Cell Stem Cell 2, 241–251 [DOI] [PMC free article] [PubMed] [Google Scholar]
- 20. Lutton J. D., Abraham N. G., Drummond G. S., Levere R. D., Kappas A. (1997) Zinc porphyrins: potent inhibitors of hematopoieses in animal and human bone marrow. Proc. Natl. Acad. Sci. U.S.A. 94, 1432–1436 [DOI] [PMC free article] [PubMed] [Google Scholar]
- 21. Aslesen R., Jensen J. (1998) Effects of epinephrine on glucose metabolism in contracting rat skeletal muscles. Am. J. Physiol. 275, E448–E456 [DOI] [PubMed] [Google Scholar]
- 22. Graeff R., Lee H. C. (2002) A novel cycling assay for nicotinic acid-adenine dinucleotide phosphate with nanomolar sensitivity. Biochem. J. 367, 163–168 [DOI] [PMC free article] [PubMed] [Google Scholar]
- 23. Tong L., Lee S., Denu J. M. (2009) Hydrolase regulates NAD+ metabolites and modulates cellular redox. J. Biol. Chem. 284, 11256–11266 [DOI] [PMC free article] [PubMed] [Google Scholar]
- 24. Takada T., Iida K., Moss J. (1994) Expression of NAD glycohydrolase activity by rat mammary adenocarcinoma cells transformed with rat T cell alloantigen RT6.2. J. Biol. Chem. 269, 9420–9423 [PubMed] [Google Scholar]
- 25. Okazaki I. J., Kim H.-J., Moss J. (1996) Cloning and characterization of a novel membrane-associated lymphocyte NAD:arginine ADP-ribosyltransferase. J. Biol. Chem. 271, 22052–22057 [DOI] [PubMed] [Google Scholar]
- 26. Ferguson M. A. (1992) Colworth Medal Lecture. Glycosyl-phosphatidylinositol membrane anchors: the tale of a tail. Biochem. Soc. Trans. 20, 243–256 [DOI] [PubMed] [Google Scholar]
- 27. Udenfriend S., Kodukula K., Amthauer R. (1992) Cell-free processing of nascent proteins destined to be linked to the plasma membrane by a phosphatidylinositol-glycan anchor. Cell. Mol. Biol. 38, 11–16 [PubMed] [Google Scholar]
- 28. Zolkiewska A., Nightingale M. S., Moss J. (1992) Molecular characterization of NAD:arginine ADP-ribosyltransferase from rabbit skeletal muscle. Proc. Natl. Acad. Sci. U.S.A. 89, 11352–11356 [DOI] [PMC free article] [PubMed] [Google Scholar]
- 29. Bortell R., Kanaitsuka T., Stevens L. A., Moss J., Mordes J. P., Rossini A. A., Greiner D. L. (1999) The RT6 (Art2) family of ADP-ribosyltransferases in rat and mouse. Mol. Cell. Biochem. 193, 61–68 [PubMed] [Google Scholar]
- 30. Bieganowski P., Brenner C. (2004) Discoveries of nicotinamide riboside as a nutrient and conserved NRK genes establish a Preiss-Handler independent route to NAD+ in fungi and humans. Cell 117, 495–502 [DOI] [PubMed] [Google Scholar]
- 31. Cantó C., Houtkooper R. H., Pirinen E., Youn D. Y., Oosterveer M. H., Cen Y., Fernandez-Marcos P. J., Yamamoto H., Andreux P. A., Cettour-Rose P., Gademann K., Rinsch C., Schoonjans K., Sauve A. A., Auwerx J. (2012) The NAD+ precursor nicotinamide riboside enhances oxidative metabolism and protects against high-fat diet-induced obesity. Cell. Metab. 15, 838–847 [DOI] [PMC free article] [PubMed] [Google Scholar]
- 32. Okazaki I. J., Zolkiewska A., Nightingale M. S., Moss J. (1994) Immunological and structural conservation of mammalian skeletal muscle glycosylphosphatidylinositol-linked ADP-ribosyltransferases. Biochemistry. 33, 12828–12836 [DOI] [PubMed] [Google Scholar]
- 33. Okazaki I. J., Moss J. (1998) Glycosylphosphatidylinositol-anchored and secretory isoforms of mono-ADP-ribosyltransferases. J. Biol. Chem. 273, 23617–23620 [DOI] [PubMed] [Google Scholar]
- 34. Glowacki G., Braren R., Firner K., Nissen M., Kühl M., Reche P., Bazan F., Cetkovic-Cvrlje M., Leiter E., Haag F., Koch-Nolte F. (2002) The family of toxin-related ecto-ADP-ribosyltransferases in humans and the mouse. Protein Sci. 11, 1657–1670 [DOI] [PMC free article] [PubMed] [Google Scholar]
- 35. Higgins D. G., Sharp P. M. (1988) CLUSTAL: a package for performing multiple sequence alignment on a microcomputer. Gene 73, 237–244 [DOI] [PubMed] [Google Scholar]