

Abstract
Background:
Pyeongwee-San (PWS) has been widely used for treating acute gastritis, chronic, and gastritis.
Objective:
In this paper, simultaneous determination of five compounds (naringin, hesperidin, glycyrrhizin, atractylenolide III, and magnolol) from traditional medicine PWS using the high performance liquid chromatography (HPLC) was established for quality control.
Materials and Methods:
Optimum separations were obtained with a SHISEIDO C18 reverse-phase column by gradient elution with 0.1% Trifluoroacetic acid (TFA) water-acetonitrile as the mobile phase. The flow rate was 1 mL/min and detection wavelength was set at 205 nm and 250 nm. Validation of the analytical method was evaluated by linearity, precision, and accuracy test.
Results:
The calibration curves were linear over the established range with R2 > 0.9978. The limit of detection (LOD) and limit of quantification (LOQ) ranged from 0.09 to 0.43 and 0.27 to 1.29 μg/mL. The method exhibited intra-day and inter-day precision range between 0.01-1.86% and 0.04-0.35% respectively. The recoveries of five compounds in PWS were in the range between 93.18-106.40%, and 0.20-1.51%. The application of this method was identified through the successful analysis of five compounds in 12 batches of PWS. In addition, identification of five compounds was confirmed by a liquid chromatography method and mass spectrometry.
Conclusion:
The HPLC method was could be accomplished to the quality control and stable experiment for the preparations consisted of five major compounds.
Keywords: High performance liquid chromatography-diode array detection, liquid chromatography-mass spectrometry/mass spectrometry, Pyeongwee-San, quality control, validation
INTRODUCTION
Traditional herbal medicine was formed 2000 years ago, and developed in the following centuries. Traditional herbal medicine focuses on health-care and in the therapy of disease emphasizes on enhancing the body's resistance to diseases. These medicines have played a key role in clinical treatment and have been attracting more and more attention for their complementary therapeutic effects to Western medicines with low toxicity and few or even no complication.[1,2,3] Herbal medicine is still the mainstay of about 75-80% of the world population, mainly in the developing countries.[4] With the increasing use of herbal medicines, quality control is required to guarantee their safety and effectiveness. Therefore, the development of reliable methods to evaluate and control the quality of traditional herbal medicines is important. In general, the methods for quality control of herbal medicines involve analytical inspection using the instrumental techniques such as gas chromatography (GC), high performance liquid chromatography (HPLC). GC-mass spectrometry (GC-MS) and liquid chromatography-MS (LC-MS), etc.[5,6,7,8] Especially, HPLC is a popular method for the analysis of herbal medicines because it is simple and reliable. Thus, over the past decades, HPLC has received the most extensive application in the analysis of herbal medicines.
The traditional herbal prescription, Pyeongwee-San (PWS) has been widely used in Korea and Japan. PWS was consisted of four herbs (Citri Pericarpium, Glycyrrhizae Radix, Atractylodis Rhizoma and Magnoliae Cortex). PWS was originally recorded that used for treating acute gastritis, chronic gastritis, indigestion, asthma, and anemia in the traditional Korean herbal text Donguibogam. In recently years, PWS has been used for the remedy of atopic dermatitis in the clinical care. In addition, PWS has been shown to provide biological benefits, such as protecting from gastrointestinal mucosal damage and possessing an anti-oxidative activity.[9,10,11] In this study, we develop and validate an HPLC with diode array detection (HPLC-DAD) method and MS (LC-MS/MS) for quantitative determination of five compounds in PWS: (1) Naringin, (2) hesperidin, (3) glycyrrhizin, (4) atractylenolide III, (5) magnolol. These compounds were selected as major compound of consisted herbs: Naringin and hesperidin from C. Pericarpium, glycyrrhizin from G. Radix, atractylenolide from A. Rhizoma, and magnolol from M. Cortex. The structures of these five compounds were given in Figure 1. This study represents the accurate and simple investigation of simultaneous analysis and identification of these compounds in PWS using HPLC-DAD and LC-MS/MS. The method also provided the reference for the clinical medication and the nutrition application.
Figure 1.
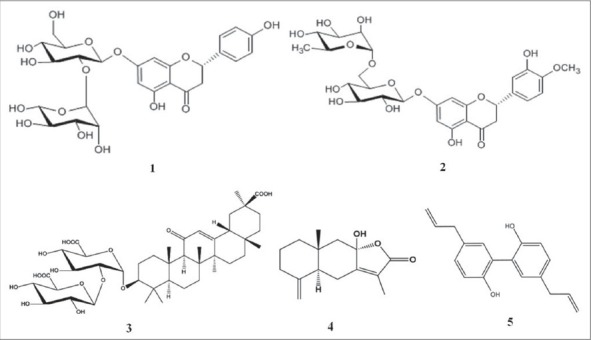
Chemical structures of 5 constituents in Pyeongwee-san. 1: Naringin, 2: Hesperidin, 3: Glycyrrhizin, 4: Atractylenolide III, 5: Magnolol
MATERIALS AND METHODS
Chemicals and reagent
Naringin, hesperidin, glycyrrhizin, atractylenolide III, and magnolol were provided by Korea Food and Drug Administration. The purities of these compounds were determined to be higher than 98% by HPLC and stored at 4C. HPLC grade acetonitrile, methanol and water were purchased from J. K. Baker (USA). Trifluoroacetic acid (TFA) was purchased from DAE JUNG (Korea). PWS samples were provided by Korea Institute of Oriental Medicine.
Instrumentation and chromatographic system
The HPLC system (Dionex Ultimate 3000, Germany) consisted of a model series 3 × 00 pump, ACC-3000 auto sampler, TCC-3000 SD column oven, and DAD-3000 (RS) diode array ultraviolet-visible spectrophotometry (UV/VIS) detector. Data analyzes and system control were performed using the ChromelonTM. The column configuration was a SHISEIDO C18 column (5 μm, 4.6 I.D., 250 mm) and kept at constant temperature 35°C. The sample injection volume was 20 μL. The mobile phase was a mixture of solvent water containing 0.1% TFA (A) and acetonitrile (B) employing gradient elution at a flow rate of 1 mL/min. The gradient profile of the mobile phase was as follows: 0-10 min, 80% A; 10-40 min, 80-20% A. The detection wavelengths of each standard were set at 205 nm for naringin, hesperidin, atractylenolide III and magnolol, and at 254 nm for glycyrrhizin.
Preparation of standard solutions
The standard stock solutions of naringin (330 μg/mL), hesperidin (360 μg/mL), glycyrrhizin (530 μg/mL), atractlenolide III (325 μg/mL) and magnolol (520 μg/mL) were separately prepared in methanol and diluted to appropriate concentration range for the establishment of calibration curves. The methanolic solution was filtered through a 0.45 μm filter and all the solutions were stored at 4°C until use.
Preparation of sample solutions
According to Donguibogam, PWS consists of 5.25 g of C. Pericarpium, 2.25 g of G. Radix, 7.5 g of A. Rhizoma and 3.75 g of M. Cortex. The dried PWS powder sample (112.7 mg) was accurately weighed and extracted with 10 mL 60% methanol in ultrasonification bath. The sample solution was filtered through 0.45 μm filter before injecting into HPLC system. All the solutions were stored in the refrigerator at 4°C.
LC-MS/MS conditions
The LC-MS/MS analysis was performed with a TSQ Quantum Ultra (Thermo) system.
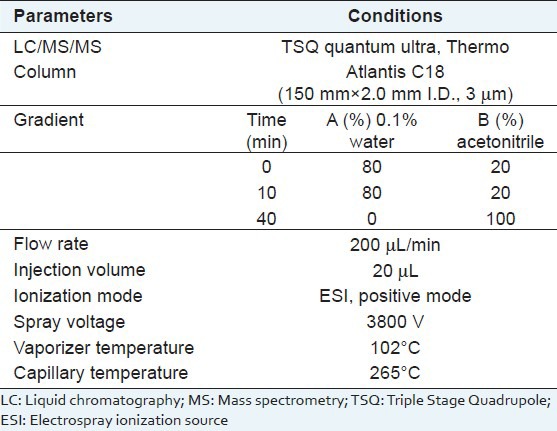
Five compounds were separated by using an Atlantis C18 (150 × 2.0 mm I.D., 3 μm). The injection volume and column flow rate were 20 μL and 200 μL/min, respectively. The mobile phase consisted of water containing 0.1% TFA (A) and acetonitrile (B). Mass spectrometer was equipped with an electrospray ionization source (ESI) interface. Positive ion ESI was performed using a spray voltage of 3800 V. The capillary temperature was set to 265°C, and the vaporizer temperature was kept at 102°C. The performed LC-MS/MS conditions were described in Table 1.
Table 1.
Parameters of analysis condition for LC/MS/MS
Analytical method validation
Full validation of the analytical method evaluated in this study was according to the ICH (International Conference on Harmonization) guideline for validation of bio analytical methods. All validation was showed for determination of analysis sample in this study. Linearity, limit of detection (LOD), limit of quantification (LOQ), precision, and recovery were evaluated for the method.[12,13,14,15]
Stock solutions containing five standards at six different concentrations were injected. The calibration curves were plotted based in linear regression analysis of the integrated peak area (y) versus concentrations (x). The regression equations were calculated in the form of y = ax + b. The mixed standards solution was further diluted to accurate concentration to explore the LOD and LOQ. LOD and LOQ were described as the concentration of analyte capable of producing a peak with a signal-to-noise ratio of 3 and 10, respectively. The intra-day and inter-day precisions were determined by continuously injection the sample solution for replicated on the same day and on three consecutive days. A recovery test was used to evaluate the accuracy of the developed method. Three different quantities of the accurate standards were spiked into the samples in form of solution. The quantity of each analyte was subsequently accomplished from the corresponding calibration curve: Recovery (%) = (found concentration – original concentration)/spiked concentration × 100%, and relative standard deviation (RSD) (%) = (SD/mean) ×100%.
Sample analysis
The developed method was applied to analyze the contents of five compound, naringin, hesperidin, glycyrrhizin, atractylenolide III and magnolol in the 12 PWSs. Contents for all compounds were calculated from its corresponding calibration curve.
RESULTS AND DISCUSSION
Optimization of chromatographic conditions
The optimization of chromatographic separation condition was guided by the requirement of obtaining chromatograms with better resolution of adjacent peaks. The chromatographic conditions of the analysis were optimized by systematically adjusting the acetonitrile in the mobile phase through the addition of TFA to acquire better resolution of the compounds in PWS. To obtain the chromatograms with the good separation, mobile phase, column temperature, flow rate, and detection wavelength were carefully investigated. A simple gradient system was used to achieve better resolution of the analytes. This provided successful separation of all analytes within 40 min [Figure 2]. Detection wavelengths were selected at 205 and 250 nm according to maximum absorptions of quantified ingredients in the UV spectra obtained with a diode array detector coupled to the HPLC system. Naringin, hesperidin, atractylenolide III and magnolol were detected at 205 nm and glycyrrhizin was detected at 250 nm, respectively. Finally, a gradient elution system was chosen so as to ensure that each run was completed within 40 min. The optimal mobile phase gradient system was described.
Figure 2.
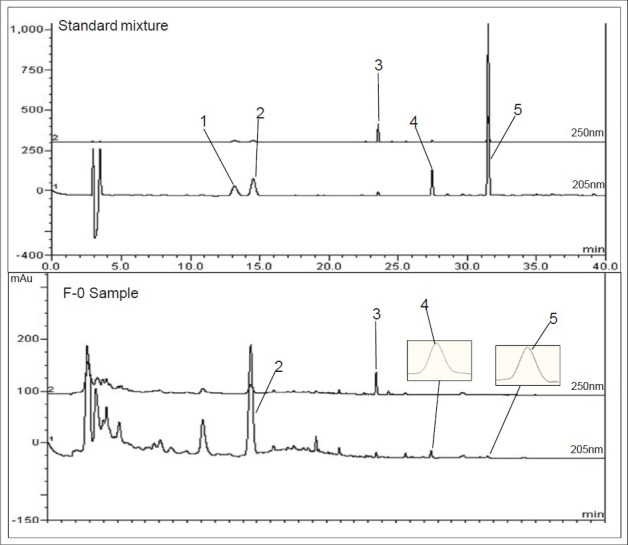
The high performance liquid chromatography-diode array detection chromatogram of standard mixtures and Pyeongwee-san sample. 1: Naringin, 2: Hesperidin, 3: Glycyrrhizin, 4: Atractylenolide III, 5: Magnolol
LC-MS/MS analysis
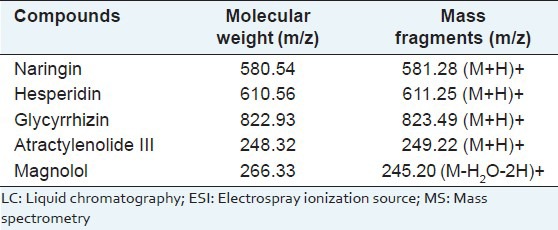
Mass spectrometer condition was optimized with respect to sensitivity, peak shape, and sample running time. All major compounds (naringin, hesperidin, glycyrrhizin, atractylenolide III and magnolol) of PWS were detected with greater sensitivity in the positive ion mode [Figure 3]. For naringin, the peak of m/z 581.28, for hesperidin the peak of m/z 611.25, for glycyrrhizin the peak of m/z 823.49 and for atractylenolide III the peak of m/z 249.22 were derived from add of pseudo-molecular ion [M + H] +. For magnolol the peak of m/z 245.20 was derived from loss of a [H2O-2H] + mass unit from pseudo-molecular ion magnolol [M-H2O-2H] +. The detailed mass spectrometer data are shown in Table 2.
Figure 3.
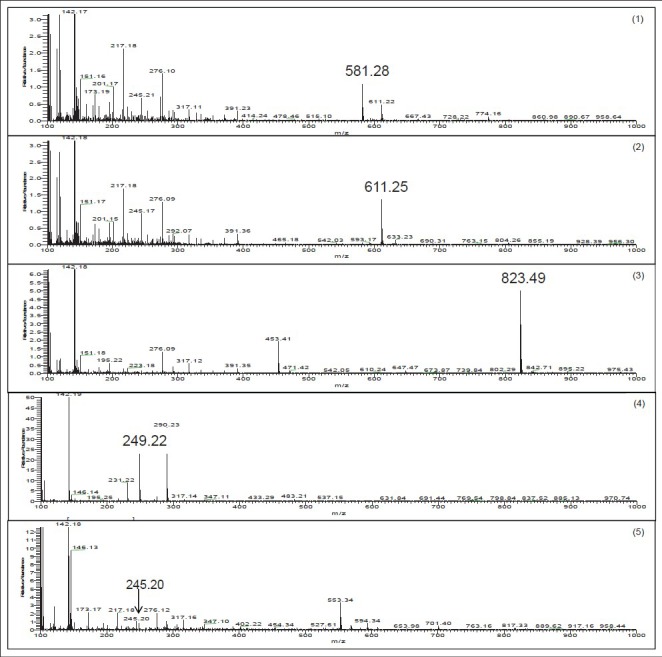
Liquid chromatography-mass spectrometry/mass spectrometry analysis of standard mixtures. 1: Naringin, 2: Hesperidin, 3: Glycyrrhizin, 4: Atractylenolide III, 5: Magnolol
Table 2.
Identification of the eleven compounds by LC/ESI-MS/MS
Linearity, LOD, and LOQ
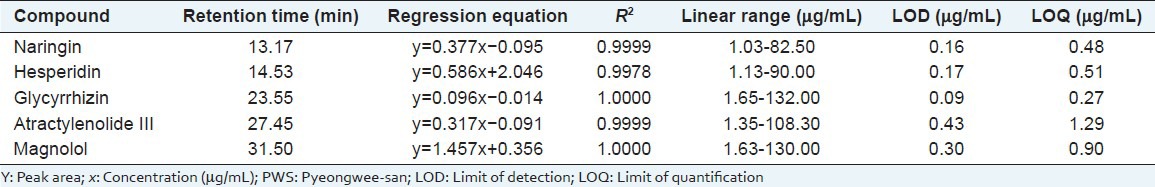
The calibration curve was composed with six appropriate concentrations in triplicate, and then constructed by plotting the peak area versus the concentration of each compounds. The parameters from the linear calibration curve with the retention time, regression equation, R2, linear range, LOD and LOQ of the five compounds are described in Table 3. In the regression equation from five compounds by detection, y = ax + b, x is referred to the concentration of the standard compounds (μg/mL), y to the peak area, a is intercept of the straight line with y axis and b is the slope of the line. The R is referred to the correlation coefficient of the equation.[16] As a result, all the standard compounds exhibited a good linearity (R2 > 0.9978) in the relatively wide concentration range. The LOD and LOQ of each compound were in the ranges 0.09-0.43 and 0.27-1.29 μg/mL, respectively.
Table 3.
Analytical results of calibration curves, LOD and LOQ of the five major compounds in PWS
Precision
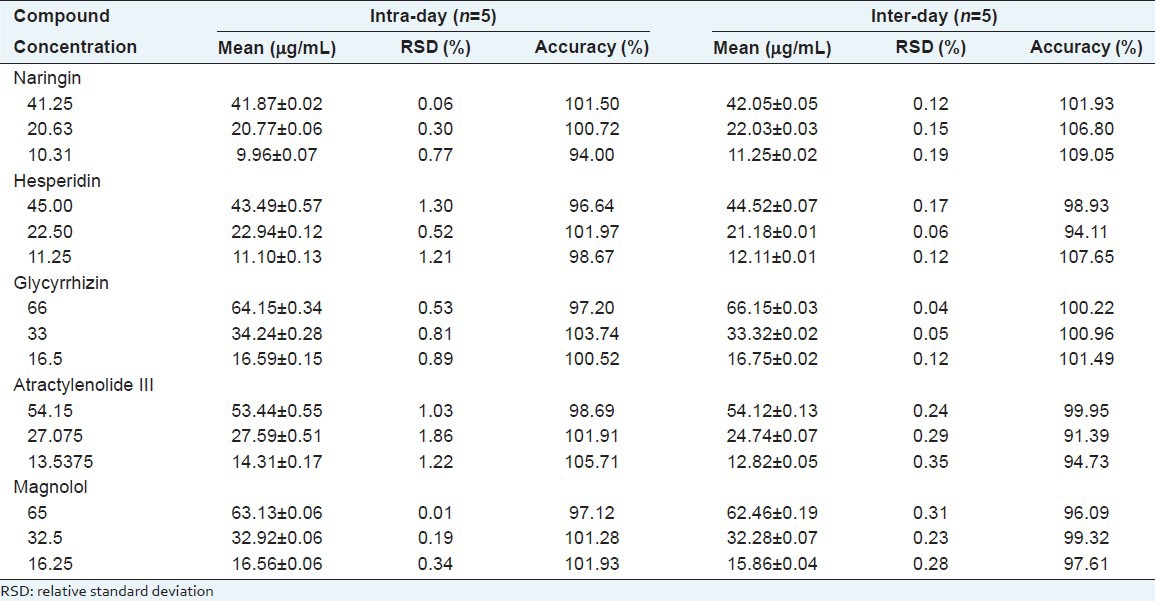
The precision was validated by determining intra-day and inter-day precision. For intra-day test, the calibration sample solutions were analyzed for five replicates within 1 day while for inter-day variability tests, the solvents were evaluated in duplicates for three sequential days. The relative standard deviations of the intra-day were in the ranges 0.06-0.77% for naringin, 0.52-1.30% for hesperidin, 0.53-0.89% for glycyrrhizin, 1.03-1.86% for atractylenolide III and 0.01-0.34% for the magnolol. The relative standard deviations of the inter-day were in the ranges 0.12-0.19% for naringin, 0.06-0.17% for hesperidin, 0.04-0.12% for glycyrrhizin, 0.24-0.35% for atractylenolide III and 0.23-0.31% for magnolol, respectively, indicating that the method described was precise enough for the quantitative evaluation of the compounds in PWS. The accuracy for precision was in the ranges 91.39-109.05%, respectively [Table 4]. The precision demonstrated that the developed HPLC method was sufficiently reliable and accurate for the measurement of the compounds analyzed.
Table 4.
Analytical results of intra-and inter-day variability
Recovery
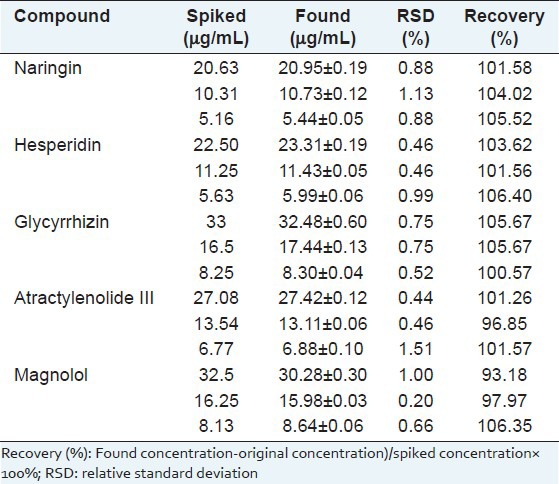
For examine, the accuracy of the developed method, the recovery test was carried as following: Three different quantities of the authentic standards were spiked into the samples in the form of solution. The recovery of each compound was in the rage 101.58-105.52% for naringin, 101.56-106.40% for hesperidin, 100.57-105.67% for glycyrrhizin, 96.85-101.57% for atractylenolide III and 93.18-106.35% for magnolol. The result showed that RSD of recovery test was in the range of 0.20-1.51% [Table 5]. These data demonstrated that the established HPLC approach was accurate enough for simultaneously quantitative determination of five compounds in PWS.
Table 5.
Accuracy for the test of compound (n=3)
Sample analysis
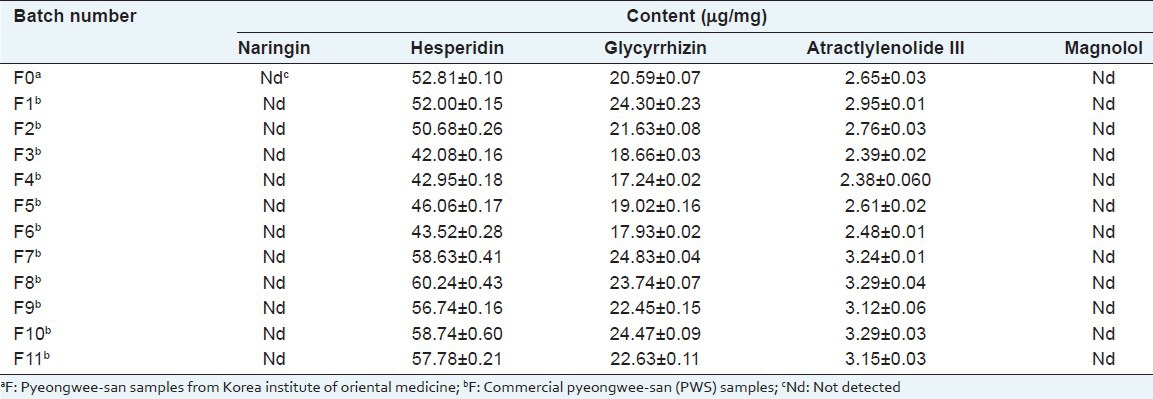
The established HPLC-DAD method analytical approach was successfully applied to the simultaneous determination the major compounds in 12 batches of commercial PWS. Each peak of chromatograms was identified by comparing the peak area and UV spectra with those of the standards. The content of each major five compounds from different commercial PWS are described in Table 6. There was a little difference in the contents of each compound in commercial PWS sample. Among them, hesperidin detected the highest amount of 42.95-60.24 μg/mL, followed by 17.93-24.47 μg/mL for glycyrrhizn and 2.38-3.29 μg/mL for atractylenolide III. Compared with the content of other commercial PWS sample, the content of hesperidin from F8 sample were highest amount (60.24 μg/mL), and F3 sample were lowest amount (42.95 μg/mL). Glycyrrhizin and atractylenolide III were abundant in the sample of F7 and F8, respectively. Naringin and magnolol not detected in all commercial PWS samples. Magnolol was detected all commercial PWS samples, but their amounts was lower than LOD consequently, we decided to not detect. The diversity of the contents was mostly derived from the different quality of the raw material and place of the manufacturer, and also could be from the difference of manufacturer process, storage, and transport. In conclusion, our study simultaneous quantification determined the compounds in PWS by HPLC-DAD method.
Table 6.
Substances of five marker compounds in commercial pyeongwee-san samples
CONCLUSION
Effective method to evaluate and control the quality of herbal medicines was required. Previous study reported method for quantification analysis of the two target compounds, hesperidin and glycyrrhizin by HPLC-DAD and analysis method of the three compounds, liquiritin, hesperidin, and glycyrrhizin by HPLC-PAD. However, dealing with just two compounds from medicinal herbs is not corresponding with the characteristics of describing effects on multiple targets.[17,18]
In this study, a simple and reliable HPLC-DAD assay method has been developed for simultaneous quantification of five major compounds (naringin, hesperidin, glycyrrhizin, atractylenolide III, and magnolol) in PWS. In addition, confirmation of peak identification was achieved by LC-MS/MS. The analytical method was proved to have excellent linearity, LOD, LOQ, precision and recovery. The method was then successfully applied in the quantitative determination of the major compounds from 12 batches of PWS. This result demonstrated that the quality of other related pharmaceutical preparations and the proposed method could be readily utilized as a routine analysis and effective quality control method for PWS and other traditional medicine with similar preparations.
ACKNOWLEDGMENTS
This research was supported by Basic Science Research Program through the National Research Foundation of Korea (NRF) funded by the Ministry of Education, Science and Technology (2010-0005149).
Footnotes
Source of Support: Nil
Conflict of Interest: None declared.
REFERENCES
- 1.Lu AP, Jia HW, Xiao C, Lu QP. Theory of traditional Chinese medicine and therapeutic method of diseases. World J Gastroenterol. 2004;10:1854–6. doi: 10.3748/wjg.v10.i13.1854. [DOI] [PMC free article] [PubMed] [Google Scholar]
- 2.Xue T, Roy R. Studying traditional Chinese medicine. Science. 2003;300:740–1. doi: 10.1126/science.300.5620.740. [DOI] [PubMed] [Google Scholar]
- 3.Normile D. Asian medicine. The new face of traditional Chinese medicine. Science. 2003;299:188–90. doi: 10.1126/science.299.5604.188. [DOI] [PubMed] [Google Scholar]
- 4.Kamgoj VP. Herbal medicine. Curr Sci. 2000;78:35–9. [Google Scholar]
- 5.Choi DW, Kim JH, Cho SY, Kim DH, Chang SY. Regulation and quality control of herbal drugs in Korea. Toxicology. 2002;181-182:581–6. doi: 10.1016/s0300-483x(02)00487-0. [DOI] [PubMed] [Google Scholar]
- 6.Du Y, Liu P, Yuan Z, Jin Y, Zhang X, Sheng X, et al. Simultaneous qualitative and quantitative analysis of 28 components in Isodon rubescens by HPLC-ESI-MS/MS. J Sep Sci. 2010;33:545–57. doi: 10.1002/jssc.200900704. [DOI] [PubMed] [Google Scholar]
- 7.Yin L, Lu B, Qi Y, Xu L, Han X, Xu Y, et al. Simultaneous determination of 11 active components in two well-known traditional Chinese medicines by HPLC coupled with diode array detection for quality control. J Pharm Biomed Anal. 2009;49:1101–8. doi: 10.1016/j.jpba.2009.01.039. [DOI] [PubMed] [Google Scholar]
- 8.Deng C, Ji J, Li N, Yu Y, Duan G, Zhang X. Fast determination of curcumol, curdione and germacrone in three species of Curcuma rhizomes by microwave-assisted extraction followed by headspace solid-phase microextraction and gas chromatography-mass spectrometry. J Chromatogr A. 2006;1117:115–20. doi: 10.1016/j.chroma.2006.03.066. [DOI] [PubMed] [Google Scholar]
- 9.Han NR, Moon PD, Kim HM, Jeong HJ. Effect of Pyeongwee-San (KMP6) on 2,4-dinitrofluorobenzene-induced atopic dermatitis-like skin lesions in NC/Nga mice. Life Sci. 2012;90:147–53. doi: 10.1016/j.lfs.2011.10.015. [DOI] [PubMed] [Google Scholar]
- 10.Shin IS, Seo CS, Ha HK, Lee MY, Huang DS, Huh JI, et al. Genotoxicity assessment of Pyungwi-san (PWS), a traditional herbal prescription. J Ethnopharmacol. 2011;133:696–703. doi: 10.1016/j.jep.2010.10.050. [DOI] [PubMed] [Google Scholar]
- 11.Jin SE, Moon PD, Koh JH, Lim HS, Kim HM, Jeong HJ. Inhibition of chemokine, interleukin-8 expression in an atopic milieu by Pyeongwee-San extract (KMP6) Orient Pharm Exp Med. 2011;11:71–6. [Google Scholar]
- 12.Cheng HT, Li XI, Li YH, Wang LJ, Xue M. Simultaneous quantification of selected compounds from Salvia herbs by HPLC method and their application. Food Chem. 2012;130:1031–5. [Google Scholar]
- 13.Wei H, Sun L, Tai Z, Gao S, Xu W, Chen W. A simple and sensitive HPLC method for the simultaneous determination of eight bioactive components and fingerprint analysis of Schisandra sphenanthera. Anal Chim Acta. 2010;662:97–104. doi: 10.1016/j.aca.2009.12.039. [DOI] [PubMed] [Google Scholar]
- 14.Oszmiański J, Wojdyło A, Gorzelany J, Kapusta I. Identification and characterization of low molecular weight polyphenols in berry leaf extracts by HPLC-DAD and LC-ESI/MS. J Agric Food Chem. 2011;59:12830–5. doi: 10.1021/jf203052j. [DOI] [PubMed] [Google Scholar]
- 15.Guo XF, Yue YD, Tang F, Wang J, Yao X, Sun J. Simultaneous Determination of Seven Flavonoids in Dan Bamboo Phyllostachys glauca McClure Leaf Extract and in Commercial Products by HPLC-DAD. J Food Biochem. 2012;36:1–10. [Google Scholar]
- 16.Liu AH, Li L, Xu M, Lin YH, Guo HZ, Guo DA. Simultaneous quantification of six major phenolic acids in the roots of Salvia miltiorrhiza and four related traditional Chinese medicinal preparations by HPLC-DAD method. J Pharm Biomed Anal. 2006;41:48–56. doi: 10.1016/j.jpba.2005.10.021. [DOI] [PubMed] [Google Scholar]
- 17.Lee MK, Choi OK, Park JH, Cho JH, Kim DH, Baek JH, et al. Simultameous determination of hesperidin and glycyrrhizin in Pyungwisan by HPLC/DAD. Korean J Pharmacogn. 2008;39:199–202. [Google Scholar]
- 18.Seo CS, Lee JA, Jung D, Lee HY, Lee JK, Ha H, et al. Simultaneous determination of liquiritin, hesperidin, and glycyrrhizin by HPLC-photodiode array detection and the anti-inflammatory effect of Pyungwi-san. Arch Pharm Res. 2011;34:203–10. doi: 10.1007/s12272-011-0204-2. [DOI] [PubMed] [Google Scholar]