

Abstract
Introduction
Mortality rates after severe sepsis are extremely high and the main focus of most research is short-term mortality, which may not be associated with long-term outcomes. The purpose of our study was to examine long-term mortality after a severe sepsis and identify factors associated with this mortality.
Methods
We performed a population-based study using Veterans’ Affairs administrative data of patients ≥ 65 of age. The outcome of interest was mortality >90 days following hospitalization. Our primary analyses were Cox proportional hazard models to examine specific risk factors for long-term mortality.
Results
There were 2,727 patients that met the inclusion criteria. Overall mortality was 55%, 1 and 2-year mortality rates were 31% and 43%, respectively. Factors significantly associated with long-term mortality included congestive heart failure, peripheral vascular disease, dementia, diabetes with complications, and use of mechanical ventilation. Smoking cessation and cardiac medications were associated with decreased long-term mortality rates.
Conclusions
We identified several factors, including receipt of mechanical ventilation, that were significantly associated with increased long-term mortality for survivors of severe sepsis. This information will help clinicians discuss prognosis with patients and their families.
Keywords: Sepsis, mortality, predictors, comorbid conditions
INTRODUCTION
Sepsis is defined as a systemic inflammatory response that is secondary to an acute infection [1]. Over the past 30 years, the incidence of sepsis and sepsis-related mortality has increased, [2] and it is now the 10th leading cause of death in the United States [3]. Approximately 750,000 people are affected annually by severe sepsis and more than 1/2 of the effected population is over 65 years old [4]. With an increasingly aging population in the United States, the incidence of sepsis is likely to increase in the future.
Past studies have focused on short-term outcomes after severe sepsis and have shown that 28-day mortality rates average 28% [4]. Martin et al reported a decrease of in hospital mortality rates from about 28% to 18% over the period of 1979–2000 but also an increase in the incidence of sepsis seen in the US [2]. There has been very little research on the long-term mortality of severe sepsis but the few studies have postulated that mortality rates at 1 year are extremely high and that current therapies based on reducing short-term mortality may be insufficient to reduce this long-term mortality [5]. Weycker et al reported a 1-year mortality rate of 51% and a 5-year mortality rate of 74% and showed a direct relationship between mortality rates and Charlson comorbidity scores, as well as number of sites of organ dysfunction [6]. Benjamin et al reported 1-year mortality rates of about 26% after severe sepsis [5]. Another study comparing trauma patients to sepsis patients showed a 2-year cumulative mortality rate of 67% in sepsis patients which was significantly higher than the 43% mortality rate of patients who were hospitalized for trauma [7]. There is a need for more data in this area because the high rates of long-term mortality after severe sepsis indicate that there may need to be a change in the treatment of patients both initially and during follow up. Also, an additional examination of the relationship between long-term mortality and specific comorbid conditions may give clinicians a better idea of prognosis for those who survive at least until discharge.
Our aim is to use the extensive data available in the Department of Veterans Affairs (VA) health care system to examine long-term (>90 days) mortality rates of patients over age 65 years hospitalized with severe sepsis and to assess the relationship between mortality and different variables such as sociodemographic factors, previous co-morbid conditions, severity of illness, organisms isolated at the time of infection, drug or alcohol abuse, and outpatient medications taken.
METHODS
Our study utilized data from the administrative databases of the Department of Veterans’ Affairs Health Care systems. The data was a collection of clinical data from all of the VA hospitals and outpatient clinics. The Institutional Review Board of the University of Texas Health Science Center at San Antonio approved this study under expedited review. Waiver of informed consent was obtained for this study.
Inclusion and exclusion criteria
Patients included in this study:
were aged 65 years or older on the date of admission.
had at least 1 outpatient clinic visit in the year preceding the index admission so as to ensure that information on prior comorbid conditions is available.
received at least 1 active and filled outpatient medication within 90 days of admission.
were hospitalized during the fiscal years 2002–2007 (Oct 2001–Sept 2007)
had a previously validated discharge diagnosis of sepsis [2, 8] - primary or secondary code of 038–038.9 plus at least 1 code for acute organ dysfunction-518.8x, 786.09, 799.1, 96.7, 458.0, 785.5x, 458.x, 796.3, 584, 580, 585, 39.95, 570, 572.2–3, 286.2, 286.6, 286.9, 287.3–5, 276.2, 293, 348.1, 348.3, 780.01, 780.09, 89.14, and
received at least 1 dose of antimicrobial therapy within the first 48 hours of admission.
We excluded any patient who died within 90-days of index admission so that we would be able to clearly examine factors associated with long-term mortality. If a patient was admitted more than once during the study period, only the first hospitalization was included.
Data sources
We used demographic, utilization, and comorbidity data from the National Patient Care Database, pharmacy data from the VA Decision Support System National Data Extracts and Pharmacy Benefits Management, and vital status information from VA’s Vital Status file which incorporates data from veterans’ death benefits claims, inpatient deaths, Medicare Vital Status files, and the Social Security Administration death master file. Encrypted patient identifiers link the information across these databases.
We obtained demographic information (age, sex, race, marital status) from inpatient and outpatient data. Race categories included white, black, Hispanic, and other/unknown. ICD-9 codes for tobacco use (305.1, V15.82), smoking cessation clinic use, and/or use of medications for the treatment of nicotine dependence (Zyban, nicotine replacement, or varenicline) were used to infer recent tobacco use. Priority status was used as a proxy for socioeconomic status. Priority groups include (a) at least 50% disabled by a military service-connected condition (priority group 1), (b) up to 40% service-connected disability or special wartime cohorts such as OEF/OIF (priority groups 2–6), and (c) higher income patients with no service connected injuries (priority groups 7–8).
We also obtained information on comorbid conditions from inpatient and outpatient administrative data. Alcohol abuse was defined by ICD-9 codes 291, 303, 305.0; and illicit drug use by ICD-9 codes 292, 304, 305 excluding 305.1. We used Charlson’s comorbidity methodology to classify other preexisting comorbid conditions [9, 10]. Charlson’s comorbidity system includes 19 comorbid conditions, which are classified using ICD-9 codes from prior outpatient and inpatient codes [11].
Pharmacy data were obtained from the VA Decision Support System and Pharmacy Benefits Management databases. Subjects were considered a current user of a given medication if their last prescription had sufficient supply to overlap the date of hospitalization, assuming an 80% compliance rate. To control for potential confounding by medications, a count of unique drugs in each of the following classes per patient was calculated for drugs refilled/filled within 90-days of presentation: cardiac medications, respiratory medications, and diabetic medications. A dichotomized variable was created for corticosteroid use. Previous research has demonstrated that using the count of these medication classes is preferable to adjusting for the individual medications [12].
Outcomes
Mortality was determined using the Veteran’s Affairs Vital Status File, which has been demonstrated to be as accurate as the “gold standard” National Death Index [13]. We excluded those subjects who died within 90-days so as to better assess factors associated with long-term, rather than short-term, mortality. Mortality was assessed through October 1, 2007. So as to be able to include the maximum number of subjects, and their follow up information, we utilized Kaplan-Meier and Cox proportional hazard survival methods that allow censoring of information at the end of follow-up (e.g., 180 days) but also allows us to examine longer time periods (e.g., 2 years).
Statistical Analyses
Bivariate statistics were used to test the association of sociodemographic and clinical characteristics with mortality > 90-days after admission. Categorical variables were analyzed using the chi-square test and continuous variables were analyzed using Student’s t-test. To examine time-to-diagnosis for several factors, graphs were created using Kaplan-Meier estimated probabilities.
Next we created 2 Cox Proportional hazard models to examine potential predictors long-term mortality. Due to violations of the proportional hazards assumption, we were unable to examine the entire follow up period in the same model. Grambsch and Therneau’s method was used to evaluate the proportional hazards assumption [14]. Factors examined in the models included demographics, mechanical ventilation, vasopressor use, prior comorbid conditions, and outpatient medications received within 90-days.
All analyses were performed using STATA 10 (College Station, Texas).
RESULTS
Patient Characteristics
A total of 2,727 patients met the criteria to be included in this study. We identified 7,302 hospitalizations due to severe sepsis that received antibiotic treatment within the first 48 hours of admission (Figure 1). Of those, we excluded the 4,411 patients that died within 90 days of hospital admission and 164 episodes that were rehospitalizations. Of those who meet the inclusion criteria, 1501 (55%) died during the follow-up period. Our cohort was largely male (98.5%) with an average age of 76 years (SD=6.5). The average Charlson comorbidity score was 3.5 (2.6) with COPD (29.2%), renal disease (28.2%), and congestive heart failure (26.1%) affecting the highest percentage of patients. Overall, 55% of patients were initially admitted to the ICU within 48 hours of admission, 24% received mechanical ventilation, and 29% received vasopressors. Table 2 demonstrates the association of variables of interest with long-term mortality.
Figure 1.
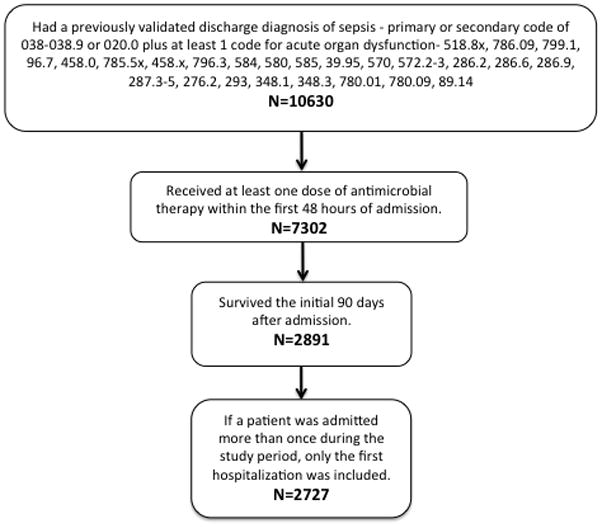
Cohort Inclusion Criteria
Table 2.
Univariate Analyses of the Associations with Long-Term Mortality (N=2727)
| Variable | Survived N (%) | Died N (%) | P-Value |
|---|---|---|---|
| Overall Survival | 1226 (45.0) | 1501 (55.0) | <0.01 |
|
| |||
| Sociodemographic: | |||
| Male | 1203 (44.1) | 1484 (54.4) | 0.1 |
| Age Group: | |||
| <60 years | 550 (20.2) | 579 (21.2) | <0.01 |
| 60–70 years | 471 (17.3) | 647 (23.7) | 0.01 |
| 70–80 years | 97 (3.6) | 141 (5.2) | 0.17 |
| 80–90 years | 2 (0.07) | 3 (0.11) | 0.82 |
| 90–100 years | 1 (0.04) | 1 (0.04) | 0.88 |
| Race: | |||
| White | 942 (34.5) | 1115 (40.9) | 0.12 |
| Black | 228 (8.4) | 307 (11.3) | 0.23 |
| Hispanic | 83 (3.0) | 115 (4.2) | 0.37 |
| Other | 56 (2.1) | 79 (2.9) | 0.41 |
| Married | 642 (23.5) | 742 (27.2) | 0.13 |
| Smoking Cessation | 383 (14.0) | 422 (15.5) | 0.08 |
| Alcohol Abuse | 51 (1.9) | 68 (2.5) | 0.64 |
| Drug Abuse | 17 (0.62) | 15 (0.55) | 0.35 |
| VA Priority Group: | |||
| 1 | 205 (7.5) | 264 (9.7) | 0.55 |
| 2–6 | 898 (32.9) | 1124 (41.2) | 0.33 |
| 7–8 | 120 (4.4) | 112 (4.1) | 0.03 |
| Comorbid Conditions: | |||
| Myocardial Infarction | 104 (3.8) | 158 (5.8) | 0.07 |
| Congestive Heart Failure | 253 (9.3) | 460 (16.9) | <0.01 |
| Peripheral Vascular Disease | 210 (7.7) | 332 (12.2) | <0.01 |
| COPD | 324 (11.9) | 471 (17.3) | <0.01 |
| Rheumatic Fever | 35 (1.3) | 40 (1.5) | 0.76 |
| Cirrhosis | 12 (0.44) | 27 (0.99) | 0.07 |
| Dementia | 35 (1.3) | 76 (2.8) | <0.01 |
| Diabetes (without complications) | 533 (19.5) | 657 (24.1) | 0.88 |
| Diabetes (with complications) | 192 (7.0) | 293 (10.7) | <0.01 |
| Hepatitis | 6 (0.22) | 13 (0.48) | 0.24 |
| Paraplegia | 33 (1.2) | 52 (1.9) | 0.25 |
| Renal Disease | 319 (11.7) | 450 (16.5) | 0.02 |
| Cancer | 283 (10.4) | 410 (15.0) | 0.01 |
| Metastatic Cancer | 42 (1.5) | 85 (3.1) | <0.01 |
| AIDS | 4 (0.15) | 7 (0.26) | 0.56 |
| Number of Medications by type:* | |||
| Diabetes | .43 (.02) | .41 (.02) | 0.28 |
| Pulmonary | .50 (.04) | .63 (.04) | 0.99 |
| Cardiac | 1.9 (.05) | 1.8 (.05) | 0.04 |
| Oral | .26 (.02) | .26 (.02) | 0.50 |
Table shows outcomes as total number and percentage or mean and standard deviation
Includes medications given 90 days prior to admission.
Figure 2 shows Kaplan-Meier survival curves looking at survival of patients that had undergone mechanical ventilation and those who had a prior diagnosis of chronic kidney disease, congestive heart failure, or COPD. All of the plots demonstrated statistically significant (p<0.001) associations with increased long-term mortality.
Figure 2.

Survival Curves Depicting the Association Between Survival and Mechanical Ventilation, Chronic Kidney Disease, COPD, and Congestive Heart Failure (all p values < 0.0001)
Table 3 shows the results of a multivariable Cox proportional hazards models examining the association between the variables of interest and long-term mortality between 90–365 days. Factors that were shown to be associated with increased risk of mortality between 90–365 days include age (HR 1.02, 95% CI 1.01–1.03), use of mechanical ventilation (HR 1.63 95% CI 1.37–1.95), presence of comorbid conditions such as myocardial infarction (HR 1.25, 95% CI 1.01–1.60) congestive heart failure (HR 1.28, 95% CI 1.08–1.52), peripheral vascular disease (HR 1.25, 95% CI 1.05–1.50), cirrhosis (HR 1.83, 95% CI 1.05–3.19), renal disease (HR 1.24, 95% CI 1.05–1.47), cancer (HR 1.25, 95% CI 1.05–1.49), and metastatic cancer (HR 2.00, 95% CI 1.47–2.32). Factors significantly associated with decreased mortality between 90–365 days include smoking cessation (HR 0.78, 95% CI 0.67–0.92) and cardiac medications received 90 days prior to hospitalization (HR 0.78, 95% CI 0.66–0.93). The data from Table 4 shows the relationship between the variables of interest and mortality greater than 365 days after admission. The variables that were associated with higher long-term mortality were age (HR 1.03, 95% CI 1.01–1.04), use of mechanical ventilation (HR 1.31, 95% CI 1.05–1.62), congestive heart failure (HR 1.63, 95% CI 1.35–1.98), peripheral vascular disease (HR 1.27, 95% CI 1.03–1.55), dementia (HR 1.90, 95% CI 1.34–2.71), and diabetes with complications (HR 1.55, 95% CI 1.22–1.97). Cardiac medications used 90 days prior to admission (HR 0.74, 95% CI 0.62–0.90) was associated with decreased mortality >365 days.
Table 3.
Results of Cox Proportional Hazard Regression for Mortality between 90–365 days
| Variable | Hazard Ratio | 95% Confidence Interval |
|---|---|---|
| Sociodemographic: | ||
| Age Admitted | 1.02 | 1.01–1.03 |
| Male | 1.96 | 0.81–4.75 |
| Race: | ||
| Hispanic | 1.22 | 0.93–1.60 |
| Black | 1.02 | 0.84–1.24 |
| Other | 1.49 | 1.11–1.99 |
| Married | 0.96 | 0.82–1.11 |
| Smoking Cessation | 0.78 | 0.65–0.92 |
| Alcohol Abuse | 0.99 | 0.68–1.44 |
| Drug Abuse | 0.45 | 0.17–1.24 |
| In-Hospital Treatments within 48 hours: | ||
| Vasopressor Use | 1.15 | 0.97–1.36 |
| Mechanical Ventilation | 1.63 | 1.37–1.95 |
| VA Priority Group: | ||
| 2–6 | 0.88 | 0.73–1.06 |
| 7–8 | 0.84 | 0.62–1.14 |
| Comorbid Conditions: | ||
| Myocardial Infarction | 1.27 | 1.01–1.60 |
| Congestive Heart Failure | 1.28 | 1.08–1.52 |
| Peripheral Vascular Disease | 1.25 | 1.04–1.50 |
| COPD | 1.21 | 1.00–1.45 |
| Rheumatic Fever | 1.01 | 0.68–1.65 |
| Cirrhosis | 1.83 | 1.05–3.19 |
| Dementia | 0.96 | 0.63–1.44 |
| Diabetes | 0.99 | 0.80–1.22 |
| Diabetes (with complications) | 1.08 | 0.87–1.35 |
| Hepatitis | 1.37 | 0.62–3.04 |
| Paraplegia | 1.17 | 0.79–1.72 |
| Renal Disease | 1.24 | 1.05–1.47 |
| Cancer | 1.25 | 1.05–1.49 |
| Metastatic Cancer | 2.00 | 1.47–2.72 |
| AIDS | 1.13 | 0.36–3.55 |
| Number of Medications by type:* | ||
| Diabetes | 0.92 | 0.73–1.16 |
| Pulmonary | 1.17 | 0.95–1.43 |
| Cardiac | 0.78 | 0.66–0.93 |
| Corticosteroids | 1.19 | 0.99–1.43 |
Includes medications given 90 days prior to admission.
Table 4.
Results of Multivariable Cox Proportional Hazard Regression for Mortality >365 days
| Variable | Hazard Ratio | 95% Confidence Interval |
|---|---|---|
| Sociodemographic: | ||
| Age Admitted: | 1.03 | 1.01–1.04 |
| Male | 0.82 | 0.44–1.55 |
| Race: | ||
| Hispanic | 0.81 | 0.57–1.16 |
| Black | 1.08 | 0.88–1.33 |
| Other | 0.87 | 0.56–1.37 |
| Married | 0.95 | 0.80–1.12 |
| Smoking Cessation | 0.92 | 0.76–1.11 |
| Alcohol Abuse | 1.25 | 0.86–1.84 |
| Drug Abuse | 1.14 | 0.60–2.16 |
| In-Hospital Treatments within 48 hours: | ||
| Vasopressor Use | 0.83 | 0.68–1.02 |
| Mechanical | 1.31 | 1.05–1.62 |
| Ventilation | ||
| VA Priority Group: | ||
| 2–6 | 1.14 | 0.91–1.43 |
| 7–8 | 0.90 | 0.62–1.30 |
| Comorbid Conditions: | ||
| Myocardial Infarction | 0.98 | 0.74–1.31 |
| Congestive Heart Failure | 1.63 | 1.35–1.98 |
| Peripheral Vascular Disease | 1.27 | 1.03–1.55 |
| COPD | 0.98 | 0.80–1.21 |
| Rheumatic Fever | 0.97 | 0.58–1.62 |
| Cirrhosis | 1.46 | 0.68–3.11 |
| Dementia | 1.90 | 1.34–2.71 |
| Diabetes | 1.09 | 0.86–1.37 |
| Diabetes (with complications) | 1.55 | 1.22–1.97 |
| Hepatitis | 1.65 | 0.60–4.53 |
| Paraplegia | 1.33 | 0.86–2.05 |
| Renal Disease | 0.98 | 0.81–1.19 |
| Cancer | 1.13 | 0.92–1.39 |
| Metastatic Cancer | 1.03 | 0.63–1.67 |
| AIDS | 2.47 | 0.91–6.74 |
| Number of Medications by type:* | ||
| Diabetes | 0.80 | 0.62–1.03 |
| Pulmonary | 1.26 | 1.00–1.59 |
| Cardiac | 0.74 | 0.62–1.03 |
| Corticosteroids | 0.88 | 0.70–1.11 |
Includes medications given 90 days prior to admission.
DISCUSSION
Sepsis is a disease of great importance to clinicians, but long-term effects of a severe sepsis diagnosis have been studied only superficially. This study builds upon the small number of prior papers that examined the long-term effects of severe sepsis and found associations between long-term mortality and factors such as age, multiple comorbid conditions, mechanical ventilation, medication use, and smoking cessation. This study is important because it highlights the long-term effects of severe sepsis and should encourage clinicians to closely follow up patients who have survived severe sepsis.
The overall mortality rate of our cohort was 55% with a 1-year mortality rate of 30.6% and a 2-year mortality rate of 43%. These high mortality rates are similar to long-term mortality rates reported in other studies. For example, Weycker et al reported a 1-year mortality rate of 51.4% and Karlsson et al reported a 2-year mortality rate of 44.9% [6, 15]. Winters et al published a review study of long-term mortality after sepsis and found that 1-year mortality rates ranged from 7–43% [16]. One important difference in our reported mortality rates compared to previous studies is that we removed all of the deaths that occurred during the initial 90 days after hospitalization. This analysis allowed us to focus on the long-term effects of sepsis and avoid biasing our examination of the factors associated with long-term mortality with short-term factors. These mortality rates indicate the need for closer follow up for patients who have been hospitalized with severe sepsis even after full recovery from infection. All reported mortality rates have been very high and clinicians should be aware of this when treating patients with severe sepsis.
Previous studies have shown that both short-term and long-term mortality is associated with increasing Charlson comorbidity scores [6, 17]. The average Charlson comorbidity score of our cohort was 3.5 (SD 2.6), which is similar to previous research. Our study also broke up the Charlson comorbidity score to look at individual comorbidities so as to examine how each one relates to long-term mortality. We found that congestive heart failure, peripheral vascular disease, dementia, and diabetes with complications were associated with increased long-term mortality rates after 1 year. These diseases are associated with organ dysfunction and other chronic problems, so it is not surprising that a pre-existing diagnosis would increase long-term mortality. As one of the first studies to look at individual disease associations with mortality, we believe these results to be clinically relevant, because these specific conditions can be indications of poor outcomes for patients even after they survive their initial hospitalization.
Not surprisingly, we found that increasing age was also associated with increasing long-term mortality rates. We also showed that both the use of cardiac medication 90 days prior to hospitalization and smoking cessation were protective variables against mortality. The protective effect of cardiac medications may be due to “ healthy user behaviors” in that patients who were taking medications were more compliant and were more likely to live a healthy life style [18]. In addition, statins especially may have an effect upon severe sepsis. A recent systematic review of studies on statins and their effect on severe sepsis found that their use was associated with decreased short-term mortality [19]. The use of statins may lead to less physiological damage during the initial episode of sepsis, which allows them to have better long-term outcomes. Smoking cessation was also protective against long-term mortality. Studies have shown that smoking does not cause differences in sepsis-related mortality [20]. We therefore hypothesize that smoking cessation is probably also related to the healthy user behaviors discussed above.
Another important finding of this study is that use of mechanical ventilation is associated with increased long-term mortality. In the short term, mechanical ventilation is associated with increased severity of disease [21] and therefore, higher short-term mortality rates. We hypothesize it is associated with increased long-term mortality due to higher levels of organ damage that occurred due to the increased severity of sepsis. In addition, Villar et al showed that using mechanical ventilation can increase the inflammatory response [22] and increased inflammation has been associated with increased cardiovascular events [23], which may lead to higher long-term mortality.
Limitations of our study include a small percentage of women in our cohort, which potentially limits the generalizability of the data. In addition, we had to rely on administrative data for comorbidity and diagnostic data, which may be at times inaccurate and lacks other data elements that we would like to examine (e.g., use of sepsis bundles). However, due to our use of VA data and the validated techniques utilized in this study we do not believe that there is substantial risk of bias for VA [24, 25]. Also, we restricted this cohort to patients ≥65 years, and therefore, this study may not apply to younger patients. In addition, due to the design of the primary study we are unable to examine the impact of nosocomial infections on long-term mortality. Finally, we did not have a control group without severe sepsis so we were unable to compare mortality between those with and without severe sepsis.
CONCLUSION
In conclusion, there is substantial long-term mortality after severe sepsis and care should not end after release from the hospital especially for patients with the risk factors for long-term mortality. Clinicians should closely monitor those who survive the initial hospitalization for severe sepsis so as to identify factors that may be potentially modifiable. In addition, this information should be provided to patients and their families so as to help them understand the natural history of severe sepsis.
Table 1.
Characteristics of Patients with Severe Sepsis (n=2727)
| Variables | N (%) |
|---|---|
| Sociodemographic: | |
| Age (years) | 76 (6.5) |
| Average Survival (days) | 1411.7 (1080.4) |
| Overall mortality | 1501(55.0) |
| Sex: | |
| Male | 2687 (98.5) |
| Female | 40 (1.5) |
| Race: | |
| White | 2057 (75.4) |
| Black | 535 (19.6) |
| Hispanic | 198 (7.3) |
| Other | 135 (5.0) |
| Marital Status | |
| Single | 1343 (49.2) |
| Married | 1384 (50.8) |
| Alcohol Abuse | 119 (4.4) |
| Smoking Cessation | 805 (29.5) |
| Drug Abuse | 32 (1.2) |
| In-Hospital Treatments within 48 hours of admission: | |
| Admitted to ICU | 1501 (55.0) |
| Mechanical Ventilation | 661 (24.2) |
| Vasopressor Use | 799 (29.3) |
| VA Priority Group: | |
| 1 | 469(17.2) |
| 2–6 | 2022(74.1) |
| 7–8 | 232(8.5) |
| Comorbid Conditions: | |
| Myocardial Infarction | 262 (9.6) |
| Congestive Heart Failure | 713 (26.1) |
| Peripheral Vascular Disease | 542 (19.9) |
| COPD | 795 (29.2) |
| Rheumatic Fever | 75 (2.8) |
| Cirrhosis | 39 (1.4) |
| Dementia | 111 (4.1) |
| Diabetes (with complications) | 485 (17.8) |
| Hepatitis | 19 (0.7) |
| Paraplegia | 85 (3.1) |
| Renal Disease | 769 (28.2) |
| Cancer | 693 (25.4) |
| Metastatic Cancer | 127 (4.7) |
| AIDS | 11 (0.4) |
| Charlson Comorbidity Score | 3.5 (2.6) |
| Number of Medications by type:* | |
| Diabetes | 0.4 (0.7) |
| Pulmonary | 0.6 (1.3) |
| Cardiac | 1.9 (1.7) |
| Oral | 0.3 (0.6) |
All factors listed in this table are given as total number and percentage or mean and standard deviation.
Includes medications given 90 days prior to admission.
Acknowledgments
The project described was supported by Grant Number R01NR010828 from the National Institute of Nursing Research. The content is solely the responsibility of the authors and does not necessarily represent the official views of the National Institute of Nursing Research or the National Institutes of Health. This material is the result of work supported with resources and the use of facilities at the South Texas Veterans Health Care System. Funding agencies had no role in conducting the study, or role in the preparation, review, or approval of the manuscript.
Footnotes
The views expressed in this article are those of the authors and do not necessarily represent the views of the Department of Veterans Affairs.
The authors declare that they have no conflicts of interest relating to this manuscript.
References
- 1.Bone RC, Balk RA, Cerra FB, et al. Definitions for sepsis and organ failure and guidelines for the use of innovative therapies in sepsis. The ACCP/SCCM Consensus Conference Committee. American College of Chest Physicians/Society of Critical Care Medicine. 1992. Chest. 2009;136(5 Suppl):e28. doi: 10.1378/chest.101.6.1644. [DOI] [PubMed] [Google Scholar]
- 2.Martin GS, Mannino DM, Eaton S, et al. The epidemiology of sepsis in the United States from 1979 through 2000. N Engl J Med. 2003;348(16):1546–54. doi: 10.1056/NEJMoa022139. [DOI] [PubMed] [Google Scholar]
- 3.Xu J, Kochanek KD, Murphy SL, et al. Deaths: Final Data for 2007. National Vital Statistics Reports. 2010;58(19) [PubMed] [Google Scholar]
- 4.Angus DC, Wax RS. Epidemiology of sepsis: an update. Crit Care Med. 2001;29(7 Suppl):S109–16. doi: 10.1097/00003246-200107001-00035. [DOI] [PubMed] [Google Scholar]
- 5.Benjamim CF, Hogaboam CM, Kunkel SL. The chronic consequences of severe sepsis. Journal of Leukocyte Biology. 2004;75(3):408–412. doi: 10.1189/jlb.0503214. [DOI] [PubMed] [Google Scholar]
- 6.Weycker D, Akhras KS, Edelsberg J, et al. Long-term mortality and medical care charges in patients with severe sepsis. Crit Care Med. 2003;31(9):2316–23. doi: 10.1097/01.CCM.0000085178.80226.0B. [DOI] [PubMed] [Google Scholar]
- 7.Korosec Jagodic H, Jagodic K, Podbregar M. Long-term outcome and quality of life of patients treated in surgical intensive care: a comparison between sepsis and trauma. Critical Care. 2006;10(5):R134. doi: 10.1186/cc5047. [DOI] [PMC free article] [PubMed] [Google Scholar]
- 8.Angus DC, Linde-Zwirble WT, Lidicker J, et al. Epidemiology of severe sepsis in the United States: analysis of incidence, outcome, and associated costs of care. Crit Care Med. 2001;29(7):1303–10. doi: 10.1097/00003246-200107000-00002. [DOI] [PubMed] [Google Scholar]
- 9.Charlson ME, Pompei P, Ales KL, et al. A new method of classifying prognostic comorbidity in longitudinal studies: Development and validation. J Chron Dis. 1987;40(5):373–383. doi: 10.1016/0021-9681(87)90171-8. [DOI] [PubMed] [Google Scholar]
- 10.Charlson M, Szatrowski TP, Peterson J, et al. Validation of a combined comorbidity index. J Clin Epidemiol. 1994;47(11):1245–1251. doi: 10.1016/0895-4356(94)90129-5. [DOI] [PubMed] [Google Scholar]
- 11.Deyo RA, Cherkin DC, Ciol MA. Adapting a clinical comorbidity index for use with ICD-9-CM administrative databases. J Clin Epidemiol. 1992;45(6):613–9. doi: 10.1016/0895-4356(92)90133-8. [DOI] [PubMed] [Google Scholar]
- 12.Schneeweiss S, Seeger JD, Maclure M, et al. Performance of comorbidity scores to control for confounding in epidemiologic studies using claims data. Am J Epidemiol. 2001;154(9):854–64. doi: 10.1093/aje/154.9.854. [DOI] [PubMed] [Google Scholar]
- 13.Sohn MW, Arnold N, Maynard C, et al. Accuracy and completeness of mortality data in the Department of Veterans Affairs. Popul Health Metr. 2006;4:2. doi: 10.1186/1478-7954-4-2. [DOI] [PMC free article] [PubMed] [Google Scholar]
- 14.Therneau TM, Grambsch PM, Fleming TR. Martingale hazards regressions and the analysis of censored survival data. Biometrika. 1990;77:147–160. [Google Scholar]
- 15.Karlsson S, Ruokonen E, Varpula T, et al. Long-term outcome and quality-adjusted life years after severe sepsis. Critical Care Medicine. 2009;37(4):1268–74. doi: 10.1097/CCM.0b013e31819c13ac. [DOI] [PubMed] [Google Scholar]
- 16.Winters BD, Eberlein M, Leung J, et al. Long-term mortality and quality of life in sepsis: a systematic review. Critical Care Medicine. 2010;38(5):1276–83. doi: 10.1097/CCM.0b013e3181d8cc1d. [DOI] [PubMed] [Google Scholar]
- 17.Yang Y, Yang KS, Hsann YM, et al. The effect of comorbidity and age on hospital mortality and length of stay in patients with sepsis. Journal of critical care. 2010;25(3):398–405. doi: 10.1016/j.jcrc.2009.09.001. [DOI] [PubMed] [Google Scholar]
- 18.Majumdar SR, McAlister FA, Eurich DT, et al. Statins and outcomes in patients admitted to hospital with community acquired pneumonia: population based prospective cohort study. BMJ. 2006;333:999. doi: 10.1136/bmj.38992.565972.7C. [DOI] [PMC free article] [PubMed] [Google Scholar]
- 19.Janda S, Young A, Fitzgerald JM, et al. The effect of statins on mortality from severe infections and sepsis: a systematic review and meta-analysis. Journal of critical care. 2010;25(4):656 e7–22. doi: 10.1016/j.jcrc.2010.02.013. [DOI] [PubMed] [Google Scholar]
- 20.Ferro TN, Goslar PW, Romanovsky AA, et al. Smoking in trauma patients: the effects on the incidence of sepsis, respiratory failure, organ failure, and mortality. The Journal of trauma. 2010;69(2):308–12. doi: 10.1097/TA.0b013e3181e1761e. [DOI] [PubMed] [Google Scholar]
- 21.Knaus WA. Prognosis with mechanical ventilation: the influence of disease, severity of disease, age, and chronic health status on survival from an acute illness. The American review of respiratory disease. 1989;140(2 Pt 2):S8–13. doi: 10.1164/ajrccm/140.2_Pt_2.S8. [DOI] [PubMed] [Google Scholar]
- 22.Villar J, Cabrera N, Casula M, et al. Mechanical ventilation modulates Toll-like receptor signaling pathway in a sepsis-induced lung injury model. Intensive Care Medicine. 2010;36(6):1049–57. doi: 10.1007/s00134-010-1799-3. [DOI] [PubMed] [Google Scholar]
- 23.Hansson GK. Inflammation, atherosclerosis, and coronary artery disease. The New England journal of medicine. 2005;352(16):1685–95. doi: 10.1056/NEJMra043430. [DOI] [PubMed] [Google Scholar]
- 24.Kashner TM. Agreement between administrative files and written records. Medical Care. 1998;36(9):1324–1336. doi: 10.1097/00005650-199809000-00005. [DOI] [PubMed] [Google Scholar]
- 25.Szeto HC, Coleman RK, Gholami P, et al. Accuracy of computerized outpatient diagnoses in a Veterans Affairs general medicine clinic. Am J Manag Care. 2002;8(1):37–43. [PubMed] [Google Scholar]