

Abstract
This paper presents a novel microfluidic cytometer for mammalian cells that rapidly measures the irreversible photobleaching of red fluorescent proteins expressed within each cell and achieves high purity (>99%) selection of individual cells based on these measurements. The selection is achieved by using sub-millisecond timed control of a piezo-tilt mirror to steer a focused 1064-nm laser spot for optical gradient force switching following analysis of the fluorescence signals from passage of the cell through a series of 532-nm laser beams. In transit through each beam, the fluorescent proteins within the cell undergo conversion to dark states, but the microfluidic chip enables the cell to pass sufficiently slowly that recovery from reversible dark states occurs between beams, thereby enabling irreversible photobleaching to be quantified separately from the reversible dark-state conversion. The microfluidic platform achieves sorting of samples down to sub-millilitre volumes with minimal loss, wherein collected cells remain alive and can subsequently proliferate. The instrument provides a unique first tool for rapid selection of individual mammalian cells on the merits of photostability and is likely to form the basis of subsequent lab-on-a-chip platforms that combine photobleaching with other spectroscopic measurements for on-going research to develop advanced red fluorescent proteins by screening of genetic libraries.
Introduction
The development of the green fluorescent protein (GFP) has been a key innovation for visualizing molecular pathways in living cells to help unravel new understanding of life processes, as recognized by the 2008 Nobel prize in chemistry.1 The increasing importance of additional fluorescent proteins has been accentuated by tremendous advances in fluorescence imaging techniques, for example, super-resolution single-molecule imaging, which exploits fluorescence switching caused by dark state conversion.2 Due to reduced autofluorescence background when using longer wavelengths, red fluorescent proteins (RFPs) are especially sought, but unfortunately they typically have poor long-term photostability. Continuing progress in bioimaging requires improved fluorescent proteins and hence vigorous efforts are underway to cultivate novel advanced RFPs. The microfluidic sorter described in this paper provides a substantial tool for use in this work as it offers innovative capability for selecting RFPs with reduced irreversible photobleaching in mammalian cells.
The procedures by which advanced fluorescent proteins are being developed have recently been reviewed.3 A common workflow involves rational design of amino-acid residues at key positions in the protein to influence a spectral phenotype followed by directed evolution to find combinations of residues at supporting positions to tune the photophysical properties. Usually this process is achieved by in vitro random mutagenesis coupled with bacterial expression and screening to isolate high-performing mutants. Alternatively, site-directed mutagenesis coupled with expression in mammalian cells automatically selects proteins readily expressible by the eukaryotic machinery and should thus provide advantages for developing mutants with low cytotoxicity that are optimized for expression and stability within these cells.3 Several successive rounds of mutagenesis and selection are generally required and hence selected cells must be capable of proliferation. Moreover, the major high-throughput screening approach currently in use for directed evolution is sorting of bacterial libraries using a fluorescence activated cell sorter (FACS) and for the most part, FACS instrumentation is limited to detection of only three parameters: fluorescence intensity, wavelength, and light scatter. Suggestions for new modalities of FACS that would be useful in developing new RFPs include fluorescence emission spectrum, brightness with two-photon excitation, fluorescence polarization anisotropy, and fluorescence lifetime.3 Further to these suggestions, the microfluidic sorter described in the current paper provides a different and new capability that directly addresses an essential requirement for applying selection pressure to improve photostability in advanced RFPs—namely sorting of cells on the basis of reduced irreversible photobleaching, measured while minimizing the concomitant decrease in fluorescence signal from reversible dark-state conversion.
Irreversible photobleaching is a particularly important parameter to isolate, because it ultimately limits the number of fluorescence photons that can be collected from a single protein, which is typically 10 to 100 times fewer than that obtained from a fluorescent dye molecule.4, 5 While dark-state conversion may be advantageous for a particular bioimaging format, irreversible photobleaching is always detrimental as it terminates single-molecule observation and limits super-resolution precision. The pathways and kinetics for dark-state conversion and photobleaching are poorly understood but in general are linked. Whereas photobleaching is caused by breaking of chemical bonds in the fluorophore, the mechanisms for dark-state conversion may include pH dependent protonation of part of the fluorophore moiety, or a conformational change of the fluorophore or its immediate environment, each with a relatively slow recovery (~10–1000 μs), and intersystem crossing to the triplet state with a faster recovery (~1 μs). The linking of the kinetics arises because irreversible photobleaching often results from absorption of light from an excited state, such as a triplet state or a dark state.
With 100-picosecond one-photon, or 100-femtosecond two-photon pulsed excitation of GFP, an increase of the inter-pulse interval from ~10 ns to 2 μs, to allow triplet-state relaxation between pulses, leads to decreased irreversible photobleaching and an increase in the total photon yield by a factor of 5–25.6 Conversion to a dark state is also found to accentuate irreversible photobleaching, but by an amount that varies for different RFPs.5
For wide-field modulated excitation of cells expressing RFP with much longer laser pulses obtained using a continuous 532-nm laser and an acousto-optic modulator (AOM) (cycles of 2 ms @ 25 kW/cm2 followed by 8 ms in the dark), the fluorescence signal from various RFPs characteristically quickly decreases during each pulse due to conversion to a dark state and mostly recovers between pulses due to recovery from the dark state. Moreover, there is also a slower decrease of the maximum fluorescence signal from one pulse to the next, which provides a measure of irreversible photobleaching that is largely isolated from the faster fluorescence decrease arising from conversion into dark states.5 In order to isolate and measure irreversible photobleaching in the microfluidic cell sorter, a similar modulated excitation as that formed by the AOM is achieved by allowing cells to flow at an appropriate speed through a series of laser beams upstream from the sorting region, as shown in Fig. 1. In contrast to the traditional FACS, which employs flow speeds of 1–10 m/s, the microfluidic device enables a much slower flow, with transit times of up to ~2 ms and with up to ~8 ms intervals between beams, which are separated by ~30 μm.
Fig. 1.
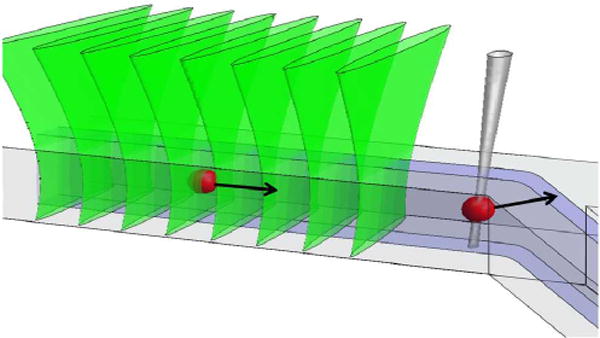
Schematic of a cell flowing through a series of line-focused 532-nm laser beams to yield a measure of irreversible photobleaching, which is used to decide its possible selection, made by turning on and translating a focused 1064-nm laser beam for optical gradient force switching.
While the number of beams required to differentiate RFPs with substantially different photobleaching can be as few as two or three,7 a larger number of beams provides greater photobleaching and better resolution of RFPs with high photostability, and hence the instrument may be configured to use as many as 8 beams of 532-nm light to characterize photobleaching, although oftentimes only 3 or 4 are sufficient. The ratio of the maximum fluorescence signal from the final beam to that from the initial beam is independent of the level of expression of RFP within the cell and yields a simple and reliable measure of the irreversible photobleaching. In earlier work, this measure has been shown to be capable of distinguishing individual cells within a mixed population even when they cannot be resolved by other spectroscopic signatures, such as fluorescence lifetime, or excitation or emission spectra.7
The microfluidic instrument described in this paper is unique in that it combines this rapid measurement of irreversible photobleaching with immediate analysis for real-time sorting of live mammalian cells. Several methods can be used for sorting of cells within microfluidic devices. Early devices used switching of electro-osmotically driven flow,8, 9 but are mostly impractical for manipulation of fragile mammalian cells.10 Other possible cell sorting techniques include use of acoustic waves,11–13 and fluidic displacement induced by pulsed laser cavitation bubble formation.14 Use of optical forces for sorting cells, which is based on early work on optical trapping of cells,15 is particularly suited for use within microfluidic devices. Optical sorting of cells in a microfluidic device has been demonstrated by switching on a tightly focused line from a 980-nm diode bar laser so cells flow along the line16 and also by pushing a cell by the optical scattering force along the laser direction into a separate fluidic channel in a multilayer device.17 Computer controlled holographic optical trapping with a high numerical aperture (NA) microscope objective to provide tight focusing has been reported for manipulating and sorting of human embryonic stem cells.18
In this work, sorting using optical gradient force switching was chosen because it is compatible with a single layer microfluidic device, it does not require high NA optics and it is suitable for live mammalian cells.19 As depicted in Fig. 1, a single focused 1064-nm laser spot is turned on and moved at an angle across the microfluidic channel, to deflect a cell by the optical gradient force so that it follows the trajectory of the spot towards a separate exit channel. As the speed of translation of the laser spot is matched to the flow velocity, the optical force does not have to be strong enough to overcome the flow, hence strong axial trapping is not needed and only a low NA lens is required for focusing the laser beam. The technique has previously been demonstrated to maintain the viability of HeLa cells with a 1064-nm laser power of >10 W and exposure of several milliseconds, which provides sufficient optical forces for efficient cell selection.19 Other authors have used a similar approach for sorting of mouse macrophage cells infected by a fluorescently labelled pathogen.20
In each of these earlier works, the fluorescence signal from transit of a cell through a single laser beam was passed to a hardwired circuit with a leading-edge discriminator, which triggered custom electronics19 or a programmed function generator20 to drive an AOM after a pre-set delay to deflect the beam and translate the laser spot. In contrast, in the present work, analysis of the multi-beam photobleaching signature is performed in software on a separate computer using the Real-Time module of LabView (National Instruments) to achieve deterministic (about ±0.005 ms), low-latency (< 3 ms), adjustably timed control of the sweep of the laser spot using a piezo-tilt mirror.
The instrument reported in this paper is an application of miniaturization and automation that presents marked advantages over existing manual techniques used in developing new RFPs. In previous work by Tsien and coworkers, directed evolution of orange and red fluorescent proteins with increased photostability was achieved by manual selection of colonies of bacterial cells that maintained fluorescence following prolonged (10–120 min) wide-field exposure.21 Similarly, manual sorting of E-coli bacterial colonies in a petri dish following fluorescence lifetime measurements has been used to screen a structure-guided library of the Cerulean fluorescent protein, which has a quantum yield of ~49%, to develop a cyan fluorescent protein with an almost 2-fold gain in fluorescent quantum efficiency.22 While the decreasing of photobleaching could potentially yield a far larger gain in total photon signal, technology for sorting individual cells based on photobleaching has not been previously available. In contrast to these previously used techniques, the present instrument enables high-speed automated selection of individual mammalian cells. It uses photobleaching irradiance levels similar to those used in many fluorescence imaging experiments (~2–25 kW/cm2) and it achieves high purity (>99%) in the selected population, as demonstrated by experiments with known mixtures of cells. It hence provides an important new tool for efforts to develop novel RFPs with enhanced photostability and low toxicity in mammalian cells. It is likely to lead the lab-on-a-chip community to develop subsequent cell sorters that combine photobleaching with other spectroscopic measurements.23
Methods
Microfluidic chip, microscope and detection
Fig. 2 shows a schematic of the entire experimental system, with specific details for key components given in the figure or figure caption. An expanded diagram of the microfluidic chip is at the top left in the figure. The cell sorting uses up to 20 W of 1064-nm laser light, so to avoid absorption of this light by the device and possible burning or damage, the microfluidic chip (custom fabricated by Micronit, Netherlands) is made entirely from borosilicate glass.† The ports of the chip are sealed to a polytetrafluoroethylene (PTFE) manifold using compression fit o-rings. For each of the 5 inlet/outlet ports, the manifold contains a reservoir connected at the top to an access hole, sealed by a cap screw, which is removed for loading and recovering samples with a micropipette, and also to a side line for delivery of compressed air to enable the headspace of the reservoir to be pressurized. The outlet reservoirs (channels E and F) are left open to atmospheric pressure and three adjustable, electronic pressure controls (Pneutronics, OEM EPS10-5-0-2) with a range of 0–2 psi above atmospheric pressure are used to regulate the inlet flow rates of the sample (in channel A, Fig. 2) and two buffer streams (in channels B) to achieve hydrodynamic focusing of the sample stream (in channel D), and adjust its path within the microfluidic device so that it exits into the side channel (channel F).
Fig. 2.
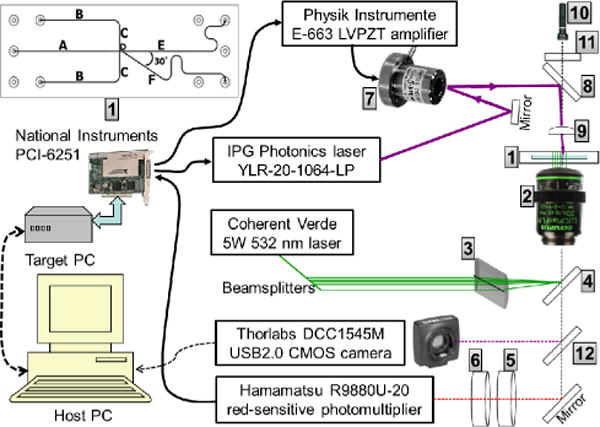
Schematic of the experimental system. [1]=the microfluidic chip, shown within the system and at top left: Channel lengths (mm), widths (μm) are: A 20,100; B 15, 130; C 5, 130; D 0.5, 15, E 27, 125; F 27, 125. All channels are wet etched to 25 μm depth into a 0.7 mm thick borosilicate glass substrate, which is bonded to a 1.1 mm thick glass cover-plate that has powder-blasted vias of 0.6–1.7 mm (bottom–top) diameter (~1.2 μl volume). Key system components are: [2]=Olympus IX71, inverted microscope with Olympus LUC Plan FLN 20× UIS2 NA0.45/∞/cc0–2 mm objective; [3]=Thorlabs LJ1996L1-A plano-convex cylindrical lens, focal length f=300 mm; [4]=Chroma z532 rdc, dichroic filter (reflects 532 nm, transmits >550 nm); [5]=Semrock FF01-720/SP-25, short-pass filter (transmits 320–690 nm, blocks >720 nm with optical density OD>7); [6]=Chroma HQ545LP, dichroic filter (transmits >545 nm, blocks <540 nm OD>5); [7]=Physik Instrumente S-315, piezo-tilt mirror, [8]=Newport 10QM20HM.15, dielectric mirror (reflects 1064 nm, transmits <900 nm); [9]=Thorlabs A397TM-C, aspheric lens, f=11 mm; [10]=Maglite, Krypton bulb; [11]=Semrock FF01-736/LP-25, long-pass filter (transmits >750 nm, blocks <736 nm OD>3); [12]=Semrock FF720-SDi01-25×36 dichroic filter (transmits 400–700 nm, reflects 720–890 nm).
As shown in Fig. 2, the microfluidic chip [1] and manifold are mounted on an inverted microscope that uses a dry objective [2] for epi-illumination and collection of fluorescence. The beam from a 532-nm laser is split into 9 beams (only 5 are shown) of adjustable powers with a series of beamsplitters and neutral density filters. The beams pass through a cylindrical lens [3], enter the side port of the microscope and reflect from a dichroic mirror [4] to form line-focused beams within the microfluidic device [1] (8 of the beams in channel D, as depicted in Fig. 1, and the 9-th monitor beam in channel E, for counting of selected cells, as discussed below). Any of the beams may be blocked, including the monitor beam; oftentimes only 4 or 5 beams are used. Red fluorescence from cells passing through these beams is isolated using filters [5, 6] (pass-band 545–690 nm) and detected with a photomultiplier (operated at –650 V). The photomultiplier signal is conditioned by a custom-built trans-impedance amplifier (which gives 10V output for a 100 μA input and 0.16–10.6 kHz band-pass) and digitized at 125 kHz, 16-bit resolution by a multifunction data acquisition (DAQ) card (National Instruments PCI-6251 with NI-SCXI). This card also provides a digital output for switching the 1064-nm laser on/off and two 0–10 V analogue outputs for control of two actuators of the piezo-tilt mirror [7] through a low-voltage piezo amplifier. The DAQ card is operated in a separate computer (Target PC) controlled by the main computer (Host PC). For sorting of cells, the piezo-tilt mirror steers the beam from a 1064-nm laser, which is reflected from a dielectric mirror [8] and focused in through the top of the microfluidic chip by an aspheric lens [9]. In order to visualize cells during operation of the sorter, trans-illumination of the chip is provided a Krypton bulb [10] and a long-pass filter (>750 nm) [11] and scattered light from cells is separated by a dichroic filter [12] for viewing with a CMOS camera.
Optical design of gradient force switching
The 1064-nm optical deflection beam is focused through the top cover-plate of the microfluidic device using an aspheric lens [9] with focal length f=11 mm. The lens is antireflection coated and provides high transmission (>99%) and low loss compared to a microscope objective. Although the lens is designed for use at a wavelength of 670 nm and for focusing through a laser diode window of 0.275 mm thickness with NA 0.3, Zemax optical design software indicates that when the Gaussian 1064-nm laser beam is focused by the lens through the 1.1 mm thick glass top of the microfluidic device at a NA of 0.25, the focused spot size, as seen in the inset of Fig. 3, is close to the diffraction limited size of the Airy disk over the entire trajectory. As the depth of the microfluidic channel is only 25 μm compared to 50 μm in earlier work,19 a higher NA was chosen (0.25 rather than 0.2) to produce a sharper axial optical field gradient (the spot area doubles over the Rayleigh range of ±4.1 μm rather than ±6.3 μm).
Fig. 3.
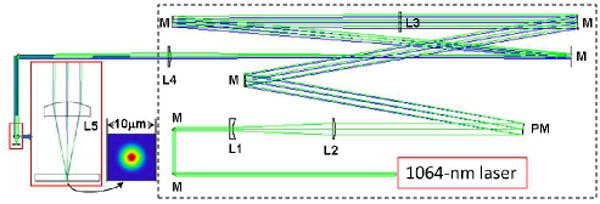
Layout of optical components for optical force switching; M=Mirror, PM=Piezo-tilt mirror (rays are shown for the extreme tilts), L=Lens (Thorlabs part #), L1=Plano-concave f=−50 mm (LC1715-C), L2=Plano-convex f=175 mm (LA1229-C), L3=Plano-convex f=1000 mm (LA1464-C), L4=Plano-convex f=300 mm (LA1484-C), L5=convex aspheric f=11 mm (A397TM-C). Separations between component vertices are: L1–L2=125.2 mm; PM–L3=998.5 mm; L3–L4=1289.0 mm; L4–L5= 289.4 mm. L1 orientation is reversed to balance spherical aberration. The inset shows the Huygens point-spread function of the laser beam focus.
The piezo-tilt mirror used to translate the focused spot within the microfluidic channel has an equilateral tripod mount that gives up to ±600 μrad of tilt in total when two of the three actuators are oppositely extended over their full range. The full angular tilt in a beam reflected from the mirror is two times that value, or 2400 μrad in total. If this tilt is applied at the entrance pupil of the 11 mm focal length aspheric lens, the scan distance of the spot would be 11 mm × 2.4 ×10−3 = 26.4 μm. To increase the scan distance, as shown in the optical layout in Fig. 3, the piezo-tilt mirror [PM] is imaged onto the entrance pupil of the aspheric lens [L5] with a magnification of 3.33, using a pair of lenses [L3 and L4], which are spaced so that the collimated beam from the piezo-tilt mirror is re-collimated at the aspheric focusing lens. With adjustment of two of the three actuators, the laser spot can be scanned in the microfluidic channel over an area with longest diagonal of 88 μm. The tilt mirror is driven by a 3-channel 100 V amplifier controlled by 0–10 V analogue input signals. The minimum time taken to scan the full range is approximately 2 ms. Manipulation of beads has been demonstrated with the same piezo-tilt mirror.24
To achieve the desired numerical aperture in focusing, the 1064-nm laser beam is expanded ×3.5 using a pair of planoconcave and plano-convex singlet lenses [L1 and L2] and the beam path is folded to form a more compact assembly for enclosure within a box, as seen in Fig. 3.
Timing set-up
In setting up for sorting, the trajectory over which the 1064-nm laser spot scans is adjusted downstream from the photobleaching beams, as shown in Fig. 4. The orientation and voltage limits of the piezo-tilt mirror are set to make a triangular trajectory, 123, shown by the dashed red line in Fig. 4, where the 1064-nm laser turns on over path 12 and turns off over path 31. When a cell passes through the photobleaching beams (green lines at left in Fig. 4), the signals are analysed and if the cell is selected, the 1064-nm spot must turn on with correct start time and scan with a speed matched to that of the cell so that it intercepts the cell.
Fig. 4.
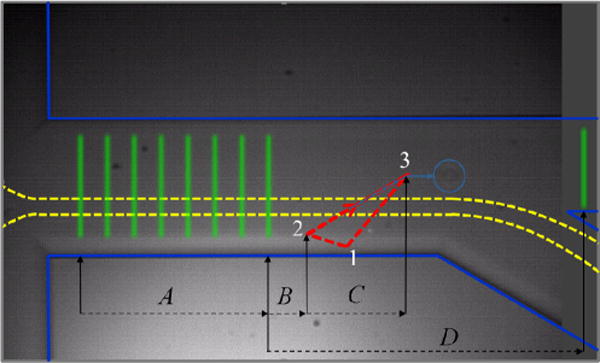
Camera image of microfluidic device with overlay of laser beam positions and trajectories. The 8 green lines at left represent line-focused 532-nm fluorescence excitation beams. The red dashed triangle is the trajectory of the 1064-nm optical deflection laser spot. The dashed yellow lines envelope the trajectories of cells as they pass into the exit channel at lower right. The image in this camera frame has captured a cell that was deflected along the light blue line to point 3, is now within the light blue circle, and will subsequently pass into the sort channel at upper right, to be counted as it passes through the 9-th 532-nm laser line at far right.
To accomplish this, the camera image is used to measure the displacements shown in Fig. 4: A, between the 1-st and last green photobleaching beams; B, between the last photobleaching beam and point 2 of the 1064-nm spot trajectory; C, the down-channel component between points 1 and 2 of the trajectory; and D, between the last photobleaching beam and the monitor beam, which is positioned in the sort channel (channel E of Fig. 2) as a means of counting cells that pass into that channel. The program on the Target PC measures TA the time of passage of a cell between the 1-st and last photobleaching beams, which depends on the setting of the pressures that drive the flow. (Due to the pressure-driven parabolic flow profile, the passage time also depends on the exact depth of the cell within the channel, but all cells are carried close to the centre depth where the flow speed is greatest, so the variation is found to be only ± 9 % at most.)
The start time of the trajectory of the 1064-nm spot is adjusted so that the time delay TB from the moment that a cell passes the last photobleaching beam to the time when the 1064-nm spot passes point 2 in its trajectory is TB = (B/A) TA. The speed of the trajectory along path 23 is adjusted so that TC = (C/A) TA. Finally, the delay for recognition of a cell passing through the monitor beam is TD = F (D/A) TD, where a factor of F ≈ 1.67 is used to account for a slow-down in the flow speed beyond the channel junction, as the microfluidic device is designed with a main channel of width 150 μm and two exit channels each of width 125 μm, so that the net flow speed slows by a factor of 0.6 (=1/1.67).
If the monitor beam is used, a peak that follows one from a cell passing the last photobleaching beam within a delay of (1±δ) TD is categorized as due to that same cell passing through the monitor beam, where S ~ 0.1 is a tolerance parameter. However, such a peak could also be due to a new cell entering beam 1 with the required delay. Thus the monitor beam gives a useful indication of successful cell selection for optimizing efficiency, but the categorization of peaks on the basis of their timing leads to over-counting of sorted cells, particularly when the incoming rate of cells is high, and hence it provides only a low-limit estimate for the purity of the selected cells. As discussed below, the purity of the selected cells is better determined by subsequent spectroscopic analysis of the selected population of cells.
Real-time data analysis for cell selection
A program operating on the Target PC is used to analyse the digitized data stream from the photomultiplier, recognize isolated bursts composed of sets of peaks due to the passage of cells through the of 532-nm photobleaching beams, make selection decisions based on photobleaching, program the DAQ card outputs using the calculated timing for cell selection, and count cells that pass through the monitor beam if this is used. With low priority, this program also transmits analysis results to the Host PC and adjusts its operating parameters upon command from the Host. The Host runs a separate interactive program that graphically presents analysis results received from the Target and allows parameters to be transmitted to the Target for update.
In the online supplemental material, Table T1 gives a flow diagram of the Target program. This identifies bursts of sequential peaks that do not overlap with peaks from other cells and it categorizes these bursts depending on if they were closely following or preceding peaks from other cells; selected for sorting; and contained a peak corresponding to passage through the monitor beam. Note that to avoid selection of the wrong cells, the program only attempts to select cells that give isolated bursts that do not closely follow peaks from prior cells. Supplemental Fig. S1 shows a screen shot of the Host program interface in which all 8 photobleaching beams and a monitor beam are used.
Solution and flow conditions
In typical operating conditions, the speed of HeLa cells through the 532-nm beams is ~6–8 mm/s. It is possible to operate about 3 times faster, which still gives enough time for dark-state relaxation between beams, although the camera frame rate then becomes too slow to follow cell selection. A faster flow rate not only speeds sorting, but it helps prevent cells sticking to the walls of the microfluidic device, particularly at the apex of the junction.
To reduce the HeLa cells sticking or settling in the reservoirs, OptiPrep™ (60% weight/volume iodixanol in water) is added to the buffer for the cells. The iodixanol increases the specific density to make the cells buoyant, but the refractive index of the solution also increases. Hence to maintain a difference between the refractive index of the medium and the cell, as needed to generate optical forces, the concentration of iodixanol is kept at ~8 % weight/volume, similar to that used in earlier work,19 resulting in a refractive index of 1.3479 (~1.36 for cells) and density of 1.049 g/cm3 (1.0357 g/cm3 for HeLa cells25).*
Results and discussion
Instrument operating conditions
Fig. 5 shows a series of images captured by the camera of a HeLa cell passing through the 8 photobleaching beams (1, 2), being selected by the 1064-nm beam (3, 4), and then passing towards the selection channel (5, 6) and through the monitor beam (7).
Fig. 5.
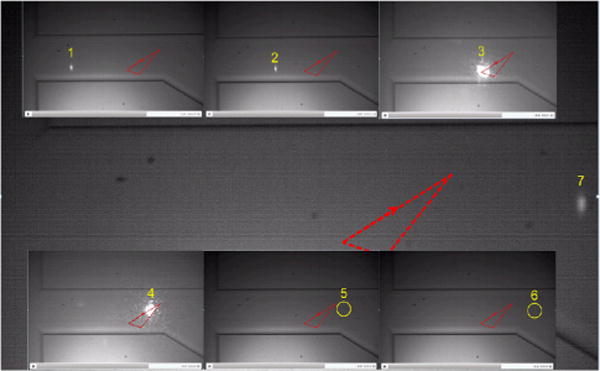
Series of images from a movie demonstrating cell selection.
The program only attempts to select cells that pass through the series of beams alone, without overlap between preceding or following cells. Although a greater number of 532-nm beams may provide better resolution of differences in irreversible photobleaching, there is an advantage to using fewer beams that span a smaller length of the microfluidic channel and to blocking the extra beam that is used to monitor cells passing into the sort channel—namely, the use of a smaller length of the flow channel reduces the overlapping of bursts from successive cells, which increases the effective rate at which cells may enter the sorter and be non-overlapping. In the approximation that cells enter at random times at a rate R, the time between cells is exponentially distributed with mean 1/R, so the probability that a cell does not overlap with the prior or following ones is e−2RT, where T is the passage time from the first to the last beam. The maximum rate of non-overlapping cells (labeled “Good” in Supplemental Fig. S1) is then RG = 1/(2Te) when R = 1/(2T). Both the rate of cells and their speed through the microfluidic device may be controlled by adjusting the pressures that drive the flow of the sample and the buffer streams. For the experiment of Supplemental Fig. S1, the time of passage from beam 1 to beam 8 (240 μm) is 30 ms, and from beam 1 to beam 9 (400 μm) is ~113 ms, hence the maximum rate at which cells may be selected is RG ≈ 1.6 s−1, or if the monitor beam and the check for successful switching are turned off, RG ≈ 6.1 s−1. The actual selection rate will be RG × the fraction of cells in the sample that have the desired photostability. As an indication of the fastest selection rate that can presently be expected, when the number of beams is reduced to 4 spread over ~100 μm and the speed is increased by a factor of 3, so that T = 4 ms, the maximum rate of selectable cells is RG = 46 s−1, which enables samples of ~105 cells with enhanced photostability to be obtained within a few hours. A further increase in sorting speed by ~10 while still maintaining the same flow speed needed to measure irreversible photobleaching could be attained by use of a separate detector for each 532-nm beam to allow analysis of signals from cells that overlap in their transits.
Cell selection efficiency and viability after selection
To optimize operating conditions, experiments evaluating the selection efficiency and subsequent cell viability as a function of buffer conditions and 1064-nm laser power were undertaken using HeLa-S cells, which are suitable for use in experiments for developing new RFPs. To promote cell viability, especially during sorting experiments lasting longer than an hour, cells were suspended in a solution of phenol-red-free Minimum Essential Medium (Invitrogen, 41061-029), with 10% Fetal Bovine Serum (Invitrogen), 14% Optiprep (Sigma-Aldrich), and 1% Penicillin Streptomycin (Invitrogen, Pen Strep). This medium was chosen instead of a low-nutrient buffer (e.g., Hepes-buffered Hank’s Balanced Salt Solution), as it was found to give increased cell viability over time. Also, a medium free of phenol-red pH indicator was chosen to decrease background fluorescence.
Selection experiments using 4 photobleaching beams and the monitor beam for assessing success were performed for various 1064-nm laser powers using either (i) the cell suspension medium described above, or (ii) a buffer solution composed of calcium-, magnesium-, phenol-red-free Hank’s Balanced Salt Solution (Invitrogen, 14175) with 1% Bovine Serum Albumin (Sigma-Aldrich, BSA) in the side channels (B of Fig. 2) used for hydrodynamic focusing. In these experiments, the speed of cells through the photobleaching beams was kept constant at 6 mm/sec. The sample cell concentration was diluted to ~250,000 cells/ml to decrease the rate R of cells entering the sorter and thereby decrease the probability of overlapping bursts and also increase the fidelity of the monitor beam for counting of successful selection events. For each power and fluid condition, 100 cells were assayed. As shown in Supplemental Fig. S2, the selection efficiency was found to be increased for the same 1064-nm laser power by using buffer in the side channels instead of media (possibly because the buffer contains no Optiprep and so leads to greater refractive index contrast and optical forces).
The viability for each 1064-nm laser power was then assessed for both solution conditions. In earlier work,19 mammalian cell viability was quantified by a trypan blue exclusion assay about 1 hour after exposure to the 1064-nm laser beam. However, this assay only accounts for immediate deterioration of the plasma membrane, and cannot identify cells in earlier stages of necrosis or apoptosis. To account for slower forms of cellular death, the cell viability was measured 24 hours after microfluidic analysis for both sorted and non-sorted cells using a Calcein-AM based assay.20 Calcein-AM (Invitrogen) was added directly to the cells (final concentration of 1 μM) within a 96-well plate and allowed to incubate at room temperature for 30 minutes. Calcein-AM becomes fluorescent upon hydrolysis of the acetoxymethyl moiety by intracellular esterases. In contrast, dead cells remain non-fluorescent, or very weakly fluorescent, and can be identified by comparison of fluorescence and differential interference contrast (DIC) images. Using this method, for higher laser exposure conditions, cell viability was found to be decreased after 24 hours relative to the same assay when performed immediately after microfluidic sorting. Also, the viability was lowered when buffer was used in the side channels. However, the viability for each 1064-nm laser power was found to be identical (~80%) when the selected cells were delivered into an on-chip reservoir pre-loaded with 750 μl of the running media to minimize the cells’ time spent in buffer to ~0.5 sec (approximate transit time from interrogation region to outlet). Furthermore, cells were capable of continued replication over the course of several weeks.
Cell selection based on irreversible photobleaching
To demonstrate the effectiveness of the instrument for selecting cells that have RFPs with lower irreversible photobleaching, experiments were performed using samples containing known mixtures of HeLa-S cells expressing either mCherry (25% of cells) or mOrange2 (75% of cells). In these tests, the instrument was configured to use 4 photobleaching beams and a monitor beam, with 0.09 W of power in each photobleaching beam (peak irradiance ~2×10⁴ W cm−2). The flow speed of cells through the beams was 6.0 mm s−1. As shown in Supplemental Fig. S3, the ratios of the peak amplitudes (beam 4/beam 1) are ~0.63 for cells with mCherry, and ~0.40 for cells with mOrange2, whereas in a separate experiment using fluorescently labelled beads (Invitrogen, F-8858 fluospheres, 4 μm, 580/605) the ratio is ~0.98. The operating parameters were adjusted to select mCherry cells with lower irreversible photobleaching from the mixture using a 1064-nm laser power of ~12 W. Over a duration of ~2.5 hours, 4000–5000 cells were selected. The purity of the selected sample was then determined by imaging it using a wide-field fluorescence microscope in which mCherry and mOrange2 cells are spectrally distinguished by use of a choice of appropriately chosen band-pass excitation filters (540/25 or 577/20). Supplemental Fig. S4 shows the spectra for these filters together with the excitation spectra of mCherry and mOrange2. As seen in Supplemental Fig. S5, the ratio of the fluorescence signals seen with each of these filters enables cells expressing mCherry or mOrange2 to be unequivocally distinguished. The purity of the selected sample was thus determined by counting the cells of either type in the image. As seen in Fig. 6, cells expressing RFPs with lower irreversible photobleaching (mCherry) are selected from the mixture with greater than 99% purity, which is considerably higher than that typically achieved in FACS and other prior reported microfluidic cell sorters.19
Fig. 6.
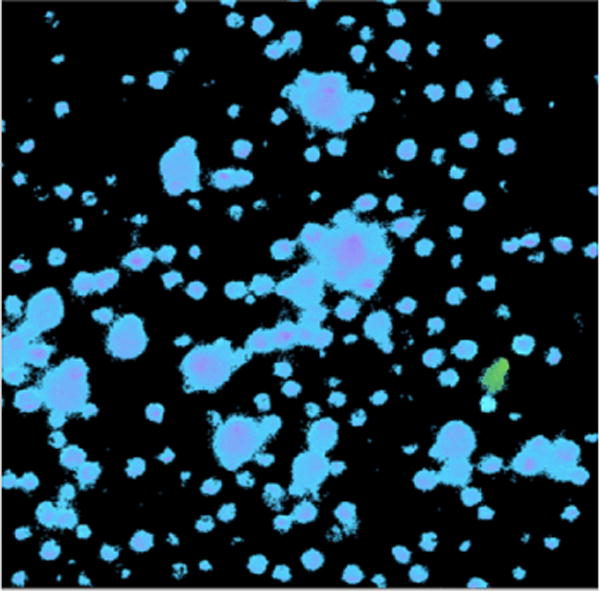
Representative image of collected cells. Blue/pink pseudo colour is for cells expressing mCherry; green pseudo colour represents mOrange2. Here, only one cell expressing mOrange2 is visible. Larger diameter objects are clusters of cells in close enough proximity that their edges aren’t resolvable. Measurements from sorts on other days gave mOrange2/total = 1/132, 1/99, 1/146, 3/543.
Conclusions
This paper reports a novel microfluidic cell sorter for live mammalian cells expressing red fluorescent proteins that enables selection of cells with proteins that have enhanced photostability. It uses the Real-Time module of LabView for analysis of multi-beam laser-induced fluorescence signals to determine irreversible photobleaching and to achieve sub-millisecond timing of the sweep of a 1064-nm laser spot to deflect individual selected cells by the optical gradient force to a separate collection channel. Suitable cell suspension media and laser operating conditions have been determined for efficiently selecting mammalian cells while maintaining their long-term viability and capability to proliferate. The effectiveness of the instrument has been demonstrated by selecting cells expressing a fluorescent protein with higher photostability (estimated 1.75 times lower photodestruction quantum efficiency) at a rate exceeding 0.5 s−1 from a sample containing a known mixture of cells expressing either mCherry (25%) or mOrange2 (75%). Subsequent analysis of the collected cells on the basis of differences in the fluorescence excitation and emission spectra of mCherry and mOrange2 found that >99% of the selected cells express mCherry, indicating a remarkably high purity in the selection. The sorter is being used in on-going research to develop new fluorescent proteins with improved photostability.
Supplementary Material
Acknowledgments
This work was supported by funding from the University of Colorado Molecular Biophysics Training Grant (T32 GM-065103), National Science Foundation (NSF) Computational Optical Sensing and Imaging Integrative Graduate Education and Research Traineeship (0801680), the NSF Physics Frontier Center at JILA, and the National Institutes of Health (GM083849 to AEP and R.J.). R.J. is a staff member in the Quantum Physics Division of the National Institute of Science and Technology (NIST). L.M.D. thanks NIST for support as a Visiting Fellow to JILA, support from NSF grant EPS-1004083, and UTSI for sabbatical and travel support. The authors thank Dr. Roger Tsien for providing TagRFP-T, mCherry, and mOrange2. Certain commercial equipment, instruments, or materials are identified in this paper in order to specify the experimental procedure adequately. Such identification is not intended to imply recommendation or endorsement by the NIST, nor is it intended to imply that the materials or equipment identified are necessarily the best available for the purpose.
Footnotes
Electronic Supplementary Information (ESI) available: Table S1, discussion, and Figures S1–S5.
An earlier version of the chip,7 with channels made by etching away a 25 μm layer of silicon anodically bonded to a glass substrate, suffered surface damage within channels that appeared to be due to absorption of 1064-nm light by silicon embedded within the glass.
Contributor Information
Lloyd M. Davis, Email: ldavis@utsi.edu.
Jennifer L. Lubbeck, Email: jennifer.lubbeck@colorado.edu.
Kevin M. Dean, Email: kevin.dean@colorado.edu.
Amy E. Palmer, Email: amy.palmer@colorado.edu.
Ralph Jimenez, Email: rjimenez@jila.colorado.edu.
Notes and references
- 1.Zimmer M. Chem Soc Rev. 2009;38:2823–2832. doi: 10.1039/b904023d. [DOI] [PubMed] [Google Scholar]
- 2.Ha T, Tinnefeld P. In: Annual Review of Physical Chemistry, Vol 63. Johnson MA, Martinez TJ, editors. Vol. 63. Annual Reviews; Palo Alto: 2012. pp. 595–617. [DOI] [PMC free article] [PubMed] [Google Scholar]
- 3.Subach FV, Piatkevich KD, Verkhusha VV. Nature methods. 2011;8:1019–1026. doi: 10.1038/nmeth.1776. [DOI] [PMC free article] [PubMed] [Google Scholar]
- 4.Harms GS, Cognet L, Lommerse PHM, Blab GA, Schmidt T. Biophys J. 2001;80:2396–2408. doi: 10.1016/S0006-3495(01)76209-1. [DOI] [PMC free article] [PubMed] [Google Scholar]
- 5.Dean KM, Lubbeck JL, Binder JK, Schwall LR, Jimenez R, Palmer AE. Biophys J. 2011;101:961–969. doi: 10.1016/j.bpj.2011.06.055. [DOI] [PMC free article] [PubMed] [Google Scholar]
- 6.Donnert G, Eggeling C, Hell SW. Nature methods. 2007;4:81–86. doi: 10.1038/nmeth986. [DOI] [PubMed] [Google Scholar]
- 7.Lubbeck JL, Dean KM, Ma HR, Palmer AE, Jimenez R. Anal Chem. 2012;84:3929–3937. doi: 10.1021/ac202825z. [DOI] [PMC free article] [PubMed] [Google Scholar]
- 8.Li PCH, Harrison DJ. Anal Chem. 1997;69:1564–1568. doi: 10.1021/ac9606564. [DOI] [PubMed] [Google Scholar]
- 9.Fu AY, Spence C, Scherer A, Arnold FH, Quake SR. Nat Biotechnol. 1999;17:1109–1111. doi: 10.1038/15095. [DOI] [PubMed] [Google Scholar]
- 10.Kiermer V. Nature methods. 2005;2:91–91. doi: 10.1038/nmeth1005-730a. [DOI] [PubMed] [Google Scholar]
- 11.Franke T, Braunmuller S, Schmid L, Wixforth A, Weitz DA. Lab on a chip. 2010;10:789–794. doi: 10.1039/b915522h. [DOI] [PubMed] [Google Scholar]
- 12.Patel MV, Tovar AR, Lee AP. Lab on a chip. 2012;12:139–145. doi: 10.1039/c1lc20626e. [DOI] [PubMed] [Google Scholar]
- 13.Cho SH, Chen CH, Tsai FS, Godin JM, Lo YH. Lab on a chip. 2010;10:1567–1573. doi: 10.1039/c000136h. [DOI] [PMC free article] [PubMed] [Google Scholar]
- 14.Wu TH, Chen Y, Park SY, Hong J, Teslaa T, Zhong JF, Di Carlo D, Teitell MA, Chiou PY. Lab on a chip. 2012;12:1378–1383. doi: 10.1039/c2lc21084c. [DOI] [PMC free article] [PubMed] [Google Scholar]
- 15.Ashkin A, Dziedzic JM, Yamane T. Nature. 1987;330:769–771. doi: 10.1038/330769a0. [DOI] [PubMed] [Google Scholar]
- 16.Applegate RW, Squier J, Vestad T, Oakey J, Marr DWM. Optics Express. 2004;12:4390–4398. doi: 10.1364/opex.12.004390. [DOI] [PubMed] [Google Scholar]
- 17.Hoi SK, Udalagama C, Sow CH, Watt F, Bettiol AA. Applied Physics B-Lasers and Optics. 2009;97:859–865. [Google Scholar]
- 18.Wang XL, Chen SX, Kong M, Wang ZK, Costa KD, Li RA, Sun D. Lab on a chip. 2011;11:3656–3662. doi: 10.1039/c1lc20653b. [DOI] [PubMed] [Google Scholar]
- 19.Wang MM, Tu E, Raymond DE, Yang JM, Zhang HC, Hagen N, Dees B, Mercer EM, Forster AH, Kariv I, Marchand PJ, Butler WF. Nat Biotechnol. 2005;23:83–87. doi: 10.1038/nbt1050. [DOI] [PubMed] [Google Scholar]
- 20.Perroud TD, Kaiser JN, Sy JC, Lane TW, Branda CS, Singh AK, Patel KD. Anal Chem. 2008;80:6365–6372. doi: 10.1021/ac8007779. [DOI] [PubMed] [Google Scholar]
- 21.Shaner NC, Lin MZ, McKeown MR, Steinbach PA, Hazelwood KL, Davidson MW, Tsien RY. Nature methods. 2008;5:545–551. doi: 10.1038/nmeth.1209. [DOI] [PMC free article] [PubMed] [Google Scholar]
- 22.Goedhart J, van Weeren L, Hink MA, Vischer NOE, Jalink K, Gadella TWJ. Nature methods. 2010;7:137–U174. doi: 10.1038/nmeth.1415. [DOI] [PubMed] [Google Scholar]
- 23.Lubbeck JL, Dean KM, Davis LM, Palmer AE, Jimenez R. Biophys J. 2012;102:208a–209a. [Google Scholar]
- 24.Mio C, Gong T, Terray A, Marr DWM. Review of Scientific Instruments. 2000;71:2196–2200. [Google Scholar]
- 25.Czerlinski GH, Reid DS, Apostol A, Bauer KD, Scarpelli DG. J Biol Phys. 1987;15:29–32. [Google Scholar]
Associated Data
This section collects any data citations, data availability statements, or supplementary materials included in this article.