Abstract
Advanced micrometeorological methods have become increasingly important in soil, crop, and environmental sciences. For many scientists without formal training in atmospheric science, these techniques are relatively inaccessible. Surface renewal and other flux measurement methods require an understanding of boundary layer meteorology and extensive training in instrumentation and multiple data management programs. To improve accessibility of these techniques, we describe the underlying theory of surface renewal measurements, demonstrate how to set up a field station for surface renewal with eddy covariance calibration, and utilize our open-source turnkey data logger program to perform flux data acquisition and processing. The new turnkey program returns to the user a simple data table with the corrected fluxes and quality control parameters, and eliminates the need for researchers to shuttle between multiple processing programs to obtain the final flux data. An example of data generated from these measurements demonstrates how crop water use is measured with this technique. The output information is useful to growers for making irrigation decisions in a variety of agricultural ecosystems. These stations are currently deployed in numerous field experiments by researchers in our group and the California Department of Water Resources in the following crops: rice, wine and raisin grape vineyards, alfalfa, almond, walnut, peach, lemon, avocado, and corn.
Keywords: Environmental Sciences, Issue 82, Conservation of Natural Resources, Engineering, Agriculture, plants, energy balance, irrigated agriculture, flux data, evapotranspiration, agrometeorology
Introduction
Water scarcity threatens agricultural sustainability in dry growing regions. This situation will likely worsen with changing climatic conditions and increasing competition between agricultural, municipal, industrial, and conservation entities for limited water supplies. To deal with this ongoing dilemma, growers continually search for ways to improve irrigation efficiency, and technology that better estimates crop water use (i.e. evapotranspiration, ET) in real time, and better agrometeorological methods will certainly help these efforts. Current technologies used by growers to estimate ET depend on the use of reference evapotranspiration (ET0) and an empirical crop coefficient (Kc), both of which are highly susceptible to estimation errors. Agrometeorologists also measure ET to evaluate experimental treatments for improving crop water use efficiency1 and to parameterize regional water allocation strategies2, but these methods are highly technical and expensive. Efforts are currently underway to translate existing research-based ET measurement methods into cost-effective and user-friendly technologies for growers.
Surface renewal (SR) is one agrometeorological method used to measure crop ET. SR is based on analyzing the energy budget of air parcels that reside ephemerally within the crop canopy during the turbulent exchange process3 as measured with the station shown in Figure 1 and illustrated theoretically in Figure 2 and Movie 1. The air parcels are manifested as ramp-like shapes in turbulent temperature time series data, and the amplitude and period of the ramps are used to calculate the flux density (Figures 2 and 3). With the SR method, ET for a given crop surface is determined by calculating latent heat flux density (LE) as the residual of the following energy balance equation LE=Rn-G-H,
Here, LE is the energy flux density associated with the phase change of water from a crop surface, Rn is the net radiation, G is the soil heat flux density (i.e. energy conducted into or out of the ground), and H is the sensible heat flux density (i.e. energy flux density from the surface to the air or vice-versa that results in a temperature change). Rn is a positive number when the net flux is downward (energy added to the surface), LE and H are positive numbers when the flux is upwards (energy added to the air), and G is a positive number when the flux is downward (energy added to the soil). LE (MJ/m2sec) is then divided by the latent heat of evaporation (L=2.45 MJ/kg) to obtain the mass flux density of water vapor from the surface (i.e. ET).
Measurements of Rn and G are relatively straightforward and inexpensive. Direct measurements of H are more complex and require high frequency data acquisition. The most common method to determine H is with eddy covariance; however, the sonic anemometer required for this method is expensive, complex and, consequently, not widely used by agronomists, horticulturalists, or engineers to determine H and LE. On the other hand, H derived from the SR technique is obtained by a simpler and less expensive method, which uses fine wire thermocouples to measure high frequency air temperatures at the surface-atmosphere interface. Despite the simplicity of the SR, current measurements still require calibration against a sonic anemometer's eddy covariance estimate of H to obtain sensible heat flux density.
The successful deployment of an SR flux tower for ET measurements can be a daunting challenge, especially for many agricultural researchers without formal training in atmospheric science. SR and eddy covariance measurements require sophisticated technical skills in both programming data loggers to execute tasks with complex instrumentation and writing computer programs to post-process the raw turbulence data into meaningful fluxes. Here, we describe how to setup a field station, install sensors, and utilize our new turnkey data logger program for data collection and post-processing procedures.
Protocol
- Perform a wind direction and footprint analysis prior to field installation; this step is important to insure that the tower is situated properly to capture the representative flux in the study field.
- Before establishing the field station, you must evaluate the prevailing wind direction in the study plot, and determine how much fetch (upwind distance) is needed for your particular application. The distance of the fetch is dependent on the height of the surface to be measured and the height of the instruments4. Generally, the fetch is 100 meters downwind for each meter above the midpoint of the canopy that the sensors are located.
- Based on the needs of the specific setup, attach sensors to the data logger and prepare as much of the equipment as possible prior to heading to the field. Install the program in the logger prior to field deployment and test that the logger is properly functioning using the steps described below.
- Connect a laptop to data logger using the RS-232 cable port (not isolated) on the front of the datalogger, open the interface program to communicate with the data logger, and connect to the data logger. Then upload the turnkey data logger program to the data logger. USB standard cables and cellular telephones can also be used for communicating with the datalogger.
- The program is written for a specific suite of instruments, namely a 3-D sonic anemometer, two heat flux plates, a soil thermocouple, a fine-wire air thermocouple, and a net radiometer. One can adapt the program for other sensor configurations, but the user should carefully field test the logger program after any modifications. If many new lines of complex code are added to the program, then it may not function properly; especially when the sonic anemometer is sampled in serial rather than analog mode. The program is available for download at: <sites.google.com/site/tmshapland>.
- Check data values for all sensors to see whether everything is working correctly.
- Note: If any of these variables are producing 'NAN' on the status table of the logger interface program, then the corresponding sensor and its connection to the logger needs to be checked. After making the necessary corrections, return to the computer and make sure that the signal is no longer producing 'NAN'.
- The setup described below is for a SR system with one fine wire thermocouple, and wiring is described to match with the data logger commands embedded in the turnkey program described below.
- Once an appropriate position is identified for your station in the study field, set up the tower (CM6- Figure 1). Stabilize the feet of the tower using the provided stakes, pound the long copper grounding rod into the soil with a mini-sledgehammer in a location that will not interfere with the for soil heat flux plates- see below), and connect the grounding rod to the tower using the thick gauge wire and provided connectors.
- Attach the data logger enclosure to the main axis of the tower using the u-bolts provided by the manufacturer (Figure 1).
- Install the two soil heat flux plates (i.e. G1 and G2) with white dot up at a depth of 5 cm in the interrow space away from drip irrigation emitters (Figure 4). Installation should ensure good thermal contact with the soil and extension wires leading back to the datalogger should be buried to avoid damage by being ripped out of the soil.
- Connect the heat flux plate wires to data logger channels 3 and 4 as differential input sensors (G1: black wire 3H, red wire 3L - and G2: black wire 4H, red wire 4L). The codes listed in this document match the labels for the data logger channels and will be used throughout the rest of the manuscript. Details for all sensors are listed in Table 1.
- Note: The thermopile inside the ground heat flux plate measures the temperature gradient across a material with known thermal properties to arrive at the energy flux density. Each plate is calibrated by the manufacturer. Because ground heat flux plates cannot be placed directly on top of the soil without intercepting solar radiation, they must be buried below the soil surface. The energy flux density at the depth of the ground heat flux plates is not the same at the energy flux density at the surface because some energy is stored in the soil layer above the plate, so a set of soil temperature sensors wired in parallel are installed in the layer above the plates.
- Install the soil thermocouple (1 cable with 4 probes wired in parallel, named Ts) to span the volume of soil above the ground heat flux plate to account for the change in heat storage above the plates (Figure 4).
- Connect the soil thermocouple to datalogger on channel 5 as differential sensor (Ts: purple wire 5H, red wire 5L).
- Note: The soil layer temperature is measured by inserting soil temperature probes at an angle from near the bottom to near the top of the soil layer (roughly about 0.04-0.01 m below the soil surface). It is important that the temperature probes are not inserted too close to the surface. If the soil cracks, radiation and/or sensible heat flux to or from the sensors can cause false data. Generally, it is best to not place the temperature sensors any closer than 0.01 m from the soil surface; and deeper placement is needed in soils that have large cracks due to soil drying5.
- Install the net radiometer (named Rn-Figure 5) on the cross arm boom above the canopy and pointing south.
- Connect the net radiometer to data logger on channel 2 as differential sensor (Rn: white wire 2H, green wire 2L, shield (bare) signal ground)
- Install the fine wire thermocouple (named TC1- Figure 6) at one end of the cross arm and above the canopy (height will depend on the plants growing in a particular field and the required fetch); air temperature will be sampled at 10 Hz. Thermocouples used for these measurements are typically 76 μm diameter.
- Connect the fine wire thermocouple to data logger on channel 1 as a differential sensor where the purple wire goes to 1H, red wire to 1L, clear wire to signal ground.
- Note: See details below on maintenance of the thermocouple once the system is up and running.
- Install the sonic anemometer (Figure 7) at the other end of the cross arm (i.e. opposite the fine wire thermocouple) using the Nu-rail joint fitting to measure three-dimensional wind velocities and sonic temperature at 10 Hz for calculating the eddy covariance sensible heat flux. Install the sonic anemometer so the center of the measurement area is located at the same height as the fine wire thermocouple.
- Note: the sonic anemometer requires reconfiguration from the factory settings prior to field deployment to output the desired signals (For more information, see RM Young Model 81000RE Reconfiguration Instructions.pdf available at sites.google.com/site/tmshapland).
- The uncalibrated sensible heat flux density obtained by surface renewal analysis is then calibrated by determining the slope of the least squares linear regression of the eddy covariance versus SR sensible heat flux density.
- Attach the power supply to the data logger.
- Connect a laptop to the data logger using the RS-232 cable port (not isolated) on the front of the data logger. Upload the turnkey data logger program if this step has not already been performed in the laboratory.
- The program is written for a specific suite of instruments, namely a sonic anemometer, two heat flux plates, a soil thermocouple, a fine-wire air thermocouple, and a net radiometer. One can adapt the program for other sensor configurations, but the user should carefully field test the logger program after any modifications. If many new lines of complex code are added to the program, then it may not function properly; especially when the sonic anemometer is sampled in serial rather than analog mode. The program is available for download at: sites.google.com/site/tmshapland. Further details on the program and its use can be found in our recent publication6.
- Check data values for all sensors to see whether everything is working correctly.
- Note: If any of these variables are producing 'NAN' on the status table of the logger interface program, then the corresponding sensor needs to be checked or replaced. Upon making adjustments to the sensor or its wiring, return to the computer and make sure the signal is no longer producing a 'NAN'.
- Maintain the station using the following steps once the station is functional.
- Unscrew the Nu-Rail joint and lower the main vertical mast that holds the net radiometer.
- Bend the insulated thermocouple wire at its junction with the metal cylinder. Carefully dip the exposed thermocouple wires (i.e. the very tip of the thermocouple) into the lemon juice, making sure not to hit the exposed wires against the jar. Clean off the lemon juice from the sensor by dipping the wires into the jar of deionized (DI) water. Restraighten the thermocouple wire at its junction with the metal cylinder.
- Spray the net radiometer with DI water. Dry it with absorbent wipes. Raise the vertical mast up to its original position, retighten the Nu-Rail set screws, and level the net radiometer.
- Take photographs of the tower to record any changes in the plant canopy over time.
- Process the collected energy balance flux data; the output table from the turnkey data logger program contains the already transformed Rn, G, H, and LE. See our recent work for more details on the turnkey data logger program output6,7.
Representative Results
Acquiring the Rn and G components of the energy balance equation are relatively straightforward and inexpensive. Measurements of H are more complex and require high frequency temperature traces measured with a fine wire thermocouple for surface renewal or a sonic anemometer for eddy covariance. An example temperature trace measured with a fine wire thermocouple is represented in Figure 9, and it shows the need for mathematical analysis to extract the signal from this raw data (see details of the analysis in 3,8-13). Visual inspection of this data reveals three or four primary ramps ending at approximately 12, 35, 46, and 72 sec (Figure 9).
All of the energy balance components follow a similar diurnal pattern with peak values occurring in the middle of the day. Rn is positive during the day as the surface receives more radiation than it loses, and negative at night as the surface loses more radiation than it receives, exhibiting the diurnal curve expected for sunny springtime days in northern California (Figure 10). G also follows a diurnal pattern (Figure 10) it is positive during the day as energy is conducted from the surface into the ground, and negative at night as more energy is conducted from below to the cooler surface. The diurnal pattern in G is generally smooth except for small deviations likely resulting from sunflecks impinging directly over the ground heat flux plates. LE follows the expected diurnal curve over a crop with adequate water during fair weather (Figure 10). Rn is the dominant energy source for ET, so the LE values track the changes in Rn during the daytime. Over an actively transpiring crop, it is expected that the majority of the available energy during positive Rn conditions is partitioned into LE rather than H and G. During windy nights (i.e., days 110, 113, and 114 in Figure 10), LE was near zero, whereas it was negative during calm nights, possibly indicating condensation (Figure 10). Nevertheless, the daytime contribution to LE greatly outweighs the nighttime contribution, so uncertainties in nighttime values are interesting but relatively unimportant.
The daily cumulative ET values agree well for the SR station and a weighing lysimeter situated side by side in a field of wheat (Figure 11) weighing lysimeters are considered a gold standard for ET estimates from crop surfaces. On most days, the cumulative ET from the SR station was slightly higher than values from the lysimeter. Tower measurements represent fluxes from a broader area than the lysimeter measurements, and at the time of these measurements the wheat in the lysimeter was ~10 cm shorter and less dense than the plants in remainder of the field, so higher ET values from the flux tower were expected.
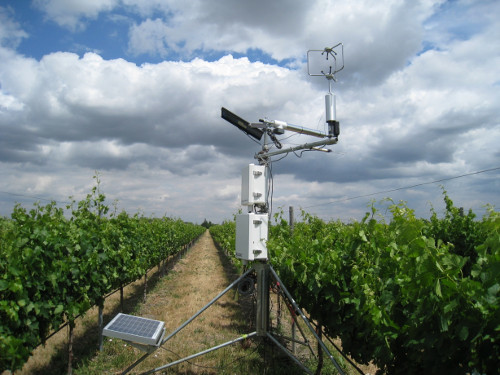 Figure 1.
Solar powered field station established in a vineyard in California to measure surface renewal with a sonic anemometer for calibration using eddy covariance.
 Figure 2. Theoretical representation of surface renewal describing how air parcels interact with a plant canopy surface. The air parcels are assumed to be the same height as the canopy. After an air parcel comes in contact with a surface 'a', the parcel experiences a quiescent period, where little energy exchange occurs and is reflected by minimal temperature change with time 'e'. Eventually, the parcel exchanges energy and mass with the surface and, in this period, the parcel heats up as indicated by the red color in 'b' as captured by temperature measured with fine wire thermocouples 'f'. A new, cool parcel of air will sweep in and force the warmer air parcel to eject out from the surface 'c'. This action is captured as a sharp decline in the temperature trace 'g' as the cool air parcel replaces the warmer one. The cycle then continues to repeat itself (d and h).
Movie 1. Animation of the wind interacting with a plant canopy that was generated using a Large-Eddy Simulation model (created by Li Fitzmaurice and KT Paw U). Top panel is represents the view from the side of the canopy and the bottom panel represents the view looking down on the canopy. Click here to view movie.
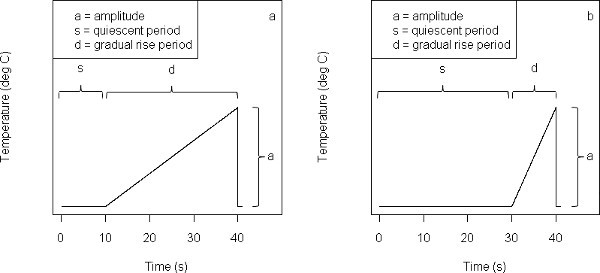 Figure 3. Theoretical representation of air temperature trace capturing the sensible heat flux portion of surface renewal. The Van Atta procedure8 is used to resolve the ramp amplitude and ramp period from the air temperature data for the surface renewal calculation details of the mathematics used to extract this signal from real data is described in3,11-13.
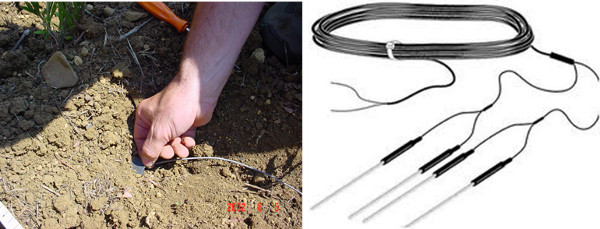 Figure 4. Instrumentation needed to measure soil heat flux (G). On the left, a soil heat flux plate is being inserted at a depth 0.05 m. The soil thermocouples, on the right, are inserted at an angle from about 0.04-0.01 m depth where the cable end is at the deeper depth. The thermocouples measure the temperature change from the beginning to the end of the sampling period (30 min).
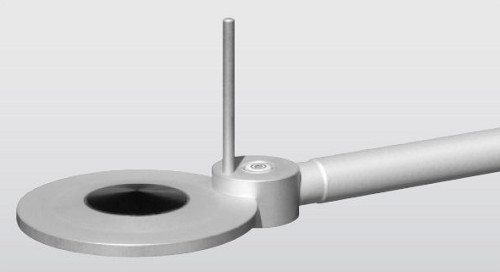 Figure 5. Net radiometer used for Rn measurements in the surface renewal system. The leveling bubble is apparent in this image.
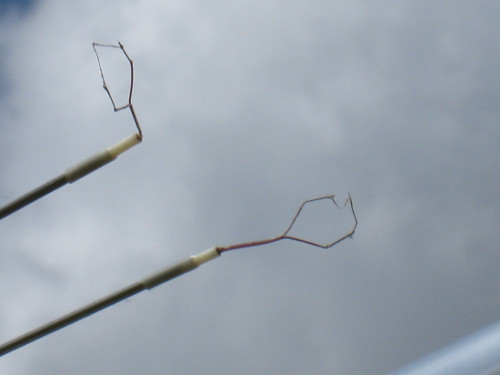 Figure 6.
Fine wire chromel-constantan thermocouples (13 μm diameter) used for sensible heat measurements (H) in the surface renewal system.
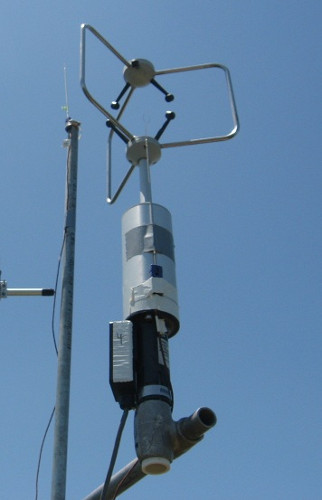 Figure 7. Sonic anemometer used for eddy covariance measurements to calibrate surface renewal. Instrument shown here is installed on a tower over a bare soil surface.
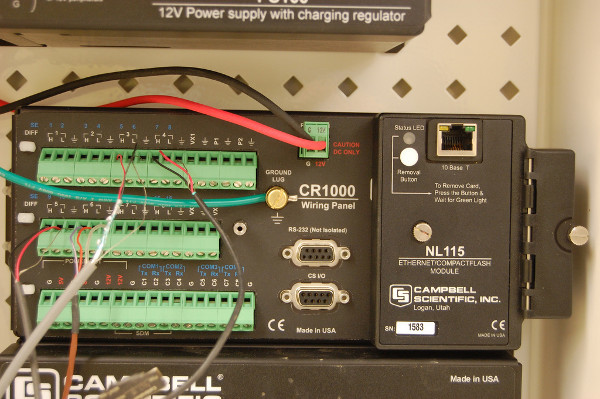 Figure 8. Data logger with the compact flash module (right hand side of image) used for the SR system. See Table 1 for wire details for all sensors. Click here to view larger figure.
 Figure 9. Plot of air temperature captured with a fine wire thermocouple. Compare actual data to the theoretical data (presented in Figures 2 and 3) demonstrating the need for mathematical solutions to extract the ramp signals from these traces. See details in12,13. Click here to view larger figure.
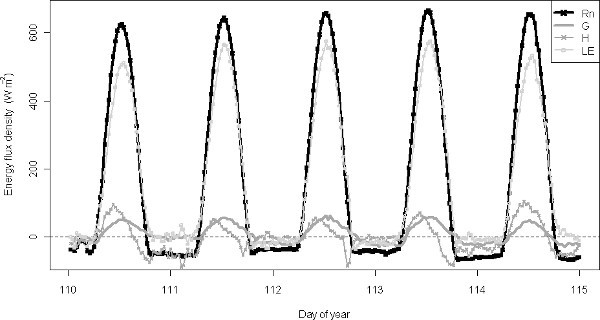 Figure 10. Energy balance outputs (net radiation, Rn; ground heat flux, G; sensible heat flux, H; and latent heat flux, LE) measured over five days. Data taken from6. Click here to view larger figure.
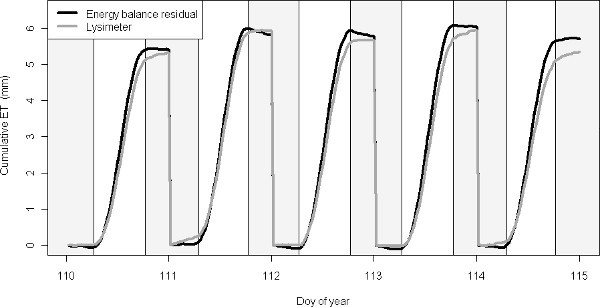 Figure 11. Cumulative daily evapotranspiration measured by the SR flux tower and a weighing lysimeter in a wheat field. Data taken from6. Click here to view larger figure.
 Figure 12. Captured window image from Surface Renewal/Eddy Covariance Facebook page established to capture web based resources in a single location. Click here to view larger figure.
| Sensor | Sensor wire color or Port | Datalogger channel or Port |
| Air thermocouple | Purple | 1H |
| Red | 1L | |
| Clear | Signal ground | |
| Net radiometer | White | 2H |
| Green | 2L | |
| Shield (bare) | Signal ground | |
| Jumper wire | 2L to Signal ground | |
| Ground heat flux plate | Black | 3H |
| Red | 3L | |
| Shield (bare) | Signal ground | |
| Ground heat flux plate | Black | 4H |
| Red | 4L | |
| Shield (bare) | Signal ground | |
| Soil thermocouple | Purple | 5H |
| Red | 5L | |
| Shield (bare) | Signal ground | |
| Sonic anemometer | RX | C7 |
| TX | C8 | |
| Serial reference | G | |
| +PWR | 12V | |
| PWR reference | G | |
| Earth ground | G |
Table 1. Sensor wiring details for a dual setup of SR and Eddy Covariance.
Discussion
The surface renewal method presents a tangible opportunity to develop a stand-alone and inexpensive technique to quantify crop water use in real time. Recent advances in signal processing, data logger programming, calibration, and data management have brought this goal into clearer focus. This manuscript and our recently developed turnkey data logger program6 render advanced micrometeorological methods more accessible for agricultural researchers. The output table from the turnkey data program that contains the energy balance terms and the diagnostics variables can be downloaded using a remote or direct connection, adding significant convenience for program users during site visits. We anticipate future releases of updated versions of the program as this is an ongoing project in our research efforts (stay tuned at the Surface Renewal Eddy Covariance Facebook page Figure 12).
In its current state, SR still requires calibration by eddy covariance, which involves the use of expensive and highly technical sonic anemometers. SR can only become a stand-alone technique by the elimination of this calibration. We are currently focused on solving this problem and hope to advance SR as a self-calibrated technique in the near future.
The fine wire thermocouple used for SR analysis presents a few problems for ease of use of this method under field conditions. Spider webs growing on the thermocouple, or nearby plant shoots, can cause the measuring junction to break particularly in windy conditions. Regular cleaning of the thermocouple is needed to alleviate this problem. The net radiometer surfaces also require regular cleaning, particularly at field sites with many birds. The current tower setup is also quite bulky and for some growing situations (e.g. vineyards) its positioning within an interrow blocks the passage of tractors and other equipment. Tractor passes through adjacent rows (particularly the row just south of the station) can also damage sensors, and in some situations equipment needs to be partially removed prior to this grower practice. We recommend that scientists visit the site and maintain the instruments weekly or biweekly.
Current technologies for data acquisition and storage have exhibited important flaws that limit the potential of SR. For instance, data loss can occur when memory cards become corrupted. Also, the data logger software is rigid and requires complex programming to be adapted to SR. User friendly data acquisition devices built specifically for SR would drastically improve performance of the system.
Disclosures
The authors declare that they have no current competing financial interests.
Acknowledgments
Partial support for this research was provided by J. Lohr Vineyards & Wines, the National Grape and Wine Institute, a NIFA Specialty Crops Research Initiative grant to AJM, and USDA-ARS CRIS funding (Research Project #5306-21220-004-00).
References
- Moratiel R, Martínez-Cob A. Evapotranspiration of table grape trained to a gable trellis system under netting and black plastic mulching. Irrigation Science. 2011;30(3):167–178. [Google Scholar]
- DWR (Department of Water Resources) California Water Plan Update, Bulletin 160-05. Sacramento, CA, U.S.A: California Department of Water Resources; 2005. [Google Scholar]
- Snyder RL, Spano D, Duce P, Paw UKT, Qiu J, Su HB, Watanabe T, Brunet Y. Surface renewal analysis: a new method to obtain scalar fluxes without velocity data. Agric. For. Meteorol. 1995;74:119–137. [Google Scholar]
- Rosenberg NJ, Blad BL, Verma SB. Microclimate: the biological environment. 2nd. New York, NY. USA: John Wiley and Sons; 1983. [Google Scholar]
- Snyder RL, Spano D, Duce P, Paw UKT, Anderson FE, Falk M. Surface Renewal Manual. 2007.
- Shapland TM, McElrone AJ, Paw UTK, Snyder RL. A turnkey data logger program for field-scale energy flux density measurements using eddy covariance and surface. Ital. J. Agrometeorol. Forthcoming.
- Shapland TM, Snyder RL, Paw UKT, Lang D, McElrone AJ. New tools to improve access to micrometeorological methods for agricultural research scientists. Annual Meeting of the American Society of Agronomy.2011. [Google Scholar]
- Van Atta CW. Effect of coherent structures on structure functions of temperature in the atmospheric boundary layer. Arch. of Mech. 1977;29:161–171. [Google Scholar]
- Snyder RL, Spano D, Paw UKT. Surface Renewal analysis for sensible and latent heat flux density. Boundary-Layer Meteorol. 1996;77:249–266. [Google Scholar]
- Spano D, Duce P, Snyder RL, Paw UKT. Surface renewal estimates of evapotranspiration. Tall canopies. Acta Hort. 1997;449:63–68. [Google Scholar]
- Spano D, Snyder RL, Duce P, Paw UKT. Surface renewal analysis for sensible heat flux density using structure functions. Agric. For. Meteorol. 1997;86:259–271. [Google Scholar]
- Shapland TM, McElrone AJ, Snyder RL, Paw UKT. Structure function analysis of two-scale scalar ramps. Part I: Theory and modeling. Boundary Layer Meterology. 2012.
- Shapland TM, McElrone AJ, Snyder RL, Paw UKT. Structure function analysis of two-scale scalar ramps. Part II: Applications. Boundary Layer Meterology. 2012.


