

Abstract
Background: Adapting to extreme heat is becoming more critical as our climate changes. Previous research reveals that very few communities in the United States have programs to sufficiently prevent health problems during hot weather.
Objective: Our goal was to examine county-level local heat preparedness and response in 30 U.S. states following the unusually hot summer of 2011.
Methods: Using a multimodal survey approach, we invited local health and emergency response departments from 586 counties to participate in the largest survey to date of heat preparedness and response in the United States. County-level responses were pooled into national and regional-level summaries. Logistic regressions modeled associations between heat planning/response and county characteristics, including population, poverty rates, typical summer weather, and 2011 summer weather.
Results: Of 586 counties, 190 (32%) responded to the survey. Only 40% of these counties had existing heat plans. The most common heat responses were communication about heat, outreach, and collaborations with other organizations. Both heat preparedness and heat response were, on average, more extensive in counties with higher populations, lower poverty rates, and lower percentages of older people. Heat response was generally more extensive in counties with heat plans.
Conclusions: Most responding counties were underprepared for extreme heat in 2011 and lacked a formal response plan. Because counties with heat plans were more likely to act to prevent adverse heat impacts to residents, local health departments should consider adopting such plans, especially because increased extreme heat is anticipated with further climate change.
Citation: White-Newsome JL, Ekwurzel B, Baer-Schultz M, Ebi KL, O’Neill MS, Anderson GB. 2014. Survey of county-level heat preparedness and response to the 2011 summer heat in 30 U.S. States. Environ Health Perspect 122:573–579; http://dx.doi.org/10.1289/ehp.1306693
Introduction
The 2011 summer was the second warmest on record in the continental United States, and 41 states of the lower 48 had an above-normal, much-above-normal, or record warmest July [National Oceanic and Atmospheric Administration (NOAA) 2011, 2012a]. Such extreme heat can harm human health and increase risk of heat stroke (Bouchama and Knochel 2002) and more common health problems such as respiratory and cardiovascular hospitalizations and deaths (Anderson et al. 2013; Hoshiko et al. 2010; Jones et al. 1982; Naughton et al. 2002; Weisskopf et al. 2002). Heat-related health impacts can be especially severe for certain groups including those living in urban areas (Fischer et. al 2012) and areas with low air conditioning prevalence (O’Neill et al. 2005) and for those who are isolated, of lower socioeconomic background (Hajat and Kosatky 2010), elderly, or belonging to some specific ethnic groups (White-Newsome et. al 2009). These heat-related health impacts vary by region (McGeehin and Mirabelli 2001) and community (Anderson et al. 2013) and can change over time (Davis et al. 2003). To save more lives, increased capacity to deal with current and future heat-related health threats is needed (Hess et al. 2012).
Monitoring and evaluation of heat preparedness and response can help policy makers set priorities and refine strategies (Huang et al. 2011), but little is known about local heat preparations and responses on a national scale in the United States. Studies on local heat preparedness and response have identified heat-planning activities that include crafting heat emergency plans (Bernard and McGeehin 2004), increasing communication about heat-coping strategies (Meehan et al. 1998; Weisskopf et al. 2002), and using heatwave early warning systems that alert local populations of health-threatening weather conditions (Kalkstein et al. 1996).
Previous U.S. surveys of environmental health directors and other local officials asked about perceptions of climate-related health risks and existing barriers to responding and planning for heat waves (see Supplemental Material, Table S1). Local health officials in California felt that climate change posed a large risk to public health, but lack of information and resources to manage the risks, and lack of coordination among different agencies, remained major challenges in preparing and responding to climate change (Bedsworth 2009). Other surveys revealed that climate change was not a top priority [Environmental Defense Fund (EDF) 2008], and new partnerships and financial resources were needed to support local actions (O’Neill et al. 2010).
To increase the knowledge of broad patterns in local heat preparedness and response to extreme heat in the United States, we conducted a survey of 586 counties within 30 U.S. states (the District of Columbia is included in this number) soon after the extremely hot summer of 2011.
Methods
State and survey population selection. States were selected based on either record-breaking or -tying temperatures during the summer of 2011 based on the National Climatic Data Center’s U.S. record temperature database (Alaska, Arkansas, Colorado, Connecticut, District of Columbia, Iowa, Kansas, Maryland, Missouri, Montana, New Hampshire, New Jersey, New Mexico, Oklahoma, Pennsylvania, Texas, Vermont, Wisconsin, West Virginia) (NOAA 2012b), membership in the Center for Disease Control and Prevention Climate Resilient States and Cities Initiative (Arizona, California, Maine, Michigan, Minnesota, North Carolina, New York, Oregon) [Centers for Disease Control and Prevention (CDC) 2012], or previous experience of a significant heat wave (Illinois, Indiana, Ohio) (CDC 2000, 2003). The survey was limited to these 30 states because of time and resource constraints and challenges in identifying appropriate personnel.
Within the surveyed states (see Supplemental Material, Figure S1), we used Internet searches and phone calls to identify the most knowledgeable contact at each local health division, based on the state governance structure. We contacted county health departments and the health department in the most populous city in each of the survey states. Where possible, at least three contacts were identified with a title or role related to health officer, public health officer, emergency preparedness coordinator, and/or administrative assistant. Once all local health department contact information was compiled, 20 health divisions were randomly selected from each state to receive a survey, along with the most populous city.
Developing the adaptation survey. A 38-question survey was developed by reviewing previous climate change and public health surveys and incorporating best survey practices identified from publications (Dillman et al. 2009) and a professional survey developer (JSI Research and Training Institute; http://www.jsi.com/JSIInternet/). The survey comprised multiple-choice and open-ended questions that addressed geographic boundaries, the general budget for the department, and whether specific policies and procedures were in place for extreme weather events, with an emphasis on heat. We also asked about heat-related preparation (existence of heat plans and heat definitions in 2011) and heat-related response for nine broad categories detailed in the statistical analysis section.
To ensure that survey questions and choices for responses were appropriate, these were pretested with local public health department officials and public health practitioners outside the anticipated survey pool. Of 13 requests, pretest feedback was received from five practitioners. The final survey tool was prepared using Survey Monkey (web-based survey tool; http://www.surveymonkey.com/), but was also available in paper format. The full survey can be found online (Union of Concerned Scientists 2011).
Survey deployment. The final survey was deployed in October 2011 to the randomly selected health departments via email, mail, and fax. JSI Research and Training Institute, an independent health research firm, handled survey deployment and response management. We used a three-tier survey approach to get as many responses as possible from agencies representing each county. We first surveyed local public health departments (LHDs) using our original long-survey form. After three reminders, the nonrespondent LHDs were sent a truncated version of the survey that asked four main questions from the original survey: “Do you have a heat plan?” “If you do have a heat plan, how long has it been in place?” “How did you protect your community during the heat event?” “Would you complete the longer survey?” For those LHDs that did not respond to the long or short version of the survey, the original long survey was sent to county emergency response agencies and/or personnel. We followed up with the same short survey for nonrespondent emergency response personnel as well.
A total of 586 counties were invited to participate. Multiple respondents were invited within some counties, often because of delay by initial contact, resulting in eventual responses by both initial and back-up contacts. In total, 1,062 individual respondents were invited, representing 602 local (both county and city) health departments and 460 emergency response departments. Survey responses were accepted until January 2012. All survey responses were exported from SurveyMonkey to R v2.15.2 (www.r-project.org/) for analysis.
Statistical analysis. We generated summaries of survey responses related to two factors: heat preparedness and response. Broadly, we investigated heat preparedness based on whether, in 2011, counties a) had existing heat plans (from any agency—health departments, emergency response programs, etc.) and b) had existing heat wave definitions. We investigated heat response based on survey answers related to nine broad responses: a) communication about heat risks; b) outreach or education to the public on heat; c) collaboration with other organizations, including police and fire departments, social organizations, and medical professionals; d) opening of cooling centers; e) activation of a heat plan; f) assistance with relocation during electrical outages; g) financial assistance in response to the heat; h) hiring new staff in response to heat; and i) providing transportation. For each county, we also calculated an index of county heat response: the number of responses out of these nine broad responses performed in 2011. This index could take values between 0 (no responses performed) to 9 (all nine responses performed) and was used in regional summaries and summaries relating county characteristics to county heat response index levels.
For each survey response, the percent of counties responding affirmatively to a question was calculated based on counties providing nonmissing responses for the specific question. The number of counties on which summaries are based therefore differs by survey question. If multiple officials from the same county responded to the survey, an affirmative response was defined as at least one person in the county reporting use of the preparation or response. We also investigated geographic diversity by generating regional summaries of heat preparedness and heat response using regional divisions (Northeast, Midwest, South, and West) based on the CDC Wide-ranging Online Data for Epidemiologic Research (WONDER) (CDC 2013) database’s regional classifications.
To assess whether heat preparedness in 2011 was associated with county characteristics, we fit logistic regression models of county heat plan status in 2011 (0, county lacked a heat plan; 1, county had a heat plan), regressed separately on four county characteristics: county population, county’s typical July weather (see description below), percent of county population ≥ 65 years of age, and percent of county population in poverty (percent of population below poverty as defined by the American Community Survey thresholds (U.S. Census Bureau 2013).
The absolute measure of temperature for each county (i.e., typical July weather) was determined as the average of county measurements of daily maximum temperature from 2001 through 2010. These weather data were taken from the CDC’s WONDER database (CDC 2013), available for all study counties except those in Alaska, which were excluded from this stage of analysis. We focused on weather data in the decade before the summer of 2011 (i.e., 2001–2010) to adequately capture county-level prior heat experience. The county-level demographic data were collected from the American Community Survey’s 5-year estimates for the years 2006–2010 (U.S. Census Bureau 2011). County population was modeled using a log10 transformation, whereas all other variables were untransformed. Based on these logistic regression models, we estimated the probability of a county having a heat plan in place in 2011 at the 25th and 75th percentile values for each county characteristic and calculated the odds ratio (OR) for an increase in this (IQR).
We also investigated whether the heat response in 2011 (index 0–9) was associated with county characteristics, how extreme the weather was during the 2011 summer, and the presence of a heat plan. To do this, we calculated means of this index across the counties by quantile bins of each of these county characteristics. County-level demographic data for this analysis were the same as previously described. To measure how extreme the 2011 summer was in each county, we calculated the deviation above normal temperature (i.e., the difference between the average of daily maximum temperatures in July 2011 in the county and the county’s average of daily maximum July temperature in 2001–2010) (CDC 2013), in degrees Fahrenheit.
Results
Preparedness for the extreme heat of 2011. Of 586 surveyed counties, 190 responded (32%). In 2011, 40% of 188 counties with nonmissing responses had existing heat plans, and 30% of 185 responding counties had heat wave definitions (Table 1). Of responding counties with heat plans (n = 72), less than half had created the plan recently (12% within 1 year of the summer of 2011; 33% within 1–3 years) (see Supplemental Material, Table S2). A few counties had long-standing heat plans, with plans created ≥ 10 years before 2011 (12%). Of counties responding (n = 71), most had last updated their heat plan within the last year (73%) (see Supplemental Material, Table S2).
Table 1.
Summaries of county-level preparedness and response to the extreme heat of 2011 in 30 U.S. states.
| Preparedness or response action | Percent of responding counties that responded “yes” | No. of counties responding “yes”/no. of counties responding |
|---|---|---|
| Preparedness for heat in 2011 | ||
| Existing heat plan in 2011 | 40 | 76/188 |
| Existing heat wave definition in 2011 | 30 | 56/185 |
| Response to heat in 2011 | ||
| Communicated about heat risks | 73 | 132/180 |
| Provided outreach/education on heat to public | 64 | 113/177 |
| Collaborated with other organizations | 46 | 66/145 |
| Opened cooling centers | 40 | 61/152 |
| Activated heat plan | 24 | 46/188 |
| Assisted with relocation during electrical outages | 4 | 7/177 |
| Provided financial assistance | 3 | 6/177 |
| Provided transportation | 2 | 4/179 |
| Hired new staff in response to heat | 1 | 1/167 |
| Each row gives both the percent of counties responding “yes” of all counties with nonmissing responses for the factor as well as the absolute number of counties responding “yes” and responding with any nonmissing answer. | ||
Of counties with nonmissing responses (n = 185), 30% had an existing heat wave definition in 2011 (Table 1). Fifty-four counties included details describing their heat wave definitions; of these, 15 (28%) used definitions based on the U.S. National Weather Service or NOAA heat wave definitions (NOAA 2009), four (7%) used state-wide definitions, and two (4%) used definitions based on city-specific heat health watch systems (see Supplemental Material, Table S2). For several other counties, heat wave definitions were tied to specific temperatures (examples: “in the 90s”; “98°F day and 89°F night for a 18-hr period”; “3 consecutive days over 101°F”); other definitions accounted for air moisture either explicitly or through the use of heat index as a trigger (“temperatures above 95°F with humidity above 50%”; “heat index above 115°F”). Other heat wave definitions were more qualitative, and identified heat wave as temperatures above normal, particularly when temperatures caused health concerns.
On average, Midwestern, Northeastern, and Southern counties in this study were more prepared for the extreme heat of 2011, with 48% (n = 64), 46% (n = 26), and 44% (n = 55) of surveyed counties in these regions, respectively, having existing heat plans in 2011 (Figure 1). Western counties were, on average, less prepared, with 22% (n = 40) of surveyed counties reporting heat plans in 2011.
Figure 1.
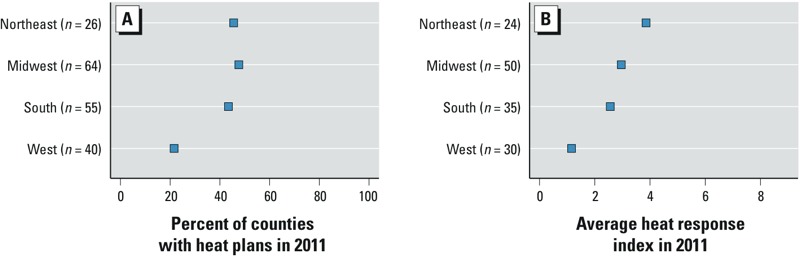
Preparedness and response to 2011 heat by region. (A) Percent of counties in each region that had an existing plan in 2011. (B) Average heat response index for each region in 2011 (possible values between 0 and 9, with higher index values indicating more extensive heat response).
Heat plans were more likely in more populous counties (Table 2, Figure 2). Based on a logistic regression of heat plan status on county population (n = 185), 34% of counties with populations of 22,000 (25th percentile across all county populations) were expected to have heat plans, versus 48% of counties with populations of 161,000 (75th percentile across all county populations) (Table 2). The OR for having a heat plan for an IQR increase in county population was 1.83 (95% CI: 1.23, 2.72) (Table 2). However, analysis of OR and temperature quantiles suggests the relationship between heat plan status and average July temperature may be nonlinear and not statistically significant, as counties with hottest July temperatures did not have the highest prevalence of heat plans (Table 2, Figure 2). Heat plan status was inversely associated with the percentage of the population ≥ 65 years of age (OR for an IQR increase in percent of population ≥ 65 years of age: 0.76; 95% CI: 0.52, 1.12) and with county poverty rates (OR for an IQR increase in poverty status: 0.79; 95% CI: 0.55, 1.14), although again neither estimate was statistically significant (Table 2).
Table 2.
Association between county characteristics and the probability of having an existing heat plan in 2011, based on a simple logistic regression of heat plan status on each community characteristic.
| County characteristic (n = 185) | Percentile | Expected percent of heat plan at | OR (95% CI) | ||
|---|---|---|---|---|---|
| 25th | 75th | 25th percentile | 75th percentile | ||
| Population (n) | 22,000 | 161,000 | 34 | 48 | 1.83 (1.23, 2.72) |
| Average July maximum temperature, 2001–2010 | 77°F | 89°F | 39 | 43 | 1.14 (0.72, 1.75) |
| Percent poverty | 7 | 12 | 45 | 39 | 0.79 (0.55, 1.14) |
| Percent of population ≥ 65 years | 12 | 17 | 45 | 39 | 0.76 (0.52, 1.12) |
| The ORs and 95% CIs are shown for a change covering the interquartile range across all counties for each county characteristic. | |||||
Figure 2.
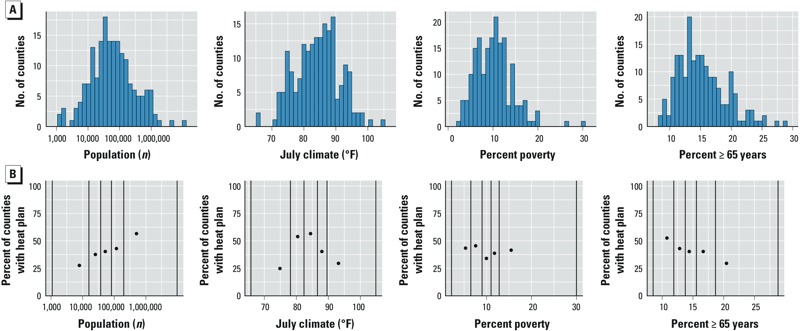
County characteristics: distributions and associations with heat preparedness in 2011 (n = 185). (A) Distributions of county population, July climate (average of daily July maximum temperature values, 2001–2010), percent poverty, and percent of population ≥ 65 years. (B) Percent of counties with heat plans in 2011 in each quantile bin for county characteristics. All counties were divided into five bins based on the county characteristics, with breaks between bins at the 20th, 40th, 60th, and 80th percentiles of the characteristic; black vertical lines show divisions between bins as well as minimum and maximum values; points are positioned on the x-axis at the median characteristic value for the counties within the bin.
Response to the extreme heat of 2011. Based on nonmissing survey responses, for which sample numbers are provided in Table 1, the most frequent county responses to the 2011 extreme heat was communication about heat risks (73%) and outreach or education to the public (64%) (Table 1). Counties also reported collaboration with other organizations (46%), opening cooling centers (40%), or activating existing heat plans (24%). Few counties reported assisting with relocation during electrical outages (4%), providing financial assistance (3%), providing transportation (2%), or hiring new staff in response to the heat (1%).
Survey responses for the next several paragraphs are captured in Supplemental Material, Table S2. Based on nonmissing responses (n = 180), the most common methods of communication about heat risks were public service announcements (53%) and websites (48%). Several counties also reported communicating about heat through social media (30%), flyers and posters (18%), and email messages (17%). Few counties reported communicating through joint events with other groups (8%), telephone hotlines (6%), door-to-door campaigns (4%), or telephone calls (1%).
Of counties responding (n = 177), many reported providing outreach or education to people working with the elderly (37%), people with certain medical conditions (37%), people with low incomes (29%), and health care providers (25%). Fewer counties reported providing outreach to people who are mobility challenged (15%), people working with the homeless (12%), people living in high-rise apartment buildings (10%), and people with nervous system disorders (9%). Some counties wrote in other forms of education or outreach, including outreach geared toward children through schools and child care centers; outreach to people working outdoors; and outreach to agencies serving the mentally ill.
Of 145 counties with responses, 46% reported collaborating with at least one other organization to respond to the extreme heat of 2011. Collaborations were common among all four types of organizations presented in the survey: among counties with nonmissing responses, 36% reported collaborating with medical professionals, 28% with social/civic organizations, 25% with fire departments, and 23% with police departments. Some counties gave examples of the social or civic organizations with which they collaborated, including Departments of Social Services, the Red Cross, United Way, Salvation Army, Meals on Wheels, Rotary, local shelters, and local libraries.
Most of the counties that opened cooling centers opened five or fewer centers (83%) and most opened the cooling centers for ≤ 5 days of the summer (58%). However, some counties reported opening more cooling centers or operating cooling centers for longer: 12% of counties reported opening > 10 cooling centers, and 5% of counties reported keeping cooling centers open all summer.
Of the counties that activated heat plans during the summer of 2011, most activated the heat plan for ≤ 10 days (71%). Other counties activated heat plans for longer periods, and one county kept its heat plan activated the entire summer. In responding counties (n = 46), the decision to activate a heat plan was most commonly prompted at least in part by an internal decision (46%), and some counties also based their decision on a predefined trigger in a heat wave early warning system (41%), suggestions from an emergency preparedness team (30%), directives or suggestions from the state health department (28%), or a noticeable spike in heat-related sickness and deaths (22%).
Seven counties (4%) of 177 reported assisting with relocation during electrical outages related to the heat of 2011. Seventy-three of these counties reported that relocation was irrelevant because their county experienced no electrical outages during the 2011 summer.
Six (3%) of 177 counties reported providing any type of financial assistance in response to the heat. Assistance was provided to help pay for utility bills in five counties and to help pay for food/water and for air conditioning/fans in one county each.
Four counties (2%) reported providing transportation as a response to the heat of 2011 (n = 179). This transportation was provided to people who called and requested transportation during the heat as well as residents of a specific apartment or neighborhood. One county reported hiring new staff in response to the heat (n = 167).
Based on responses about these nine broad categories of heat response (Table 1), adequate data existed to calculate a response index (county-specific sum of how many of the nine responses were undertaken in 2011) for 117 counties. Across these counties, this response index ranged between 0 and 7, with a median of 2 (the highest potential value of this index is 9). When counties were divided by region, counties in the Northeast and Midwest had, on average, more extensive responses to the 2011 heat, with average heat response indices of 3.9 (n = 24) and 3.0 (n = 50) respectively (i.e., on average counties performed between three and four of nine considered heat responses) (Figure 1). Counties in the South and West had lower average heat response indices [South: 2.6 (n = 35); West: 1.2 (n = 30)].
Heat response was greater if a county had a heat plan in 2011 (Figure 3). Heat response was also associated with county population, with larger counties more likely to perform more extensive heat response than smaller counties. The heat response index was also higher in counties where July 2011 temperatures were more extreme compared with average July temperatures in the previous decade, and in counties with a lower proportion of residents ≥ 65 years of age or with a lower proportion of residents in poverty (Figure 3).
Figure 3.
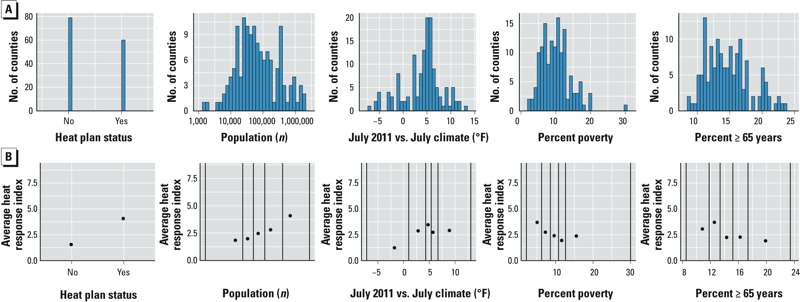
County characteristics: distributions and associations with heat response in 2011 (n = 117). (A) Distributions of heat plan status, county population, difference between July 2011 and July climate (average of daily July maximum temperatures in 2011 – average of daily July maximum temperature values, 2001–2010), percent poverty, and percent of population ≥ 65 years of age. (B) Average heat response index in 2011 in each quantile bin for that county characteristics. All counties were divided into five bins based on the county characteristics, with breaks between bins at the 20th, 40th, 60th, and 80th percentiles of the characteristic; black vertical lines show divisions between bins as well as minimum and maximum values; points are positioned on the x-axis at the median characteristic value for the counties within the bin.
Counties’ evaluations of response to the extreme heat of 2011. The survey also asked counties whether they had evaluated their own response to the heat of 2011. Twelve of the 176 responding counties (7%) reported that they had evaluated their heat response. Of these, five counties reported their self-evaluation score. All five counties ranked their response as a 5 (average) of 10. However, the response index for these counties ranged from 1 to 5, suggesting more variation between these counties in response than was identified by their self-analysis.
Discussion
This study provides a current, national review of heat adaptation at the county level shortly after the summer of 2011, one of the hottest U.S. summers on record at the time of this study. We collected these data shortly after the hot summer to reduce recall bias and provide a better picture of on-the-ground adaptation. The size of our study population and number of respondents were large compared to previous surveys (190 responding counties in 30 U.S. states), and we had a response rate (32%) comparable with most previous surveys (see Supplemental Material, Table S1). Our survey selection was randomized and, coupled with the response rate and state participation, represented a diversity of U.S. counties.
Preparedness for heat during summer of 2011. Based on nonmissing survey responses, most counties were likely underprepared for the extreme heat of 2011: most lacked either heat plans (only 40% of counties who responded to questions about heat plans reported having them) or heat wave definitions (only 30% of counties with nonmissing answers reported having heat wave definitions). O’Neill et al. (2010) similarly found that most of their survey respondents had not established a plan to deal with extreme heat.
Directors of U.S. public health departments believed that lack of human and financial resources could be a key constraint preventing climate change from being incorporated into public health preparedness, but the survey did not address specific costs associated with climate change adaptation (EDF 2008). Our survey collected information about how heat preparedness and response was financed, which will be part of a future analysis.
Counties with heat plans performed, on average, between three and four of the nine broad responses we considered in this analysis, compared with, on average, between one and two responses performed by counties without heat plans (Figure 1). Further, heat plans may be critical to ensure the effectiveness of specific heat responses. For example, although heat wave early warning systems can save lives, their success can be limited by not having clear decision-making protocols among the relevant institutions and end users or their advocates (Kovats and Ebi 2006); such protocols could be established through heat planning. Only weak evidence was found to suggest that counties where summers are typically hotter (based on averages of daily July maximum temperature measurements for 2001–2010) were more likely to have established heat plans in preparation for extreme heat by 2011 than were milder counties. The health impacts of heat are not necessarily more severe in hot regions of the United States than in milder regions (Anderson and Bell 2009; Anderson et al. 2013), which suggests a level of adaptation to typical summer temperatures within a community.
Responses to the heat of 2011. The most common county responses to heat were communicating about heat risks and providing outreach or education to the public. More than half of responding counties reported performing these responses.
Many counties reported using newer technologies to communicate about heat, including websites, social media, and emails. Although websites and Internet access are powerful and cost-effective communication tools, health inequalities underpinned by differential access to health services may be further reinforced by disparities in access to the Internet (e.g., ethnicity, education, and economic resources). In other words, the less educated have fewer resources and potentially less access to health care, and could be left out of the communication loop (Gilmour 2007), particularly when communication efforts rely on newer technologies. Many do not perceive heat as a health threat. This can become especially dangerous for isolated populations who may not hear about heat risks. Some underused methods, based on our survey, including telephone calling and door-to-door campaigns, could be more useful to reach these isolated populations. Additionally, preexisting beliefs about personal resilience and personal heat adaptation behaviors need to be accounted for in communication to the general public, potentially through local health departments or collaborators, such as the medical community (Astrom et al. 2011).
Although many of our responding counties reached out to the elderly and those with medical concerns or low income, fewer counties (≤ 25% of responding counties) reached out to those working with the homeless or those with mobility challenges or nervous system disorders, or those living in high-rise residences. Outreach to these vulnerable populations may represent a missed opportunity to limit heat impacts in many U.S. communities. Encouragingly, our survey found that many counties worked with organizations such as medical professionals, the fire department, the police department, and social organizations such as the Red Cross, Rotary, and Meals on Wheels to respond to the heat. Planning and programming for heat-health protection will likely be most effective if performed in a bottom-up and community-specific manner and as a collaborative effort among multiple levels of government and local stakeholders (e.g., community/health centers, hospitals, clinics, volunteer groups, transit officials, schools, emergency services) (Yardley et al. 2011). The need for the collaborations between health and various other agencies to help identify these populations is essential. For example, some organizations have even started developing registries for those who need to be checked on during extreme heat events. A good example of such a registry is from the City of Toronto (2012).
It was rare for counties to perform some of the responses included in the survey, like assisting with relocation during electrical outages (only seven counties), providing financial assistance (only six counties), providing transportation (only four counties), and hiring new staff (only one county) (Table 1). Other heat responses beyond those included in this study may help limit heat impacts. For example, heat wave early warning systems coupled with direct interventions such as “buddy systems” and “home visits,” used, for example, in Philadelphia, Pennsylvania, could potentially play an important role in reducing heat related deaths (Kalkstein et al. 1996). These systems predated the heat wave early-warning system. Setting up such programs from scratch may be costly to establish and maintain—in terms of time and effort—and therefore less common compared with outreach and communication strategies. Counties might want to explore policy changes or resource sharing among local stakeholders (e.g., private industry, nonprofits) to provide these more costly services to the local community.
In our study, heat response was lower in counties with a higher percentage of people ≥ 65 years of age, where efforts to improve heat preparedness and response may provide even greater benefits than in counties with younger populations. Many older Americans live in regions that could be hard hit by extreme events associated with climate change, including heat waves, and the U.S. population is projected to include 88.5 million Americans ≥ 65 years of age by 2050 (Gamble et al. 2013).
Respondents also noted that formal evaluations of their heat plans and response were not being conducted. Evaluation results can support policy that could potentially save more lives as more funding goes toward these types of public health preventive activities.
Study limitations and future research directions. Because selection was randomized, areas with high populations of low-income, minority populations and recognized tribal areas were not a large segment of the survey response pool. Another challenge was that some states had more centralized health systems that were managed at the county level, whereas others had health services distributed across health districts not defined by county lines (i.e., Alaska, Connecticut, Iowa, and Maine). Some respondents were uncertain concerning heat preparedness and response within their county. Finally, we had little information about counties that were invited to participate in our survey but did not respond, so our analysis cannot be used to infer heat preparedness and response in other counties in these states or in states that were not surveyed.
Although this survey provides a description of the current status of heat preparedness and response within > 100 U.S. counties, more research is necessary to evaluate and quantify the effectiveness of the heat responses described in this article, particularly in terms of preventing negative heat-related health impacts (i.e., heat-related morbidity and mortality). Few studies have evaluated the associations between the responses (adaptation practices) we present here and heat-related morbidity/mortality. However, researchers have documented reductions in the risks for heat-related health incidences related to heat response plans and other related efforts (Michellozzi et al. 2010; Weisskopf et. al. 2002).
Buildings and infrastructure, the availability of social services, the impact of heat and heat island mitigation activities, and community support networks are just a few of the factors requiring further exploration at the county level. Some particular adaptation strategies that can be considered include having persons with special medical needs register with their local emergency management agency to ensure they will receive necessary services or evacuation assistance, coordinating service providers, creating vulnerability mapping to assist with planning, and developing strategies to reduce the urban heat island effect (Ebi and Semenza 2008; Wilhelmi and Hayden 2010).
The various structures for planning and heat response throughout the United States are diverse and complex, but our study shows evidence of a lack of action and planning, regardless of community size. In this study, unlike others, we asked questions specifically to understand exactly how counties plan and respond, filling a current gap in this area of research. To get a workable baseline, we need a starting point—and this study offers that foundation. We hope that this method will be used in future studies and serve as a platform to expose existing idiosyncrasies and make climate change preparedness and response a unique challenge for each and every community.
Conclusions
Given that heat waves are expected to become more frequent and severe under climate change (Intergovernmental Panel on Climate Change 2012), it is critical to enhance local education and planning for extreme heat events to enhance collaborations and reach beyond the more recognized vulnerable populations (i.e., the elderly) to other less recognized populations (i.e., those with mobility challenges, the homeless) during heat events.
Information clearinghouses [such as that offered by the Georgetown Climate Change Collaborative (Georgetown Climate Center 2013)] can help foster the exchange of information on best practices and resources for outreach, education, and emergency planning. In the coming years, extreme heat in the United States will continue to affect rural and urban, low-income and wealthy, and prepared and unprepared communities. Thus, planning and implementation of heat adaptation programs, which are not widespread in the United States, have great potential for reducing the toll of heat on health in this nation.
Supplemental Material
Acknowledgments
We thank the staff at local health departments and emergency preparedness divisions who dedicated their time to completing both surveys; JSI Research & Training Institute, Inc. of Boston, Massachusetts, for helping revise and deploy the adaptation survey; Union of Concerned Scientists staff members, particularly L. Fleischman for GIS assistance; research assistant L. N’Dri of WE ACT for Environmental Justice; K. Mimnaugh at University of Illinois-Champaign Urbana for data downloading assistance;CDC Wonder staff for assisting with accessing county temperature data; and internal and external reviewers.
Footnotes
This research was supported by the Union of Concerned Scientists, Kendall Science Fellows Program, and National Institute of Environmental Health Sciences grants R21ES020152 and K99ES022631.
K.L.E. is an independent consultant with ClimAdapt, LLC, based in Seattle, WA. The authors declare they have no actual or potential competing financial interests.
References
- Anderson GB, Bell ML. Weather-related mortality: how heat, cold, and heat waves affect mortality in the United States. Epidemiology. 2009;20(2):205–213. doi: 10.1097/EDE.0b013e318190ee08. [DOI] [PMC free article] [PubMed] [Google Scholar]
- Anderson GB, Dominici F, Wang Y, McCormack MC, Bell ML, Peng R. Heat-related emergency hospitalizations for respiratory diseases in the Medicare population. Am J Respir Crit Care Med. 2013;187(10):1098–1103. doi: 10.1164/rccm.201211-1969OC. [DOI] [PMC free article] [PubMed] [Google Scholar]
- Astrom D, Forsberg B, Rocklov J. Heat wave impact on morbidity and mortality in the elderly population: a review of recent studies. Maturitas. 2011;69(2):99–105. doi: 10.1016/j.maturitas.2011.03.008. [DOI] [PubMed] [Google Scholar]
- Bedsworth L.2009Preparing for climate change: a perspective from local public health officers in California. Environ Health Perspect 117617–623.; 10.1289/ehp.0800114 [DOI] [PMC free article] [PubMed] [Google Scholar]
- Bernard SM, McGeehin MA. Municipal heat wave response plans. Am J Public Health. 2004;94(9):1520–1522. doi: 10.2105/ajph.94.9.1520. [DOI] [PMC free article] [PubMed] [Google Scholar]
- Bouchama A, Knochel JP. Heat stroke. N Engl J Med. 2002;346(25):1978–1988. doi: 10.1056/NEJMra011089. [DOI] [PubMed] [Google Scholar]
- CDC (Centers for Disease Control and Prevention). Heat-related illness, deaths and risk factors—Cincinnati and Dayton, Ohio, 1999, and United States, 1979–1997. MMWR Morb Mortal Wkly Rep. 2000;49:470–473. [PubMed] [Google Scholar]
- CDC (Centers for Disease Control and Prevention). Heat-related deaths–Chicago, Illinois, 1996–2001, and United States, 1979–1999. MMWR Morb Mortal Wkly Rep. 2003;52:610–613. [PubMed] [Google Scholar]
- CDC (Centers for Disease Control and Prevention). CDC’s Climate-Ready States & Cities Initiative. 2012. Available: http://www.cdc.gov/climateandhealth/climate_ready.htm [accessed 15 May 2012]
- CDC (Centers for Disease Control and Prevention). CDC WONDER: North America Land Data Assimilation System (NLDAS) Daily Air Temperature and Heat Index, years 1979–2011. 2013. Available: http://wonder.cdc.gov/NASA-NLDAS.html [accessed 29 July 2013]
- City of Toronto. Heat Registries: A Guide for Helping Vulnerable People During Extreme Heat. 2012. Available: http://www1.toronto.ca/city_of_toronto/shelter_support__housing_administration/files/pdf/heat-registry-guide.pdf [accessed 9 May 2014]
- Davis RE, Knappenberger PC, Michaels PJ, Novicoff WM.2003Changing heat-related mortality in the United States. Environ Health Perspect 1111712–1718.; 10.1289/ehp.6336 [DOI] [PMC free article] [PubMed] [Google Scholar]
- Dillman DA, Smyth JD, Christian LM. Hoboken, NJ: John Wiley & Sons; 2009. Internet, Mail, and Mixed-Mode Surveys: The Tailored Design Method. 3rd ed. [Google Scholar]
- Ebi KL, Semenza JC. Community-based adaptation to the health impacts of climate change. Am J Prev Med. 2008;35(5):501–507. doi: 10.1016/j.amepre.2008.08.018. [DOI] [PubMed] [Google Scholar]
- EDF (Environmental Defense Fund). Are We Ready? Preparing for the Public Health Challenge of Climate Change. Environmental Defense Fund. 2008. Available: http://www.edf.org/health/reports/are-we-ready [accessed 25 August 2012]
- Fischer EM, Oleson KW, Lawrence DM.2012Contrasting urban and rural heat stress responses to climate change. Geophys Res Lett 393L03705; 10.1029/2011GL050576 [DOI] [Google Scholar]
- Gamble JL, Hurley BJ, Schultz PA, Jaglom WS, Krishnan N, Harris M.2013Climate change and older Americans: state of the science. Environ Health Perspect 12115–22.; 10.1289/ehp.1205223 [DOI] [PMC free article] [PubMed] [Google Scholar]
- Georgetown Climate Center. Georgetown Climate Change Collaborative. 2013. Available: http://www.georgetownclimate.org [accessed 6 May 2014]
- Gilmour JA. Reducing disparities in the access of the use of internet health information: a discussion paper. Int J Nurs Stud. 2007;44(7):1270–1278. doi: 10.1016/j.ijnurstu.2006.05.007. [DOI] [PubMed] [Google Scholar]
- Hajat S, Kosatky T. Heat-related mortality: A review and exploration of heterogeneity. J Epidemiol Community Health. 2010;64(9):753–760. doi: 10.1136/jech.2009.087999. [DOI] [PubMed] [Google Scholar]
- Hess JJ, McDowell JZ, Luber G.2012Integrating climate change adaptation into public health practice: using adaptive management to increase adaptive capacity and build resilience. Environ Health Perspect 120171–179.; 10.1289/ehp.1103515 [DOI] [PMC free article] [PubMed] [Google Scholar]
- Hoshiko S, English P, Smith D, Trent R. A simple method for estimating excess mortality due to heat waves, as applied to the 2006 California heat wave. Int J Public Health. 2010;55(2):133–137. doi: 10.1007/s00038-009-0060-8. [DOI] [PubMed] [Google Scholar]
- Huang C, Vaneckova P, Wang X, FitzGerald G, Guo Y, Tong S. Constraints and barriers to public health adaptation to climate change: a review of the literature. Am J Prev Med. 2011;40(2):183–190. doi: 10.1016/j.amepre.2010.10.025. [DOI] [PubMed] [Google Scholar]
- Intergovernmental Panel on Climate Change. Managing the Risks of Extreme Events and Disasters to Advance Climate Change Adaptation. A Special Report of Working Groups I and II of the Intergovernmental Panel on Climate Change. 2012. Available: http://ipcc-wg2.gov/SREX/ [accessed 20 October 2013]
- Jones TS, Liang AP, Kilbourne EM, Griffin MR, Patriarca PA, Wassilak SGF, et al. Morbidity and mortality associated with the July 1980 heat wave in St. Louis and Kansas City, MO. JAMA. 1982;247(24):3327–3331. [PubMed] [Google Scholar]
- Kalkstein LS, Jamason PF, Greene JS, Libby J, Robinson L. The Philadelphia hot weather-health watch/warning system: development and application. Bull Am Meterorol Soc. 1996;77(7):1519–1528. [Google Scholar]
- Kovats RS, Ebi KL. Heatwaves and public health in Europe. Eur J Public Health. 2006;16(6):592–599. doi: 10.1093/eurpub/ckl049. [DOI] [PubMed] [Google Scholar]
- McGeehin M, Mirabelli M. The potential impacts of climate variability and change on temperature-related morbidity and mortality in the United States. Environ Health Perspect. 2001;109(suppl 2):185–189. doi: 10.1289/ehp.109-1240665. [DOI] [PMC free article] [PubMed] [Google Scholar]
- Meehan P, Toomey KE, Drinnon J, Cunningham S, Anderson N, Baker E. Public health response for the 1996 Olympic Games. JAMA. 1998;279(18):1469–1473. doi: 10.1001/jama.279.18.1469. [DOI] [PubMed] [Google Scholar]
- Michellozzi P, De’Donato FK, Bargagli AM, D’Ippoliti D, De Sario M, Marino C, et al. Surveillance of summer mortality and preparedness to reduce the health impact of heat waves in Italy. Int J Environ Res Publ Health. 2010;7(5):2256–2273. doi: 10.3390/ijerph7052256. [DOI] [PMC free article] [PubMed] [Google Scholar]
- Naughton MP, Henderson A, Mirabelli MC, Kaiser R, Wilhem JL, Kieszak SM, et al. Heat related mortality during a 1999 heat wave in Chicago. Am J Prev Med. 2002;22(4):221–227. doi: 10.1016/s0749-3797(02)00421-x. [DOI] [PubMed] [Google Scholar]
- NOAA (National Oceanic and Atmospheric Administration). National Weather Service Glossary. 2009. Available: http://w1.weather.gov/glossary/index.php?letter=h [accessed 9 February 2014]
- NOAA (National Oceanic and Atmospheric Association). National Climatic Data Center, State of the Climate. National Overview—July 2011. 2011. Available: http://www.ncdc.noaa.gov/sotc/national/2011/7 [accessed 23 July 2013]
- NOAA (National Oceanic and Atmospheric Association). NOAA: 2011 A Year of Climate Extremes in the United States. 2012a. Available: http://www.noaanews.noaa.gov/stories2012/20120119_global_stats.html [accessed 23 July 2013]
- NOAA (National Oceanic and Atmospheric Administration National Climatic Data Center). 2012b. U.S. Monthly Highest Max Temperature Records set in July 2011 Available: http://www.ncdc.noaa.gov/extremes/records/monthly/maxt/2011/07/00?sts[]=US#records_look_up [accessed 15 September 2011].
- O’Neill MS, Jackman DK, Wyman M, Manarolla X, Gronlund CJ, Brown DG, et al. US local action on heat and health: are we prepared for climate change? Int J Public Health. 2010;55(2):105–112. doi: 10.1007/s00038-009-0071-5. [DOI] [PubMed] [Google Scholar]
- O’Neill MS, Zanobetti A, Schwartz J. Disparities by race in heat-related mortality in four U.S. cities: the role of air conditioning prevalence. J Urban Health. 2005;82(2):191–197. doi: 10.1093/jurban/jti043. [DOI] [PMC free article] [PubMed] [Google Scholar]
- Union of Concerned Scientists. Local Public Health Response to Hot Weather. 2011. Available: http://www.ucsusa.org/heatsurvey [accessed 6 May 2014]
- U.S. Census Bureau. 2011. American Community Survey. 2011. Available: http://www.census.gov/acs/www/ [accessed 23 September 2011].
- U.S. Census Bureau. Definitions. 2013. Available: http://www.census.gov/hhes/www/poverty/methods/definitions.html [accessed 6 May 2014]
- Weisskopf MG, Anderson HA, Foldy S, Hanrahan LP, Blair K, Török TJ, et al. Heat wave morbidity and mortality, Milwaukee, Wis, 1999 vs. 1995: an improved response? Am J Public Health. 2002;92(5):830–833. doi: 10.2105/ajph.92.5.830. [DOI] [PMC free article] [PubMed] [Google Scholar]
- White-Newsome JL, O’Neill MS, Gronlund CJ, Sunbury TM, Brines SJ, Parker E, et al. Climate change, heat waves and environmental justice: advancing knowledge and action. Environ Justice. 2009;2(4):197–205. [Google Scholar]
- Wilhelmi OV, Hayden MH.2010Connecting people and place: a new framework for reducing urban vulnerability to heat. Environ Res Lett 5014021; 10.1088/1748-9326/5/1/014021 [DOI] [Google Scholar]
- Yardley J, Sigal R, Kenny GP. Heat health planning: The importance of social and community factors. Global Environ Change. 2011;21(2):670–679. [Google Scholar]
Associated Data
This section collects any data citations, data availability statements, or supplementary materials included in this article.