Abstract
The problem of predicting polymorphism in atomic and molecular crystals constitutes a significant challenge both experimentally and theoretically. From the theoretical viewpoint, polymorphism prediction falls into the general class of problems characterized by an underlying rough energy landscape, and consequently, free energy based enhanced sampling approaches can be brought to bear on the problem. In this paper, we build on a scheme previously introduced by two of the authors in which the lengths and angles of the supercell are targeted for enhanced sampling via temperature accelerated adiabatic free energy dynamics [T. Q. Yu and M. E. Tuckerman, Phys. Rev. Lett. 107, 015701 (2011)]. Here, that framework is expanded to include general order parameters that distinguish different crystalline arrangements as target collective variables for enhanced sampling. The resulting free energy surface, being of quite high dimension, is nontrivial to reconstruct, and we discuss one particular strategy for performing the free energy analysis. The method is applied to the study of polymorphism in xenon crystals at high pressure and temperature using the Steinhardt order parameters without and with the supercell included in the set of collective variables. The expected fcc and bcc structures are obtained, and when the supercell parameters are included as collective variables, we also find several new structures, including fcc states with hcp stacking faults. We also apply the new method to the solid-liquid phase transition in copper at 1300 K using the same Steinhardt order parameters. Our method is able to melt and refreeze the system repeatedly, and the free energy profile can be obtained with high efficiency.
INTRODUCTION
In the study of crystals, polymorphism refers to the ability of certain compounds to form multiple stable structures, a phenomenon that has significant ramifications for pharmaceuticals, high-energy materials, and organic electronics.1 Experimental determination of all of the relevant crystal structures of a particular compound under a given set of conditions is both lengthy and costly. Therefore, computational approaches for a priori polymorphism prediction, if sufficiently accurate and efficient, can potentially play an important role in the understanding and designing crystals in these and other fields.
Considerable effort has been invested over several decades in the prediction of crystal structures, and numerous theoretical methods have been developed.2 Despite notable successes in the computational prediction of crystal polymorphs,3, 4, 5 such predictions are far from routine, and the problem remains an important outstanding challenge. The most common approach starts with candidate structures obtained by packing the molecules according the symmetry operations of the most common space groups, performing a local optimization, and then evaluating the associated lattice energy. Although this approach produces many candidate structures, it may produce false positives or miss solid forms that are not perfect crystals, including mixed structures and stable defects,6 and it is not likely to identify structures that crystallize into rare space groups.7 Moreover, this approach relies on a harmonic approximation to the calculation of lattice phonon frequencies of the candidate structures in order to determine thermodynamic properties such as the free energy. While the harmonic approximation is often sufficient for low-temperature crystals governed by strong intermolecular interactions, when systems are dominated by weak interactions, as is the case in many organic molecular crystals, anharmonic effects become important, and alternate approaches are needed. Obtaining fully anharmonic thermal contributions requires a methodology based directly on free energy generation. This category of techniques, however, entails the considerable challenge of sampling a complex and rough energy landscape in order to obtain the relative populations of the different polymorphs. Because of this, polymorphism prediction has been compared to the conformational exploration of proteins.8 Although the two challenges are very different, they share important features, and consequently, some of the methods developed for biophysical structure prediction can be adapted for crystal polymorphism exploration.8, 9, 10, 11, 12
Following this idea, we recently introduced a new free energy approach for the discovery and thermodynamic ranking of polymorphs of atomic and molecular crystals.6, 13 The technique is derived from the recognition that temperature can be employed to accelerate barrier crossing, an approach that has been shared by a variety of schemes including simulated annealing,14 simulated tempering,15, 16 parallel tempering,17, 18 and temperature accelerated dynamics.19 In our algorithm, we identify a set of collective variables (CVs) capable of distinguishing different states and subject them to a high-temperature heat bath. At the same time, these variables are also assigned high masses in order to effect an adiabatic decoupling of these variables from the remaining degrees of freedom. This approach is termed adiabatic free energy dynamics (AFED).20, 21 In the limit of perfect adiabatic decoupling, it can be proved that the CVs move on the correct potential of mean force surface, which is equivalent to the free energy surface.20 The approach of Refs. 6, 13, which we call Crystal-AFED, is an adaptation of the AFED scheme to the isothermal-isobaric ensemble, in which the cell lengths and angles, or equivalently, the elements of the full cell matrix, are employed as the target CVs. Using these CVs, the polymorphs of crystalline benzene were studied,6 and it was found that 500 ps of simulation time were sufficient to identify all of the stable polymorphs at 2 GPa and 100 K, and after just 5 ns, the free energy differences were sufficiently converged to propose a resolution of a controversy concerning the structure of the benzene II polymorph. This study also highlighted the importance of entropic contributions in the stabilization of the putative benzene II structure obtained.
Targeting the cell matrix alone for enhanced sampling in the discovery of crystal polymorphs is useful when different polymorphs are characterized by very different unit cell shapes, so that the lengths and angles of the cell are able to distinguish different structures. In some cases, however, these parameters alone are insufficient to induce transitions between different solid forms, for example, when collective flipping of molecules is required to effect such a transition. In addition, predicting crystal formation from amorphous or glassy states generally cannot be easily accomplished using just the cell matrix. In these examples, transitions between polymorphs and crystallization from disordered states are better described with the aid of structural order parameters. We will refer to these as “internal order parameters” in order to distinguish them from the cell matrix. The well known Steinhardt order parameters22 constitute one such example. Recently, novel approaches to the generation of general order parameters for molecular crystals have been introduced.23, 24 Despite these intriguing advances, the problem of developing such general order parameters remains a significant challenge. Structural order parameters are often used in the study of phase transitions, nucleation, liquid crystals, and various other applications. Therefore, targeting molecular order parameters in combination with the cell matrix could potentially constitute a powerful approach to the discovery of crystal polymorphs based on enhanced sampling and free energy surface generation. However, because general order parameters are complicated functions of the primitive Cartesian coordinates of the atoms in a system, they cannot be easily treated within the AFED scheme, which requires that the CVs be explicit coordinates in the system or that they be made explicit via a transformation to a set of generalized coordinates that contains the CVs as a subset of the larger coordinate set. It was shown,25, 26 however, that this problem could be circumvented by introducing an extended phase-space approach, in which the CVs of interest are harmonically bound to the coordinates in the extended space. These extended coordinates are then subject to a high temperature and are adiabatically decoupled from the remainder of the system. The approach is termed temperature-accelerated molecular dynamics (TAMD)25 or driven adiabatic free energy dynamics (d-AFED).26 Recently, a Monte Carlo version of this approach was also introduced,27 which fits the general framework of heterogeneous multiscale methods.28, 29 In the limit of perfect adiabatic decoupling and infinitely stiff harmonic coupling, TAMD/d-AFED can be proved to generate the correct free energy surface as a function of the CVs.25, 26, 30
In this paper, we further develop our previous temperature-accelerated sampling approach for the discovery of crystal polymorphs to include internal order parameters as additional CVs via the TAMD/d-AFED framework. We apply the approach to the case of solid xenon at high pressure. Under the conditions chosen, we find that hitherto unexpected polymorphs and fcc structures with hcp stacking faults are obtained. As a second example, we study the liquid-solid phase transition of copper, which illustrates that our new approach can also be effective in studying transitions between ordered and amorphous states.
METHODOLOGY
Equations of motion
Consider a system containing N atoms with positions r1, …, rN interacting via a potential U(r1, …, rN) ≡ U(r) in a supercell described by three vectors a, b, and c such that the volume V of the cell is V = a · (b × c). These three vectors are collected in the columns of a matrix h according to
| (1) |
which is referred to as the cell matrix; its determinant gives the cell volume: V = det(h). Suppose we are interested in the free energy surface as a function of n ≪ 3N collective variables (CVs) q1(r), …, qn(r). Under isothermal-isobaric conditions with external pressure P, the relevant free energy is the Gibbs free energy G(s1, …, sn), which is obtained from the marginal probability distribution for the CVs q1(r), …, qn(r) to have corresponding values s1, …, sn. This free energy is, therefore, given by
| (2) |
where D(h) is the spatial domain defined by the cell matrix, β = 1/kBT, Δ = Δ(N, P, T) is the isothermal-isobaric partition function. The s variables are also known as coarse-grained variables (CGVs). We can also include the cell matrix in the set of CVs, in which case the relevant free energy is
| (3) |
In the Crystal-AFED approach of Refs. 6, 13, the cell matrix alone was selected as the set of target CVs, and it was possible to drive these variables directly with a high temperature and adiabatic decoupling. However, when including internal order parameters in the set of CVs, this is no longer possible, and it is necessary to employ the extended phase-space approach of Refs. 25, 26. In this case, we write the product of δ-functions ∏αδ(qα(r) − sα) as the limit of a product of Gaussian functions according to
| (4) |
In practice, the inverse width parameters κα are taken to be large but finite. Thus, if Eq. 4 is substituted into Eq. 2 or Eq. 3, the result is a modification of the potential U(r) by the addition of a harmonic potential V{κ}(r, s) given by
| (5) |
where s ≡ s1, …, sn, so that the potential for the extended phase space becomes
| (6) |
For finite κα, we obtain approximations G{κ}(s1, …, sn; β) ≡ G{κ}(s; β) or G{κ}(s1, …, sn, h; β) ≡ G{κ}(s, h; β) to the Gibbs free energy surfaces as functions either of s alone or of both s and h, that approach the exact value as κα → ∞.
A set of temperature-accelerated equations of motion capable of generating the Gibbs surfaces in either Eq. 2 or 3 is based on the Martyna-Tobias-Klein (MTK) equations of motion,31, 32 for which measure-preserving integrators have been developed.33, 34 Introducing two temperatures Ts for the order parameters, and Th for the cell matrix, the equations of motion take the form
| (7) |
Here, “Bath” refers to some heat bath coupling, e.g., Nosé-Hoover chains,35 generalized Gaussian Moment thermostats,36 a Langevin bath, …37, 38, 39
| (8) |
is the total force on the ith atom, including forces from any holonomic constraints, and Nf is the effective number of degrees of freedom. The matrix pg is a 3 × 3 matrix that serves as a barostat to control the fluctuations of the pressure tensor estimator, which is given by
| (9) |
The mass-like parameters W and μα that determine the time scales for the motion of the cell matrix and internal order parameters, respectively, are determined by the conditions , , where τh and τs time scales relevant to the motion of each set of CVs, respectively. The units of the harmonic coupling parameters κα depend on the choice of the associated CVs, so that the harmonic coupling term in Eq. 5 has units of an energy. Finally, we note that there are two choices for the parameter Th in Eqs. 7. If the Gibbs free energy in Eq. 2 is sought, then Th should be set equal to the physical temperature T, while if the free energy in Eq. 3 is the goal, then Th should be set equal to Ts. In Ref. 13, we developed the algorithms needed to integrate the original equations of Crystal-AFED6 when holonomic constraints are imposed on a system, and the introduction of the extended variables in Eqs. 7 requires no change to this procedure. Consider, first, the case when Th = T, so that the Gibbs free energy surface in Eq. 2 is sought. When the extended variables s are sufficiently slow, they are driven by forces generated by averaging over the motion of the remaining variables. In this case, the motion of s is effectively governed by
| (10) |
where ⟨⋅⋅⋅⟩s indicates an ensemble average over the degrees of freedom (r, p, h, pg) at fixed values of s = (s1, …, sn). Thus, the ensemble average of ⟨κα(qα(r) − sα)⟩s can be written as
| (11) |
Here, H(p, r) is the physical Hamiltonian , C is a normalization constant, and G{κ}(s; β) is the finite-κ approximation to the true Gibbs potential of mean force surface, which is also the free energy surface. Δ{κ}(s; β) is the finite-κ partition function at fixed s1, …, sn
| (12) |
Since Eq. 10 generates the density P{κ}(s; βs, β) ∝ exp (−βsG{κ}(s; β)), the Gibbs free energy surface can be constructed from a normalized histogram collected during the integration of Eqs. 7 under adiabatic (“adb”) conditions using
| (13) |
According to Eq. 4, in the limit {κα → ∞}, G{κ}(s; β) converges to the exact Gibbs free energy surface G(s) in Eq. 2. In practice, {κα} are chosen sufficiently large that the difference between G{κ} and G is negligible, noting that the error is bounded and of order max α(1/κα).30 When Th = Ts, a similar argument can be made for the full Gibbs free energy surface in Eq. 3.
FES construction and representation
While a free energy surface can be obtained directly by accumulating a histogram over the course of a simulation, this approach has the obvious limitation that the number of bins rapidly increases with the dimensionality of the surface. In order to address this problem, we make use of the single-sweep method proposed in Ref. 40. In this approach, TAMD/d-AFED is first used to explore the configuration space only, and centers are deposited in the space of the target CVs. Next, free energy gradients (i.e., mean forces) calculated at each center are used to construct the free energy surface (FES) using a set of radial basis functions (RBF) as interpolants. The use of RBFs as interpolants in the construction of a FES is a technique that can be applied on sparse grids with regular or irregular boundaries, and therefore a high-dimensional generalization of the thermodynamic integration method.41
In order to apply the single-sweep method, we first represent the free energy surface G{κ}(s; β) in Eq. 13 as a linear combination, denoted , of RBFs. This expansion takes the form
| (14) |
Here, z is the full set of coarse-grained variables, i.e., z = (s1, …, sn) if Eq. 2 is sought, or it is the full set of coarse-grained variables and the box matrix, i.e., z = (s1, …, sn, h) if Eq. 3 is sought. Note that each element of h, which is generally taken to be upper or lower triangular when off-diagonal elements are needed, is treated as an independent CV when constructing the linear combination in Eq. 14. One possible choice of ϕσ(r) is a Gaussian kernel of width σ: ϕσ(r) = exp (−r2/2σ2). The K Gaussian centers, z(k), are chosen along a CV trajectory generated from a TAMD/d-AFED simulation and the optimal coefficients ak and σ are determined via minimization of the cost function
| (15) |
where the numerical mean force f(k) is obtained from restrained molecular dynamics (MD) simulations performed at the locations of the centers z(k). The mean force on the coarse-grained variable sα is given by the average
| (16) |
where z is fixed at z(k) in the NPT simulation. The mean force on hμν, when h is included in the FES, is calculated from
| (17) |
with both the coarse-grained variables s1, …, sn and h held fixed at the selected centers z(k), which now include centers for the box matrix. Note that, when h is held fixed, the ensemble is equivalent to an NhT ensemble. For a fixed σ value, minimization of the cost function in Eq. 15 leads to a system of linear equations,40 and the coefficients ak can be obtained using any linear solver. The calculation can be carried out for a range of σ values in order to find an optimal choice for σ that leads to the lowest mean-squared error.40 Note that one can also use the modified cost function of Monteferrante et al.42
The functional form of the free energy surface via the linear combination of radial basis functions in Eq. 14 may not provide a transparent picture of the free energy landscape, especially when the dimension is high. In order to locate all of the minima on the free energy surface thus constructed, we run many optimizations in the CGV space using, for example, a steepest-descent algorithm, from an ensemble of initial points. Since the centers used in the reconstruction cover the important regions of the configuration space, they serve well as the initial points. After these minima are found, the string method43, 44 can be used to locate saddle points on the high-dimensional free energy surface as well as the minimum free energy paths (MFEPs). Once this information is available, a network can be generated in which the minima are the vertices/nodes and any two minima are connected by an edge if there is a MFEP connecting them directly. We also assign a weight to each edge, which is the free energy of the saddle on the MFEP. In this way, we obtain a weighted graph representation for the FES, similar to a recent scheme introduced for protein free energy landscapes.45 Such a network is a reduced representation of the surface that captures its most salient features, including critical points and their associated free energy values. Any further analysis, particularly analysis involving integration over the CVs, can then be performed using Eq. 14.
ORDER PARAMETERS USED IN THIS STUDY
The Steinhardt order parameters,22Ql, l = 3, 4, 6, …, are widely used to identify crystal structures. Q4 and Q6 can distinguish the simple cubic, face-centered cubic (fcc), body-centered cubic (bcc), and hexagonal closest packing (hcp) crystal structures found in the solid phases of spherical particles. For molecular crystals, one typically requires more general order parameters.23, 24, 46 Here, we employ the continuous version of the general Steinhardt order parameter given in Refs. 47, 48. Thus, the global order parameters used as CVs in our study take the form
| (18) |
where
| (19) |
Here, Nb is the total number of atom pairs separated by a distance rmax, N is the total number of atoms, and Ncoor is the first-shell coordination number of each atom. Ylm are the spherical harmonics, is the unit vector along the direction rb, i.e., . While the normalization factor in Eq. 19 should be Nb, the quantity Nb varies as the phase changes, which will cause discontinuities in the function Ql. For this reason, we choose NNcoor as the normalization factor for convenience. In this study, Ncoor = 6. fc(r) is a smooth switching function defined as
This function is used to remove discontinuities in the original definition of the Steinhardt parameters22 that occur when each bond is switched off at a specific radius rmax. The value of rmax is determined from the end of the first peak in the radial distribution function (RDF).
In order to describe the bond orientation for each atom, we employ the local Steinhardt order parameters, ql, l = 3, 4, 6, … defined as
| (20) |
where
| (21) |
Here, Nb(i) is the number of all pairs connecting to atom i within a cutoff rmax as above. The parameter ql(i) can be used to distinguish different atomic neighbor environments, i.e., a bcc arrangement will have a very different ql value from a fcc arrangement. Another set of local Steinhardt order parameters, denoted as wl(i) and defined as
| (22) |
is employed to analyze solid structures. Since the temperature in our studies is close to the melting point, thermal fluctuations are very large. Consequently, the distribution of these local order parameters is rather broad, which diminishes their ability to distinguish different crystal structures. Therefore, averaged versions of these bond order parameters, introduced previously by Lechner and Dellago,49 which are more sensitive to different crystal structures, are also employed in the present study, although other local order parameters are also possible.50 The averaged bond order parameters and have the same definitions as Eqs. 20, 22 except that qlm is replaced by , which is given by
| (23) |
where summation runs over all neighbors of particle i, including particle i, itself. It is obvious that averaged bond order parameters account for the second shell.
XENON POLYMORPHISM AT HIGH PRESSURE AND MELTING POINT
Recent simulation studies51, 52 of solid xenon shows that its crystal structure undergoes a fcc-bcc transition at high pressures (25 GPa–30 GPa) close to the melting point (2700 K–2900 K).51, 52 These studies also show that bcc grows naturally from a fcc-liquid mixed-phase state, and the authors reported a phase diagram with the fcc-bcc-liquid triple point near 25 GPa and 2700 K. Subsequent theoretical investigations challenged the exact location of this triple point.53, 54 Enhanced sampling techniques have the distinct advantage over studies of this type in that they allow the metastability and coexistence behavior to be investigated on the basis of the free energy surface. To our knowledge, no such calculations have been performed for this problem, which makes it an interesting test case for our new approach.
Implementation
We consider a system containing 4000 Xenon atoms initially in a 10 × 10 × 10 fcc arrangement. The h matrix was constrained to be orthorhombic, and therefore only the diagonal elements (the cell lengths a, b, and c) were used. We chose a temperature of 2700 K and a pressure of 25 GPa as the imposed external conditions of the simulation. Interactions were described by a Buckingham potential,55 which is believed to improve on the simpler Lennard-Jones potential for condensed systems of noble gas atoms.56 The accuracy of this model has been verified against experiment.52 All the simulations were performed using the PINY_MD code.57, 58
We first studied the FES with the variables Q6 and Q4 as the target CVs. The extended variables were maintained at 1.5 × 10⁵ K for enhanced sampling with τs = 50 ps, τh = 0.5 ps, rmax = 4.5 Å, and rmin = 4.1 Å. The coupling constant κ was the same for Q6 and Q4 and set to 1 × 10¹⁰ K. In a second study, we investigated how the FES changes when h is added to Q6 and Q4 in the CV set, which leads to a five-dimensional FES. The temperature of the extended variables and h matrix was maintained at 1 × 10⁵ K for enhanced sampling with τs = 50 ps, τh = 1 ps, rmax = 4.5 Å, and rmin = 4.1 Å. The coupling constant κ for Q6 and Q4 was again taken to be 1 × 10¹⁰ K. Finally, in order to prevent the system from sampling liquid or glassy states, we restricted Q6 > 0.7.
In both cases, we used the following protocol in the simulations: Ten 5 ns long trajectories starting from the fcc crystal were generated in order to explore the configuration space by integrating Eqs. 7 with a time step of 5 fs. To reconstruct the FES associated with Q4 and Q6 alone, 764 centers were deposited along the trajectories in such a way that any new center should be at a distance of at least 0.01 from any previously deposited center. Within a neighborhood of 0.003 of each center, all instantaneous forces on the corresponding extended variables were collected from the sampling run for the calculation of the mean forces at that center. In order to reconstruct the FES associated with Q4, Q6, and h, the cell lengths were first scaled by a factor of 1/30 so that the range of cell lengths were comparable to those of Q6 and Q4. Then, 2462 centers were deposited in the five-dimensional CV space. The mean forces at those centers were calculated from restrained MD simulations of 10 ps each. Because of the scaling of h, the mean forces needed to be scaled up by a factor of 30 in the corresponding components. Finally, the stability of all the structures corresponding to minima on the FES were tested using a standard isothermal-isobaric simulation of length 5 ps with a fully flexible box.
Results and discussion
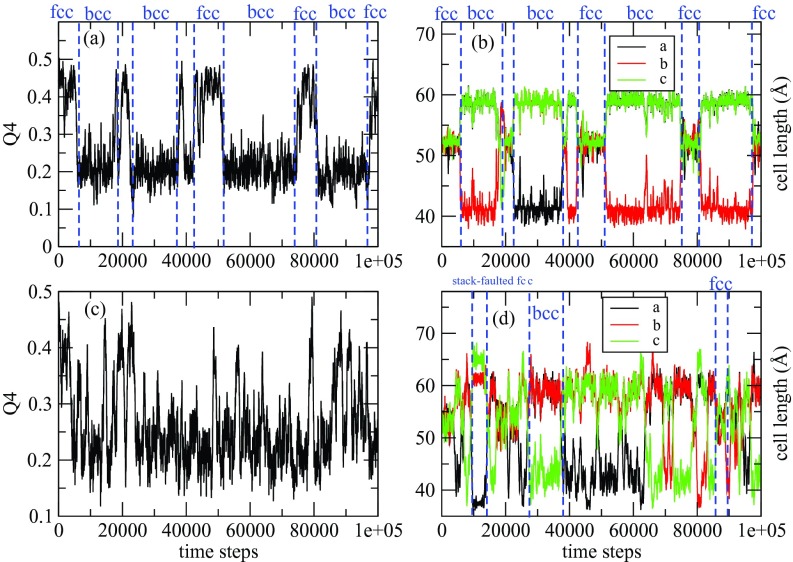
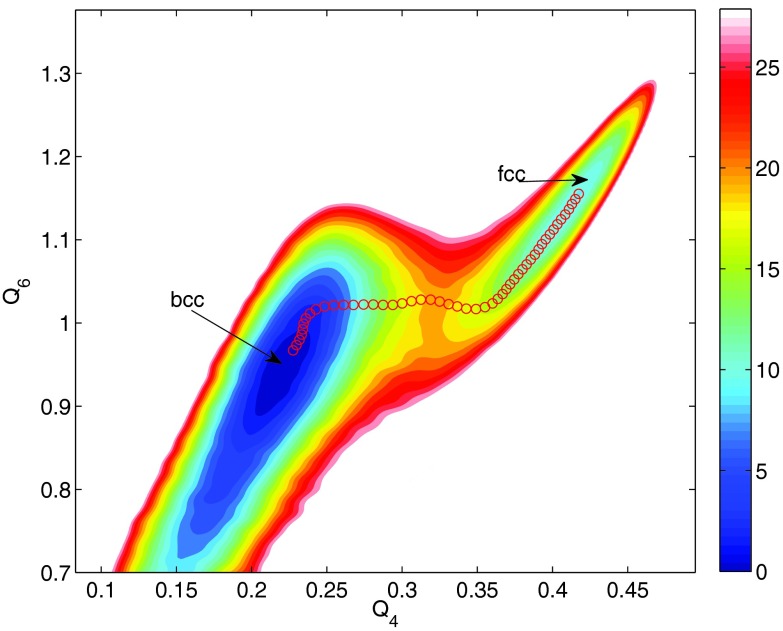
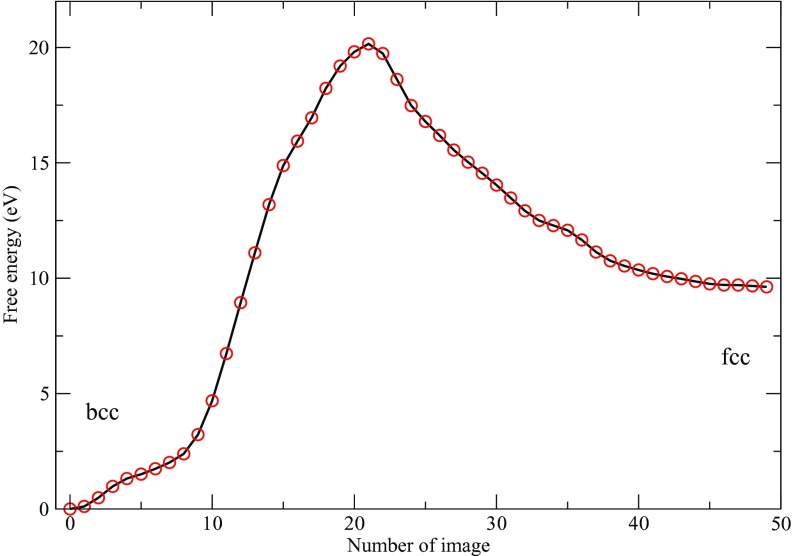
Figures 1a, 1b show the trajectories of Q4 and of the cell lengths when the enhanced sampling targeted only the Q4 and Q6 variables. Both trajectories show two stable phases, namely, fcc and bcc, under the conditions of the simulation. The two-dimensional FES subsequently calculated by the single-sweep method is shown in Fig. 2. The basins corresponding to the fcc and bcc structures can clearly be seen on this surface, which also shows the minimum free-energy path between these structures generated using the string method (note that we neglected the tensor M entering the definition of the MFEP in this calculation30 since our primary goal was to calculate the free energies of the minima and the saddle point on the landscape). Fig. 3 shows the free energy profile along the MFEP, from which we can estimate the free energy difference between the bcc and fcc structures as 2.5 meV/atom (or 58 cal/mol). Note that for a homogeneous 4000-atom system, e.g., a pure fcc or pure bcc structure, finite-size effects are small, so that the microscopic unit meV/atom can be transformed directly into a macroscopic unit, e.g., kcal/mol. The very small FE difference indicates that the bcc and fcc are thermodynamically equally stable at 2700 K and 25 GPa. Our results support the previous two-phase studies51, 52 in that the bcc structure is stable at 2700 K and 25 GPa, and therefore, the fcc-bcc-liquid triple point should be close to this condition in the P-T plane. Table 1 gives the energy decomposition analysis for the fcc and bcc structures. Not unexpectedly perhaps, we find that the bcc structure is stabilized by entropic effects. Such stabilization was also predicted in relatively early studies based on simple Lennard-Jones models.59 The high entropy of the bcc structure dominates over the enthalpy, thus allowing it to become more stable than the fcc structure. As the temperature decreases and entropic effects become less important, we predict that fcc becomes the dominant state, which is well known for Xenon and was also seen in early studies.59 This is a good example showing that the free energy is the right thermodynamic state function for predicting crystal polymorphism, particularly when the temperature is high.
Figure 1.
Panels (a) and (c): Trajectory of Q4. Panels (b) and (d): Trajectory of cell lengths. Panels (a) and (b) are from temperature-accelerated sampling with only Q4 and Q6 as CVs, while in panels (c) and (d), Q4, Q6, and the cell lengths are used as CVs. Q4 > 0.3 corresponds to the fcc structure; Q4 < 0.3 corresponds to the bcc structure.
Figure 2.
Free energy surface as a function of Q4 and Q6 when these variables are used as the sole target CVs. The red circles represent the minimum energy path connecting the bcc and fcc basins, as calculated from the string method based on the constructed FES. The free energy values, in eV, correspond to the total free energy of the system.
Figure 3.
Free energy profile along the minimum free energy path at 2700 K and 25 GPa.
Table 1.
Free energy decomposition analysis for the fcc and bcc structures. ΔG is the free energy difference; ΔH is the enthalpy difference; ΔV is the volume difference; ΔS is the entropy difference, ΔG = ΔH − TΔS. All energies are in meV/atom. Enthalpy and volume are calculated from a 10 000-step MD simulation. T = 2700 K and Pext = 25 GPa.
| ΔG | ΔH | ΔE | PextΔV | TΔS | |
|---|---|---|---|---|---|
| bcc-fcc | −2.5 | 12.8 | 10.8 | 2.0 | 15.2 |
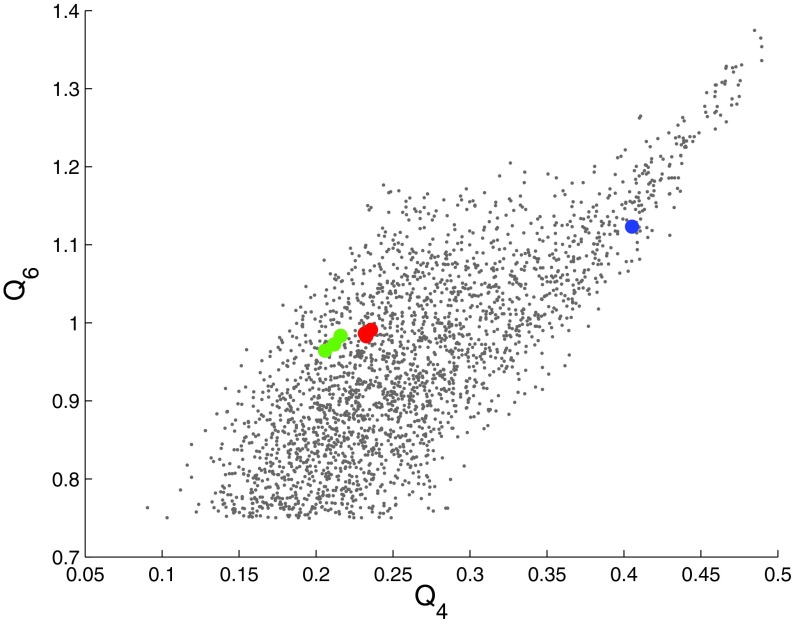
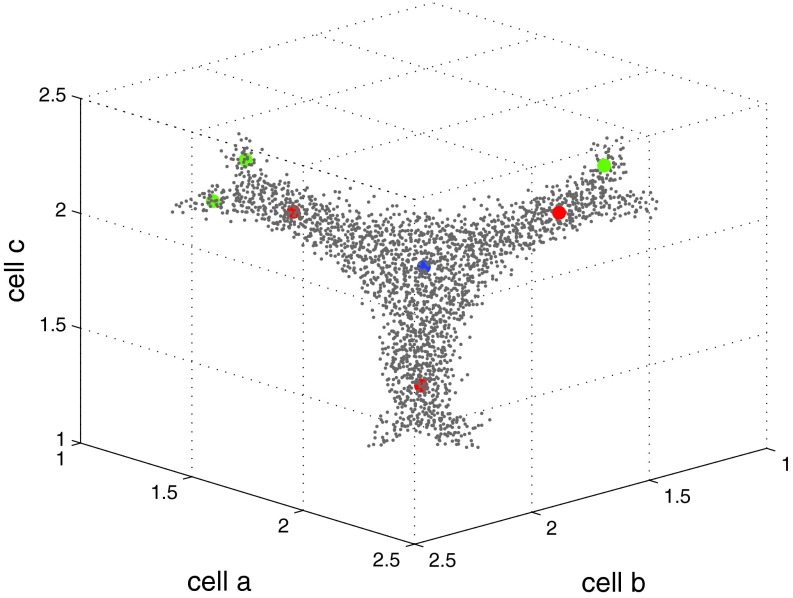
When the three cell lengths are added to the set of CVs, a larger set of metastable structures is explored at 2700 K and 25 GPa. Figures 1c, 1d show the resulting trajectory. A full five-dimensional FES was constructed using the single-sweep method with the mean forces on the CVs as input. Free energy minima were also located on this surface. The locations of the centers used in the FES construction (grey dots) and of the minima (colored filled circles) are shown in Fig. 4 after projections in the space of Q4 and Q6, and in Fig. 5 in the space of the three cell lengths. The fact that the minima are tightly clustered in the projection on the Q4-Q6 plane (see Fig. 4) but are well separated in the space of cell lengths (see Fig. 5) shows that using Q4 and Q6 alone as CVs is insufficient to identify more metastable solid forms for this system; indeed, the location of these minima cannot be accurately resolved in the lower dimensional Q4-Q6 space. Thus, we see that the inclusion of the cell matrix in conjunction with the internal order parameters is essential. Finally, in order to better visualize the five-dimensional FES, we created a network representation of it as described in Section 2B (see Fig. 6). Fig. 6 also contains the free energy values (relative to the bcc structure) of the minima and saddle points. In order to avoid confusion, we should point out that the saddle or MFEP we obtained may not be the true solid-solid transition path, as finite-size effects60 could lead to an overestimation of the free energy barriers.
Figure 4.
Distribution of centers and minima in the space of Q4 and Q6. Grey dots are centers deposited in the space of the collective variables. The red filled circles are minima for bcc, the blue is the minimum for fcc, and the green are minima for new metastable states identified as fcc with stacking fault.
Figure 5.
Distribution of centers and minima in the space of cell lengths. The cell lengths have been scaled down by a factor of 1/30 in units of Å. Grey dots are centers deposited in the space of the collective variables. The red filled circles are minima for bcc, the blue is minima for fcc, and the green are minima for new metastable states identified as fcc with stacking fault later.
Figure 6.
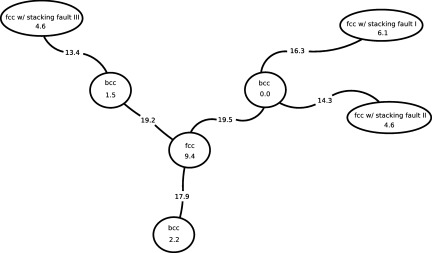
Network representation of five-dimensional free energy surface in the Q4, Q6, and the three cell length variables. The numbers assigned to each node correspond to free energies at the minima; the numbers assigned to the edges are the free energy values for the corresponding saddle points. The free energy is in eV.
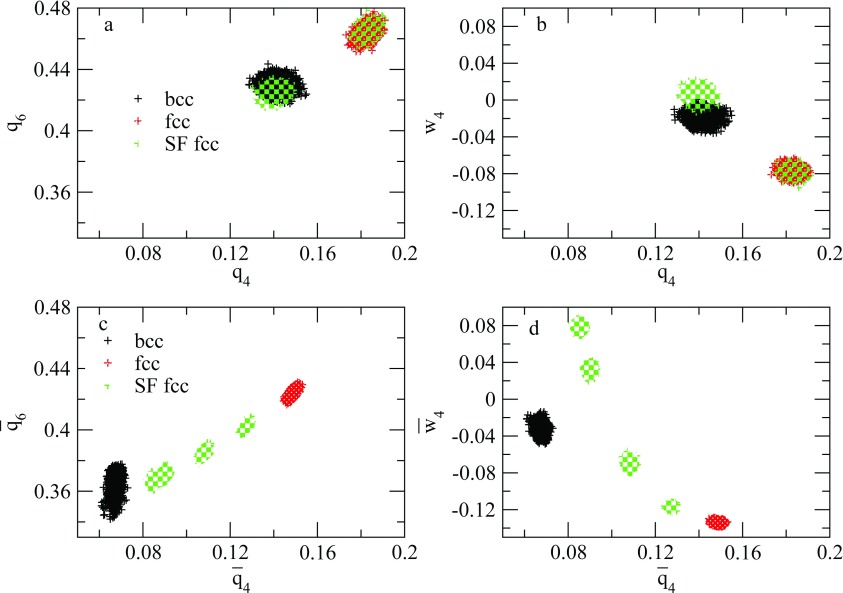
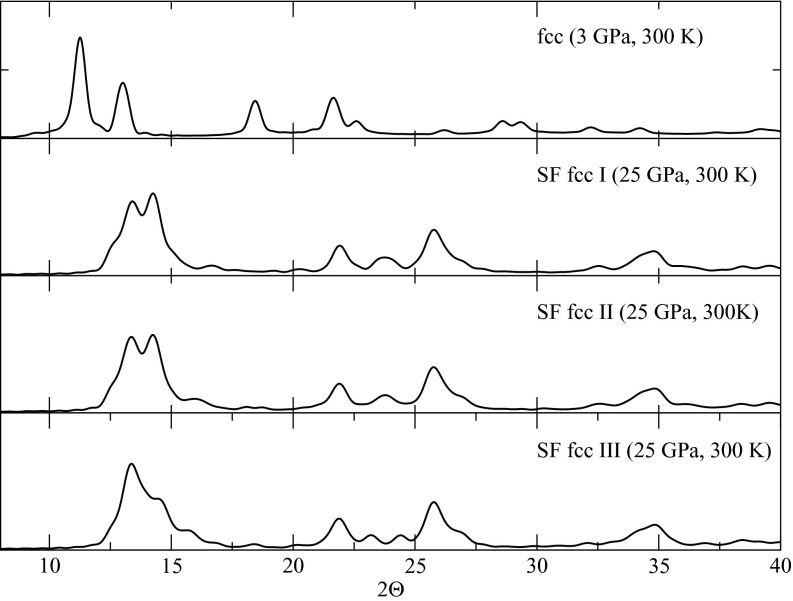
The structures shown in the network diagram were further analyzed using local order parameters and averaged local order parameters. The values of the local and averaged local order parameters for all of the structures are shown in Fig. 7. In addition to the fcc and bcc structures already identified, we also find fcc crystals with stacking faults characterized by a hcp structure. Even though fcc-hcp polytypism is expected to exist, it is still impressive that our sampling can locate these structures. Figs. 7a, 7b show that there exist two types of atoms within such a structure. One type is characterized by order parameters located in the fcc region (for example, w4 ∈ [ − 0.01, −0.06] and q4 ∈ [0.17, 0.19] in (b)), and the other type is characterized by order parameters located in the hcp region (for example, w4 ∈ [ − 0.1, 0.02] and q4 ∈ [0.13, 0.15] in (b)). (See also Ref. 49 for the order parameter values that characterize the hcp structure.) Fig. 8 shows snapshots of several such structures with atoms colored based on their (w4, q4) values. These pictures clearly show the fcc and hcp arrangement occurring in an alternating pattern in these structures. Even though we sample just a few fcc structures with such stacking faults, we expect that longer runs or runs employing a higher temperature for h and the extended variables could yield even more of these. Experimental evidence for the existence of such states has been reported in pressure-induced Martensitic fcc-to-hcp transformations,61 where they are interpreted as intermediate states between the fcc and hcp structures. In order to see whether the defects in our fcc structure are indeed these intermediate states, we have calculated the powder diffraction pattern using the Debyer package.62 Fig. 9 shows the powder patterns of the three fcc structures with stacking faults. These match well the patterns shown in Fig. 1 of Ref. 61. The bulk system is treated as a cluster in the calculation (no periodic boundary conditions) and therefore, finite-size effects may explain the tiny difference between the calculated and experimental powder diffraction patterns. From the comparison of the powder diffraction patterns, there is compelling evidence to suggest that the stacking-fault structures we obtained could resemble the intermediate states visited in the pressure-induced fcc-to-hcp transition.
Figure 7.
Comparison of the distributions of local order parameters for several solid forms. The variables q6, q4, and w4 are the local bond order parameters; , , and are the averaged bond order parameters. In order to minimize thermal smearing, order parameters for each atom are obtained by averaging over 200 equilibrated configurations. 4000 dots corresponding to 4000 atoms are given for each solid form. The fcc structure with stacking faults (SF fcc in legend) show two types of atoms according to their local order parameters (see green clusters in (a) and (b)). The averaged bond order parameters include the second neighbor shell. Therefore, the atoms of the fcc structure with stacking faults split into more types as the local environment of an atom becomes more diversified (see green clusters in (c) and (d)).
Figure 8.

Pictures of the fcc with stacking faults. Red corresponds to fcc atom type, with w4 ∈ [−0.10, −0.06] and ; blue corresponds to hcp atom type, with w4 ∈ [−0.1, 0.02] and . SF fcc means fcc with stacking fault.
Figure 9.
Calculated powder diffraction pattern of the fcc structures with stacking faults. The Debyer package62 was used to obtain the powder patterns, and the calculation is based on the Debye scattering equation.63 The temperature and pressure are taken to be the experimental conditions for direct comparison. The wavelength is taken to be 0.7 Å so that the powder diffraction pattern of the fcc structure at 3 GPa is identical to the experimental one in Fig. 1 of Ref. 61. SF fcc means fcc with a stacking fault.
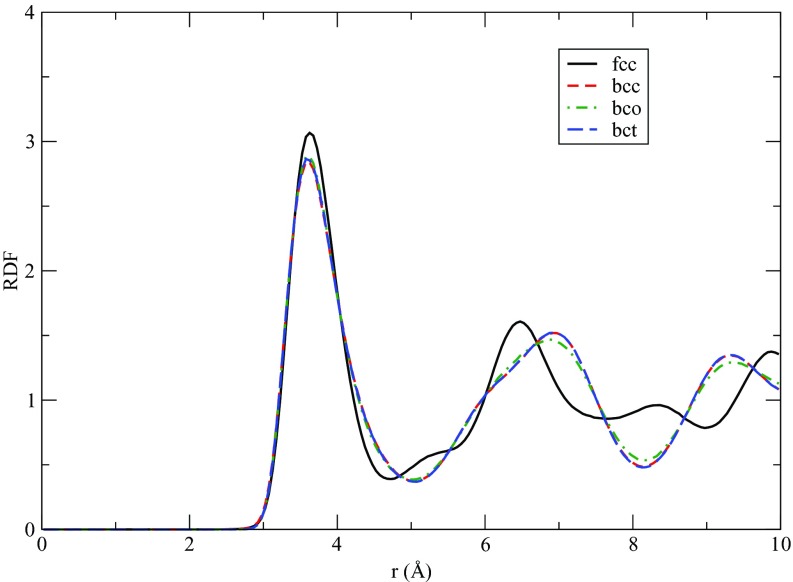
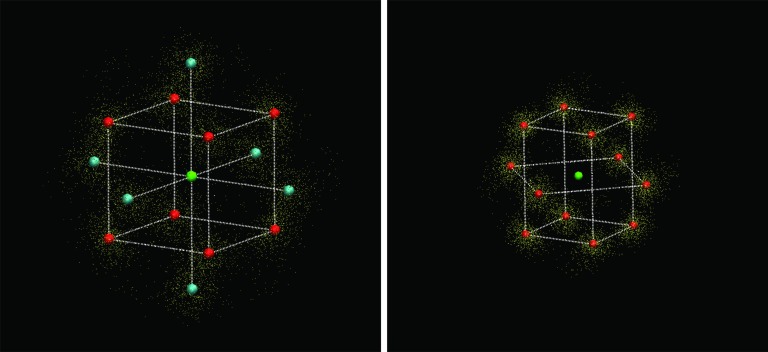
Body centered orthorhombic (bco) and body centered tetragonal (bct) structures also appeared in our sampling. The RDFs of the bco, bct, fcc, and bcc forms at 25 GPa and 2700 K are presented in Fig. 10 in order to show the structural difference. The RDFs for the fcc and bcc structures show different features, which can also serve as an identifier for fcc and bcc, as was done in previous studies.51, 52 The differences between bcc and bco/bct are sufficiently small that the RDFs are very similar. Therefore, in order to identify the bco/bct structure, we calculated their unit cell parameters. Unit cells at high temperature are generally difficult to determine. Since atom switching or atomic jump diffusion may happen in the bulk system at high temperatures, the trajectory-averaged position of an atom gives misleading information about the final lattice as many atoms can be off the lattice sites. Thus, in order to obtain reliable unit-cell information, we employed the following procedure: From four well-equilibrated configurations, we take each atom in each configuration as a “central” atom and find its neighboring atoms within the first peak of the RDF. For the bcc structure, the first peak of the RDF consists of both first and second shell atoms while for the fcc structure, it contains only first-shell atoms. The central atom together, with its neighbors, forms one unit, and we have 16 000 such units (each configuration having 4000 atoms). Overlaying these units with the central atom at the same location and aligning them generates one central atom surrounded by several well-separated clusters. We then use a K-means clustering algorithm to find the clusters and calculate their centroids as the average positions of the atoms associated with the cluster. The centroid is the most probable position of the neighboring atoms. We, therefore, infer the unit cell information from these centroids. In order to illustrate the approach, Fig. 11 shows the clusters and their centroids thus obtained for the bcc and fcc structures. In addition, we have provided animations in the supplementary material64 showing the clusters and centroids from different perspectives. The unit cell parameters of fcc, bcc, and bco/bct are summarized in Table 2. In addition to providing a reliable identification of the bco and bct structures, the high-temperature unit cell analysis we employed has an advantage over an analysis of the RDFs: Due to high-temperature thermal smearing, the bcc structure acquires a putative coordination number of 14 if that coordination number is computed from an integration of the RDF up to the first minimum. However, the coordination number obtained from the high-temperature unit-cell analysis is eight as expected for the bcc structure.
Figure 10.
Radial distribution function for several solid forms at 25 GPa and 2700 K.
Figure 11.
Left panel: The bcc structure obtained by the K-means clustering approach (see text). The snapshot shows the central atom in green, the red spheres represent the centroids of the clusters corresponding to the first-shell atoms, while the cyan spheres show the centroids of the clusters corresponding to the second-shell atoms. The small yellow spheres represent 8000 randomly selected cluster points from 224 000 total points. Right panel: The fcc structure obtained by the K-means clustering approach. As with the bcc structure, the green sphere is the central atom, the red spheres are the centroids of the clusters corresponding to the first-shell atoms, and the small yellow spheres represent 8000 randomly selected cluster points from 192 000 total points.
Table 2.
Unit cell parameters for fcc, bcc, and the predicted crystal forms bco and bct at 25 GPa and 2700 K. Cell lengths are in Å. α = γ = β = 90°.
| a | b | c | Z | |
|---|---|---|---|---|
| fcc | 5.27 | 5.27 | 5.27 | 4 |
| bcc | 4.25 | 4.25 | 4.25 | 2 |
| bco | 4.40 | 4.23 | 4.14 | 2 |
| bct | 4.22 | 4.27 | 4.27 | 2 |
The bct structure remains stable during an isothermal-isobaric (NPT) MD simulation with a fully flexible cell. The stability of the bco structure can only be verified when the simulation box is constrained to be orthorhombic. When we relax it in an NPT simulation with a fully flexible cell, the orthorhombic box shape tilts with final box angles being α = 85.4, β = 86.8, and γ = 91.0, which implies that bco may not be a true stable/metastable state. This is reasonable as the FES on the sub-manifold of the orthorhombic cell constraint can have minima that may not persist when the constraint is removed. However, the success we have shown in locating this minimum, nevertheless, shows the power of the present approach in generating the FES and locating new crystal forms. Because bct/bco structures are only visited once in our trajectories and since their cell matrices have one short length of 36.5 Å, finite-size effects may play a role, and we, therefore, exclude them from the five-dimensional FES construction, leaving them for future studies.
SOLID-LIQUID TRANSITIONS OF COPPER
MD simulations of melting at superheated conditions have provided atomistic insights into some of the theoretical models of the melting mechanism.65, 66 Relying on MD simulations to observe the equilibrium melting of a solid is not optimal because, near the melting point, the melting transition is a rare event with a mean first passage time many orders of magnitude greater than characteristic lattice vibrational periods. Enhanced sampling methods, such as umbrella sampling and metadynamics, have been used to calculate free energy changes in solid-liquid transitions of ductile metals67 and of ice/water.47, 68 Our temperature-accelerated sampling method offers a robust way to calculate free energy changes for melting/freezing processes. Here, we use copper as an example to show that order-parameter-aided TAMD/d-AFED can render such a calculation very efficient.
Simulation details
The interatomic interactions were modeled using an Embedded Atom Method (EAM) potential for copper developed by Mishin et al.69 Simulations were performed using a cell containing 4000 copper atoms (10 × 10 × 10 unit cell). We have used the Steinhardt order parameters Q6 and Q4 as the collective variables to obtain the FES. In order to explore the free energy surface, the initial system is slowly heated to the target temperature 1300 K under a pressure of 1 atm in a series of NPT simulations. Starting from the final structure of this first phase, we launched a 1.5 ns TAMD/d-AFED trajectory with the extended variables at 1 × 10⁵ K. From this trajectory, we selected 15 configurations every 100 ps and used them as the initial configurations for 15 independent TAMD/d-AFED samplings of 1 ns each. The extended variables were maintained at 1 × 10⁷ K for the purpose of enhanced sampling with τs = 7.7 ps for Q6 and τs = 15.5 ps for Q4. We have taken 5 × 10⁸ K and 1 × 10⁸ K as the coupling constants for Q4 and Q6, respectively. τh = 0.75 ps. rmax = 2.75 Å and rmin = 2.71 Å. Along these trajectories, a total of 933 centers were deposited at distances no less than 0.05 from each other. The mean force at a center was evaluated from the average of the instantaneous forces sampled from TAMD/d-AFED trajectories when the corresponding extended variables were within 0.01 to that center. All the simulations were performed using the PINY_MD code57, 58 with an integration time-step 1 fs.
Results and discussion
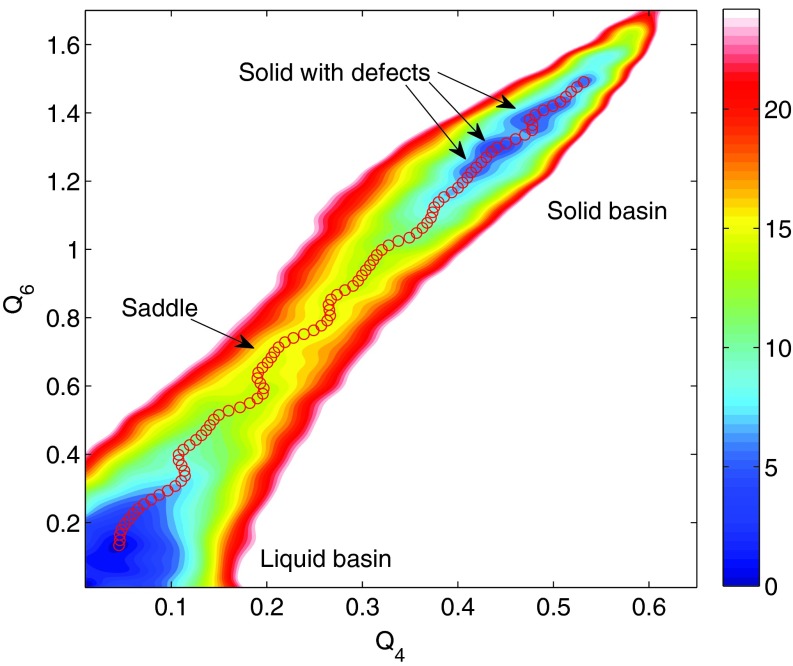
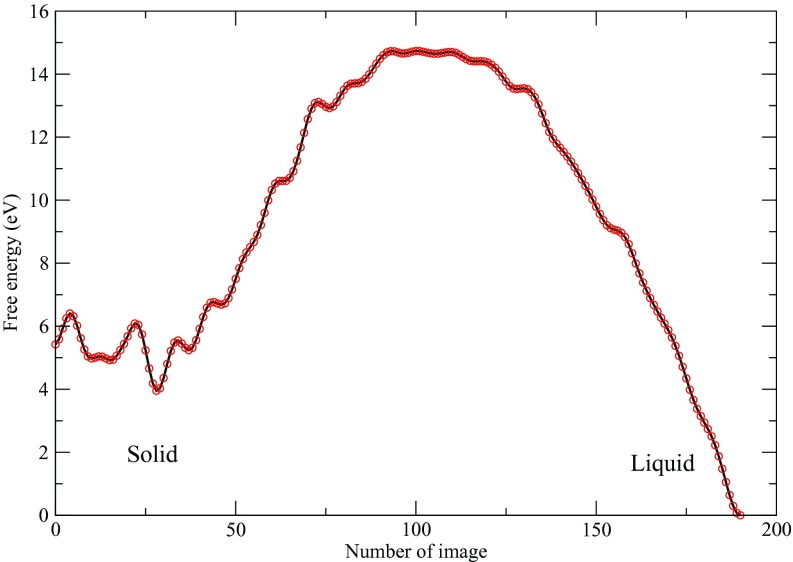
Along a representative TAMD/d-AFED sampling trajectory, we observed several melting and refreezing transitions. A portion of this trajectory has been rendered into a movie and is available in the supplementary material.64 Fig. 12 shows the free energy surface in the variables Q6 and Q4 at 1300 K and 1 atm pressure, which is close to experimental melting point of 1360 K. The minimum free energy path (red circles in Fig. 12) on the resulting FES was calculated from the string method, and the free energy along it is shown in Fig. 13.
Figure 12.
The free energy surface in the Q6 − Q4 plane at 1300 K and 1 atm. The MFEP (red circles) is calculated from the string method based on the constructed free energy surface. The unit for free energy is eV.
Figure 13.
The free energy profile along MFEP in Q6 − Q4 space at 1300 K and 1 atm.
Different methods for estimating the melting temperature have been suggested in the literature, including the Z-method70 and two-phase melting71 to mention a few. One estimate of the melting temperature has been reported for the same EAM potential.72 In this study, a value of Tm = 1300 ± 15 K was obtained using the superheating-supercooling hysteresis approach,73 while Tm was found to be 1350 ± 20 K with the two-phase method. Finally, an average of these two values, 1325 K, was used as the melting point in this study. The small free energy difference of the solid and liquid state from our calculation (∼ 4 eV for 4000 atoms or 1 meV per atom at 1300 K) is consistent with the previous predictions of the melting point.
We observe that the solid basin is populated with a host of metastable states that are characterized by different defects (mainly, vacancy-interstitial pairs, dislocations, interstitial clusters). In order to verify independently the existence of these metastable states on the high dimensional potential energy surface, we have used the configurations from TAMD/d-AFED trajectories to perform isothermal-isobaric MD relaxations for 50 ps. A majority of these relaxed configurations, possibly corresponding to metastable states, lie inside the solid basin. These locally stable states inside the solid basin correspond to point defects – different concentrations of vacancy interstitial pairs, defect clusters, etc., and line defects such as dislocations. The presence of multiple metastable states might suggest the existence of multiple melting pathways (i.e., the system can escape from the solid basin along different pathways), and this possibility will be the subject of a future mechanistic study.We further note that the MFEP obtained and the barrier calculated from the FES pertain to a relatively small system of 4000 copper-atoms. It is, therefore, necessary to verify that this system size is sufficiently large to capture the critical nucleus under the conditions studied. Moreover, a histogram test74, 75 should be performed in order to validate the CVs chosen. These validations lie beyond the scope of the present paper, whose focus is on the new methodology, however, they will be performed in future study focused specifically on the melting process. Nevertheless, the present example demonstrates, we believe, the ability of the new methodology to sample efficiently both the solid and liquid states.
CONCLUSION
In this paper, we have shown that temperature accelerated techniques employing both the cell matrix and general order parameters as target collective variables lead to enhanced sampling both of crystal polymorphs and of solid-liquid phase transitions. Our scheme is based on a combination of the crystal-AFED approach previously introduced by Yu and Tuckerman6, 13 and the temperature accelerated MD/driven AFED25, 26 adapted for the isothermal-isobaric ensemble and applied to the aforementioned order parameters. Since the resulting free energy surfaces are of relatively high dimension, we have discussed a robust approach for analyzing these surfaces, including the extraction of free energy values at basins/saddles from the string method and the representation of the FES as a network graph.
The method was applied in studies of polymorphism in xenon crystals at high pressure and temperature using the Steinhardt order parameters as collective variables and to the solid-liquid transition in copper at 1300 K. In the xenon crystal, the expected fcc and bcc structures were recovered, and several additional structures, including a fcc state with a multiple stacking faults, were identified. For copper, we showed that the enhanced sampling approach allows the free energy surface of the solid-liquid transition to be efficiently generated from the trajectories generated.
In implementing the new approach introduced, a number of conditions need to be considered. In general, we require the system size and box shape (orthorhombic, monoclinic, triclinic, …) to accommodate any possible unit cell size and shape of the crystal under study, and the search range for the method can be constrained to restrict the search to a particular class of structures of particular interest. In an isotropic system, such as the xenon example presented, restricting the box matrix to be diagonal, corresponding to an orthorhombic unit cell, proves sufficient to explore its polymorphs. For an anisotropic system, such as a molecular crystal, where molecular orientation is an important parameter, use of a fully flexible box is generally required, as proved to be the case in our recent study of crystalline benzene.6 Given that system size N = Na × Nb × Nc × Z, where Na, Nb, and Nc are the numbers of replicas in each crystalline direction and Z is the number of asymmetric units in the unit cell of the crystal whence the sampling/search originates, we must choose Na, Nb, and Nc such that N is a common multiple of any possible Z value. In many cases involving small organic molecules, the most common Z values are 2 and 4 but rare numbers must be considered if a crystal can support an uncommon unit cell shape or space group.7 At the same time, N should be sufficiently large that structures with stable defects, such as were identified for crystalline benzene,6 can be accounted for.
We expect that the framework outlined in this paper to be a potentially powerful approach for the discovery of different polymorphs in many crystalline systems and for inducing order/disorder transitions. In addition, such an approach could also serve as a tool to supplement machine learning techniques24 in order to accelerate and aid in the process of fitting general order parameters for more complex molecular crystals, and this will constitute future work in this area.
ACKNOWLEDGMENTS
The authors are grateful to David Chandler for useful discussions. A.S. was supported by the (U.S.) Department of Energy (DOE) at the Lawrence Livermore National Laboratory under Contract No. DE-AC52-07NA27344. M.C. acknowledges the Margaret and Herman Sokol Doctoral Fellowship in the Sciences and support from the National Science Foundation (NSF) (Grant No. NSF CHE-1301314). M.E.T. acknowledges support from the National Science Foundation (Grant Nos. NSF CHE-1012545 and NSF CHE-1301314). The research of E.V.-E. was supported in part by NSF Grant No. DMS07-08140 and Office of Naval Research (ONR) Grant No. N00014-11-1-0345. The research of T.-Q. Y. was supported in part by National Institutes of Health (NIH) Grant No. R01GM100472.
References
- Bernstein J., Polymorphism in Molecular Crystals (Oxford University Press, Great Clarendon Street, Oxford, 2002). [Google Scholar]
- Woodley S. M. and Catlow R., Nat. Mater. 7, 937 (2008). 10.1038/nmat2321 [DOI] [PubMed] [Google Scholar]
- Nowell H., Frampton C. S., Waite J., and Price S. L., Acta Cryst. 62, 642 (2006). 10.1107/S0108768106012584 [DOI] [PubMed] [Google Scholar]
- Podeszwa R., Rice B. M., and Szalewicz K., Phys. Rev. Lett. 101, 115503 (2008). 10.1103/PhysRevLett.101.115503 [DOI] [PubMed] [Google Scholar]
- Kazantsev A. B., Karamertzanis P. G., Adjman C. S., Pantelides C. C., Price S. L., Galek P. T. A., Day G. M., and Cruz-Cabeza A. J., Int. J. Pharm. 418, 168 (2011). 10.1016/j.ijpharm.2011.03.058 [DOI] [PubMed] [Google Scholar]
- Yu T.-Q. and Tuckerman M. E., Phys. Rev. Lett. 107, 015701 (2011). 10.1103/PhysRevLett.107.015701 [DOI] [PubMed] [Google Scholar]
- Gelbrich T., Rossi D., and Griesser U. J., Acta Cryst. E68, o235 (2012). 10.1107/S1600536811054626 [DOI] [PMC free article] [PubMed] [Google Scholar]
- Dunitz J. D. and Scheraga H. A., Proc. Natl. Acad. Sci. U.S.A. 101, 14309 (2004). 10.1073/pnas.0405744101 [DOI] [PMC free article] [PubMed] [Google Scholar]
- Martoňák R., Laio A., and Parrinello M., Phys. Rev. Lett. 90, 075503 (2003). 10.1103/PhysRevLett.90.075503 [DOI] [PubMed] [Google Scholar]
- Raiteri P., Martoňák R., and Parrinello M., Angew. Chem., Int. Ed. 44, 3769 (2005). 10.1002/anie.200462760 [DOI] [PubMed] [Google Scholar]
- Zykova-Timan T., Raiteri P., and Parrinello M., J. Phys. Chem. B 112, 13231 (2008). 10.1021/jp802977t [DOI] [PubMed] [Google Scholar]
- Karamertzanis P. G., Raiteri P., Parrinello M., Leslie M., and Price S. L., J. Phys. Chem. B 112, 4298 (2008). 10.1021/jp709764e [DOI] [PubMed] [Google Scholar]
- Yu T.-Q. and Tuckerman M. E., Eur. Phys. J. Spec. Top. 200, 183 (2011). 10.1140/epjst/e2011-01524-x [DOI] [Google Scholar]
- Kirkpatrick S., Gelatt C. D., and Vecchi M. P., Science 220, 671 (1983). 10.1126/science.220.4598.671 [DOI] [PubMed] [Google Scholar]
- Marinari E. and Parisi G., Europhys. Lett. 19, 451 (1992). 10.1209/0295-5075/19/6/002 [DOI] [Google Scholar]
- Vorontsov-Velyaminov P. N. and Lyubartsev A. P., Mol. Simul. 9, 285 (1992). 10.1080/08927029208047434 [DOI] [Google Scholar]
- Swendsen R. H. and Wang J. S., Phys. Rev. Lett. 57, 2607 (1986). 10.1103/PhysRevLett.57.2607 [DOI] [PubMed] [Google Scholar]
- Sugita Y. and Okamoto Y., Chem. Phys. Lett. 314, 141 (1999). 10.1016/S0009-2614(99)01123-9 [DOI] [Google Scholar]
- Sorensen M. R. and Voter A. F., J. Chem. Phys. 112, 9599 (2000). 10.1063/1.481576 [DOI] [Google Scholar]
- Rosso L., Minary P., Zhu Z. W., and Tuckerman M. E., J. Chem. Phys. 116, 4389 (2002). 10.1063/1.1448491 [DOI] [Google Scholar]
- Rosso L. and Tuckerman M. E., Mol. Simul. 28, 91 (2002). 10.1080/08927020211977 [DOI] [Google Scholar]
- Steinhardt P. J., Nelson D. R., and Ronchetti M., Phys. Rev. B 28, 784 (1983). 10.1103/PhysRevB.28.784 [DOI] [Google Scholar]
- Santiso E. E. and Trout B. L., J. Chem. Phys. 134, 064109 (2011). 10.1063/1.3548889 [DOI] [PubMed] [Google Scholar]
- Geiger P. and Dellago C., J. Chem. Phys. 139, 164105 (2013). 10.1063/1.4825111 [DOI] [PubMed] [Google Scholar]
- Maragliano L. and Vanden-Eijnden E., Chem. Phys. Lett. 426, 168 (2006). 10.1016/j.cplett.2006.05.062 [DOI] [Google Scholar]
- Abrams J. B. and Tuckerman M. E., J. Phys. Chem. B 112, 15742 (2008). 10.1021/jp805039u [DOI] [PubMed] [Google Scholar]
- Ciccotti G. and Meloni S., Phys. Chem. Chem. Phys. 13, 5952 (2011). 10.1039/c0cp01335h [DOI] [PubMed] [Google Scholar]
- E W. and Engquist B., Commun. Math. Sci. 1, 87 (2003). 10.4310/CMS.2003.v1.n1.a8 [DOI] [Google Scholar]
- E W., Engquist B., Li X., Ren W., and Vanden-Eijnden E., Commun. Comput. Phys. 2, 367 (2007). [Google Scholar]
- Maragliano L., Fischer A., Vanden-Eijnden E., and Ciccotti G., J. Chem. Phys. 125, 024106 (2006). 10.1063/1.2212942 [DOI] [PubMed] [Google Scholar]
- Martyna G. J., Tobias D. J., and Klein M. L., J. Chem. Phys. 101, 4177 (1994). 10.1063/1.467468 [DOI] [Google Scholar]
- Tobias D. J., Martyna G. M., and Klein M. L., J. Phys. Chem. 97, 12959 (1993). 10.1021/j100151a052 [DOI] [Google Scholar]
- Tuckerman M. E., Alejandre J., López-Rendón R., Jochim A. L., and Martyna G. J., J. Phys. A 39, 5629 (2006). 10.1088/0305-4470/39/19/S18 [DOI] [Google Scholar]
- Yu T.-Q., Alejandre J., López-Rendón R., Martyna G. J., and Tuckerman M. E., Chem. Phys. 370, 294 (2010). 10.1016/j.chemphys.2010.02.014 [DOI] [Google Scholar]
- Martyna G. J., Tuckerman M. E., and Klein M. L., J. Chem. Phys. 97, 2635 (1992). 10.1063/1.463940 [DOI] [Google Scholar]
- Liu Y. and Tuckerman M. E., J. Chem. Phys. 112, 1685 (2000). 10.1063/1.480769 [DOI] [Google Scholar]
- Vanden-Eijnden E. and Ciccotti G., Chem. Phys. Lett. 429, 310 (2006). 10.1016/j.cplett.2006.07.086 [DOI] [PubMed] [Google Scholar]
- Bussi G. and Parrinello M., Phys. Rev. E 75, 056707 (2007). 10.1103/PhysRevE.75.056707 [DOI] [PubMed] [Google Scholar]
- Melchionna S., J. Chem. Phys. 127, 044108 (2007). 10.1063/1.2753496 [DOI] [PubMed] [Google Scholar]
- Maragliano L. and Vanden-Eijnden E., J. Chem. Phys. 128, 184110 (2008). 10.1063/1.2907241 [DOI] [PubMed] [Google Scholar]
- Kirkwood J. G., J. Chem. Phys. 3, 300 (1935). 10.1063/1.1749657 [DOI] [Google Scholar]
- Monteferrante M., Bonella S., Meloni S., and Ciccotti G., Mol. Simul. 35, 1116 (2009). 10.1080/08927020903051598 [DOI] [Google Scholar]
- E W., Ren W., and Vanden-Eijnden E., Phys. Rev. B 66, 052301 (2002). 10.1103/PhysRevB.66.052301 [DOI] [Google Scholar]
- E W., Ren W., and Vanden-Eijnden E., J. Chem. Phys. 126, 164103 (2007). 10.1063/1.2720838 [DOI] [PubMed] [Google Scholar]
- Li M., Duan M., Fan J., Han L., and Huo S., J. Chem. Phys. 139, 185101 (2013). 10.1063/1.4829768 [DOI] [PMC free article] [PubMed] [Google Scholar]
- Duff N. and Peters B., J. Chem. Phys. 135, 134101 (2011). 10.1063/1.3638268 [DOI] [PubMed] [Google Scholar]
- Quigley D. and Rodger P. M., J. Chem. Phys. 128, 154518 (2008). 10.1063/1.2888999 [DOI] [PubMed] [Google Scholar]
- Quigley D. and Rodger P. M., Mol. Simul. 35, 613 (2009). 10.1080/08927020802647280 [DOI] [Google Scholar]
- Lechner W. and Dellago C., J. Chem. Phys. 129, 114707 (2008). 10.1063/1.2977970 [DOI] [PubMed] [Google Scholar]
- Reinhardt A., Doye J. P. K., Noya E. G., and Vega C., J. Chem. Phys. 137, 194504 (2012). 10.1063/1.4766362 [DOI] [PubMed] [Google Scholar]
- Belonoshko A. B., Ahuja R., and Johansson B., Phys. Rev. Lett. 87, 165505 (2001). 10.1103/PhysRevLett.87.165505 [DOI] [PubMed] [Google Scholar]
- Belonoshko A. B., LeBacq O., Ahuja R., and Johansson B., J. Chem. Phys. 117, 7233 (2002). 10.1063/1.1507775 [DOI] [Google Scholar]
- Saija F. and Prestipino S., Phys. Rev. B 72, 024113 (2005). 10.1103/PhysRevB.72.024113 [DOI] [Google Scholar]
- Belonoshko A. B., Phys. Rev. B 78, 174109 (2008). 10.1103/PhysRevB.78.174109 [DOI] [Google Scholar]
- Ross M. and McMahan A. K., Phys. Rev. B 21, 1658 (1980). 10.1103/PhysRevB.21.1658 [DOI] [Google Scholar]
- Loubeyre P., Phys. Rev. B 37, 5432 (1988). 10.1103/PhysRevB.37.5432 [DOI] [PubMed] [Google Scholar]
- Tuckerman M. E., Yarne D. A., Samuelson S. O., Hughes A. L., and Martyna G., Comput. Phys. Commun. 128, 333 (2000). 10.1016/S0010-4655(00)00077-1 [DOI] [Google Scholar]
- PINY_MD is available as an open-source code under the Common Public License and capable of performing a wide variety of molecular dynamics and path-integral simulations under different ensembles, using forces calculated from the force fields or from “on the fly” density functional theory electronic structure calculations. It can be downloaded from homepages.nyu.edu/mt33/PINY_MD/PINY.html.
- Rahman A. and Jacucci G., Il Nuovo Cimento 4, 357 (1984). 10.1007/BF02451294 [DOI] [Google Scholar]
- Sheppard D., Xiao P., Chemelewski W., Johnson D. D., and Henkelman G., J. Chem. Phys. 136, 074103 (2012). 10.1063/1.3684549 [DOI] [PubMed] [Google Scholar]
- Cynn H., Yoo C. S., Baer B., Iota-Herbei V., McMahan A. K., Nicol M., and Carlson S., Phys. Rev. Lett. 86, 4552 (2001). 10.1103/PhysRevLett.86.4552 [DOI] [PubMed] [Google Scholar]
- See https://code.google.com/p/debyer for a brief description and related links to the Debyer package for computing x-ray and neutron powder diffraction patterns from atomic positions.
- Debye P., Ann. Phys. 351, 809 (1915). 10.1002/andp.19153510606 [DOI] [Google Scholar]
- See supplementary material at http://dx.doi.org/10.1063/1.4878665 for animations of illustrating the K-means clustering algorithm applied to the fcc and bcc lattices and of the TAMD/d-AFED trajectory of the melting and refreezing of copper.
- Mei Q. and Lu K., Prog. Mater. Sci. 52, 1175 (2007). 10.1016/j.pmatsci.2007.01.001 [DOI] [Google Scholar]
- Grimvall G., Magyari-Köpe B., Ozoliņš V., and Persson K. A., Rev. Mod. Phys. 84, 945 (2012). 10.1103/RevModPhys.84.945 [DOI] [Google Scholar]
- Lynden-Bell R. M., Van Duijneveldt J. S., and Frenkel D., Mol. Phys. 80, 801 (1993). 10.1080/00268979300102661 [DOI] [Google Scholar]
- Radhakrishnan R. and Trout B. L., Phys. Rev. Lett. 90, 158301 (2003). 10.1103/PhysRevLett.90.158301 [DOI] [PMC free article] [PubMed] [Google Scholar]
- Mishin Y., Mehl M. J., Papaconstantopoulos D. A., Voter A. F., and Kress J. D., Phys. Rev. B 63, 224106 (2001). 10.1103/PhysRevB.63.224106 [DOI] [Google Scholar]
- Belonoshko A. B., Skorodumova N. V., Rosengren A., and Johansson B., Phys. Rev. B 73, 012201 (2006). 10.1103/PhysRevB.73.012201 [DOI] [Google Scholar]
- Morris J. R., Wang C. Z., Ho K. M., and Chan C. T., Phys. Rev. B 49, 3109 (1994). 10.1103/PhysRevB.49.3109 [DOI] [PubMed] [Google Scholar]
- Zheng L., An Q., Xie Y., Sun Z., and Luo S. N., J. Chem. Phys. 127, 164503 (2007). 10.1063/1.2790424 [DOI] [PubMed] [Google Scholar]
- Luo S.-N., Strachan A., and Swift D. C., J. Chem. Phys. 120, 11640 (2004). 10.1063/1.1755655 [DOI] [PubMed] [Google Scholar]
- Bolhuis P. G., Chandler D., Dellago C., and Geissler P. L., Annu. Rev. Phys. Chem. 53, 291 (2002). 10.1146/annurev.physchem.53.082301.113146 [DOI] [PubMed] [Google Scholar]
- Peters B., J. Chem. Phys. 125, 241101 (2006). 10.1063/1.2409924 [DOI] [PubMed] [Google Scholar]


