Abstract
Fast imaging trajectories are employed in MRI to speed up the acquisition process, but imperfections in the gradient system create artifacts in the reconstructed images. Artifacts result from the deviation between k-space trajectories achieved on the scanner and their original prescription. Measuring or approximating actual k-space trajectories with predetermined gradient timing delays reduces the artifacts, but are generally based on a specific trajectory and scan orientation. A single linear time-invariant characterization of the gradient system, provides a method to predict k-space trajectories scanned in arbitrary orientations through convolution. This is done effciently, by comparing the the Fourier transforms of the input and measured waveforms of a single high-bandwidth test gradient waveform. This new method is tested for spiral, interleaved echo-planar, and 3D cones imaging, demonstrating its ability to reduce reconstructed image artifacts for various k-space trajectories.
Keywords: Fast MRI, gradient characterization, non-Cartesian imaging, k-space trajectory, gradient delays
Introduction
MR imaging applications such as cardiac imaging, functional imaging, and dynamic imaging benefit from the use of rapid acquisition methods involving time-varying gradients such as spiral imaging (1), interleaved echo-planar imaging (EPI) (2) and 3D cones imaging (3). Such methods require the MR gradient system to operate at high gradient amplitudes and slew rates to rapidly sample k-space. When operating at system limits, k-space trajectories achieved on the scanner are likely to deviate from their theoretical prescription. Without precise knowledge of the locations of sampled points in k-space, image reconstruction suffers. Unwanted deviations result in image artifacts such as ghosting, signal modulation, and geometric distortions.
k-Space deviations are due to gradient system timing errors, amplifier nonlinearities, and the presence of eddy currents. A primary effect of the imperfections is a delay from the time of the requested k-space trajectory to that achieved on the scanner. The delays often go unnoticed because for conventional Cartesian scanning trajectories, such as 2DFT imaging, a delay during readout leads to only a minor linear phase factor in reconstructed images. For non-Cartesian trajectories where the readout direction changes within or between excitations, delays can lead to a misplacement of k-space samples in a range of directions, creating more complicated effects in images than a simple linear phase modulation.
Previous works have sought to eliminate this problem by determining the actual k-space trajectories achieved on the scanner. Initially, this was achieved through some form of gradient field measurement (4–13). Trajectory estimation using gradient field measurement is suitable in cases where a relatively few number of gradient waveforms are used as in spiral imaging and echo-planar imaging (EPI). This does not hold for projection reconstruction (PR) trajectories or various 3D trajectories which may use hundreds or thousands of gradient waveforms during a single scan. The gradient waveforms are specific to the prescribed scan orientation, and measurement must be repeated with every new orientation.
Making use of the observation that k-space trajectory error is mainly manifested as a delay, Peters et al. (14) demonstrated for 2DPR imaging that the actual trajectories can be estimated with appropriate delays on the physical gradient axes. For twisted projection imaging, Atkinson (15) measured delays and characterized the eddy current effects with the use of trapezoidal gradient waveforms. Similarly for spiral imaging, Tan and Meyer (16) measured delays and characterized the eddy current effects, and Robison et al. (17) used a gradient waveform zero-crossing technique to determine delays.
As will be shown, observed delay values are dependent on the gradient waveforms. To address this issue, trajectories can be estimated by a linear time-invariant (LTI) characterization of the gradient system as was shown by Kerr et al. (18) and Cheng et al. (19), in which a series of gradient field measurements were performed to determine the MR gradient system frequency response. This work builds on this idea by developing a general framework to determine a practical LTI model. Rather than specifying a large set of inputs, a more direct characterization is based on a single broadband test gradient waveform with appropriate timing parameters to allow the calculation of a frequency response with a suitable bandwidth. The goal of the framework is to use a single system characterization to improve non-Cartesian image reconstruction quality by accurately estimating various fast imaging k-space trajectories achieved on the scanner in any scan orientation.
Theory
Reliable topologies must be used for gradient amplification to overcome the losses and nonidealities existing in circuit components to achieve accurate and rapidly switching gradient fields. During scans, the changing magnetic flux through conducting structures leads to the presence of eddy currents which in turn generate a magnetic field to oppose the change of flux expressed as:
| (1) |
This field Be(r, t), is a function of both position r and time t. The 0th order term, ΔB0,e(t), is a main magnetic field perturbation, which varies over time. The linearly varying fields Ge are indistinguishable from the fields generated directly by the gradient coils and also play a role in determining the k-space trajectory prescribed by the sequence.
Modern scanners typically attenuate the effects of eddy currents with the use of actively shielded gradients to counteract magnetic fields entering surrounding conductive structures. Further improvement can be gained using pre-emphasis filters based on a multi-exponential eddy current field model; however, filters are generally designed for conventional trajectories, aiming to eliminate long time-constant eddy current effects rather than the short time-constant effects that plague fast imaging trajectories (20,21).
Additional gradient system imperfections include spatial gradient nonlinearities, and concomitant gradient fields. These system imperfections are not corrected for by the proposed method.
The proposed model is valid only if the gradient system is reasonably linear and time-invariant. These two assumptions were examined by Brodsky et al. (22) who found that the k-space trajectory deviation due to the non-linearity of the MR gradient system did not show visually noticeable artifacts for 3DPR imaging. The validity of the LTI model has been shown in practice by Kerr et al. (18) and Cheng et al. (19) who previously employed LTI models to predict the scanner performance based on a set of sinusoidal gradient waveform inputs.
Methods
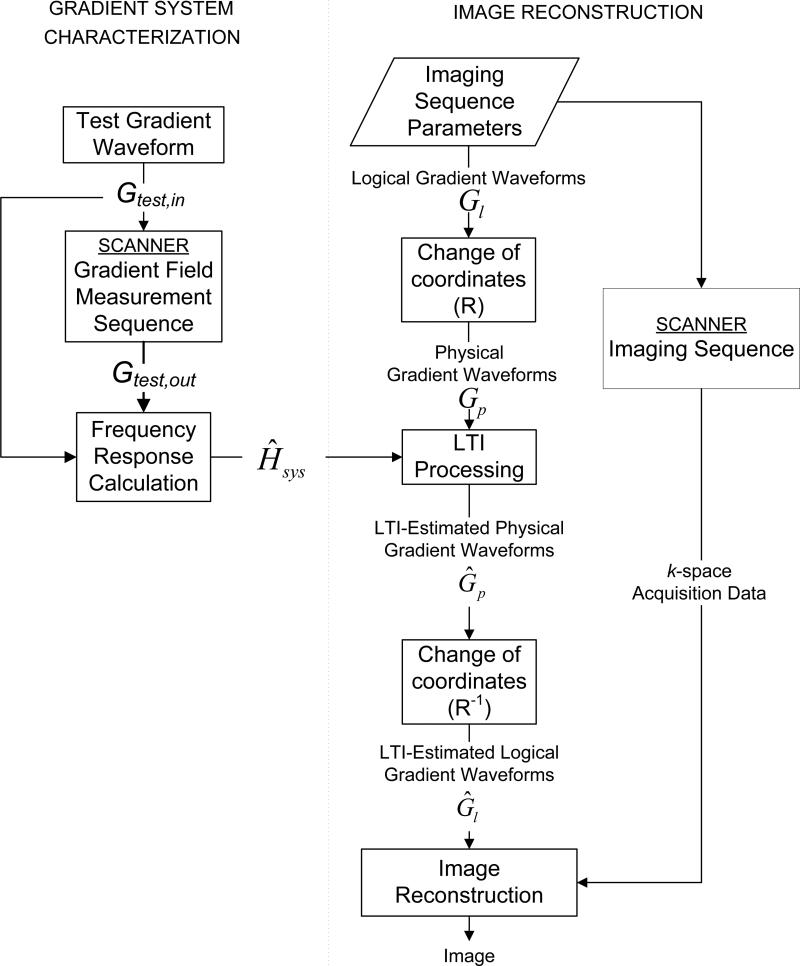
The proposed method for correcting MR gradient system imperfections can be split into two steps: 1) the three-step characterization of the gradient system with an LTI model shown on the left in Fig 1. and 2) the use of the LTI model to estimate trajectories achieved at scan time as shown on the right in Fig 1.
Figure 1.
Gradient system LTI characterization process (left) and image reconstruction process (right) using the LTI gradient system model for trajectory estimation.
Figure 2.
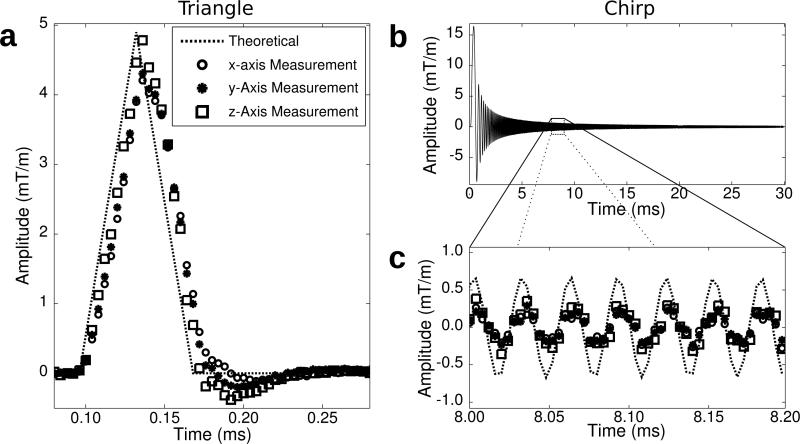
Gradient waveform measurements of the triangle (a) and chirp test gradient waveforms (b,c).
Gradient System Characterization
Gradient Field Measurement System characterization is based on observing the change from the requested to the actual gradient fields produced by the scanner. Measurement methods to determine the actual gradient fields include self-encode methods (4–7), multiple scans with a point-like phantom (8), off-isocenter methods (9–11), current measurement (12), and the use of NMR probes (13).
The proposed method uses an off-isocenter slice-selection-based measurement technique (23) for gradient field measurements for its time effciency and ease of implementation. The self-encode methods are relatively time consuming and require some form of peak fitting and interpolation to determine the measured field. The off-isocenter technique offers the advantages that it does not require any special hardware such as a specific phantom or measurement probes, and it includes the effects of eddy current based fields unlike the gradient amplifier current measurement technique. An optional k-space offset gradient described by Beaumont et al. (24) is used for k-space trajectories with large k-space extents which produce noisy results using the off-isocenter measurement technique.
Frequency Response Calculation
Frequency response measurement is commonly performed in acoustics by various methods for loudspeaker, microphone, and room acoustics characterization. (25). Single frequency sinusoidal inputs provide precise measurements of the frequency response at a specific points with the ability to reject spurious frequencies. This method was implemented previously for gradient system characterization with a set 76 sinusoidal gradient waveforms logarithmically spaced between 150-6,250 Hz (18,19). However, a full frequency response characterization requires a set of measurements making this method increasingly time-consuming for higher desired spectral resolutions or response bandwidths. An impulse input provides a direct measurement of the impulse response, but requires a low noise floor and distortion effects can not easily be identified. Müller and Massarani conclude that swept sinusoids also known as chirps are the preferred input for determining frequency responses in the audio context based on their ease of implementation and the ability to isolate distortion in post-processing (25).
The proposed method approximates the gradient system frequency response in a single step using the Fourier transforms of the input (theoretical) and output (measured) signals of high bandwidth impulse-like or chirp test gradient waveforms. Note that in this work, bandwidth refers to the support of a gradient waveform's Fourier transform, not the bandwidth of nuclear spin precession frequencies created by the gradient field.
| (2) |
In Eq. [2], Gtest,in is the input to the LTI system, Gtest,in is the output, andĤsys is an approximation of the frequency response of the LTI system. A low-pass filter Hlpf is used to remove regions of the calculated frequency response dominated by noise.
Test Gradient Waveforms
The choice of a test gradient waveform is constrained by the gradient system's amplitude and slew rate limits. Test gradient waveforms exceeding the hardware slew rate limit, must be scaled down in amplitude, resulting in noisier measurements which in the frequency domain is particularly a problem at high frequencies where noise can easily dominate the signal power. The bandwidth of the calculated gradient frequency response Ĥsys is determined by the bandwidth of the test input gradient waveform Gtest,in. Because high bandwidth signals tend to have larger first derivatives, a trade-off exists between maximizing the test gradient waveform bandwidth and obtaining low noise measurements.
Sinc, Gaussian, and triangle waveforms can be chosen as test gradient waveforms to represent impulse-like inputs while a chirp waveform can be chosen to sweep a wide bandwidth of frequencies.
As with the sinusoids, the chirp must be scaled appropriately to remain within the scanner's slew rate limit. For a chirp function linearly sweeping the frequency range f1 to f2 over a duration T , the instantaneous frequency f is:
| (3) |
The chirp gradient waveform Gc with amplitude A is:
| (4) |
The slew rate:
| (5) |
has an envelope:
| (6) |
The slew-rate-limited chirp gradient waveform, Gsrlc, for a maximum slew rate, smax, is then calculated as:
| (7) |
Trajectory Estimation Using the LTI Model
In the second step of the proposed method, the LTI model is used to estimate the actual trajectories achieved on the scanner for use in an image reconstruction algorithm as shown in Fig. 1. This can be done in one of two ways, either by fully estimating the gradient waveforms through convolution with the calculated impulse response, or by delaying the original trajectory by delay values predicted by the LTI model. The second approach may be useful for trajectories using gradient waveforms with sharp transitions or readout during a constant gradient such as in EPI. Typical gradient delay models essentially use this same approach, implicitly using an LTI model with a unity magnitude response and a linear phase response.
For both approaches, the gradient system is characterized for each physical gradient axis; therefore, waveform components along each orthogonal axis are separately. Processing the waveforms follows Tan and Meyer's Anisotropic Delay Model replacing the delay operation with a convolution with the appropriate time-domain system response function (16).
For the LTI-based delay approach, delays are calculated from the original to the fully estimated physical gradient waveforms and then applied to the original waveforms, before returning to the logical coordinate system.
Experiments
Tests were run on 1.5 T GE Signa Excite and GE Signa HDxt scanners with a cardiac resonator module (CRM) gradient system with maximum gradient amplitudes of 40 mT/m and 50 mT/m, respectively, and a maximum slew rate of 150 mT/m/ms for both scanners.
The design parameters for the spiral trajectory were: 16 interleaves, 24×24 cm2 field of view (FOV), 0.86×0.86 mm2 in-plane voxel size, and 17.4 ms readout duration. An additional single-shot spiral trajectory was included for field map measurements with parameters: 24×24 cm2 FOV, 5.5×5.5 mm2 in-plane voxel size, and 11.5 ms readout duration.
The design parameters for the interleaved bipolar EPI trajectory were: 30 interleaves, 24×24 cm2 FOV, 1×1 mm2 in-plane voxel size, and 12.5 ms readout duration.
The design parameters for the 3D cones trajectory were: 8942 total interleaves based on a set of 32 waveforms, 24×24×16 cm3 FOV, 1.2×1.2×1.25 mm3 voxel size, 1.9—2.2 ms readout durations.
All gradient waveforms were designed for a maximum gradient amplitude of 40 mT/m and slew rate of 150 mT/m/ms.
Phantom and head images were acquired on the Signa Excite scanner using spoiled gradient echo sequences with TE/TR = 2/34 ms, 35° flip angle, and ±125 kHz receiver bandwidth. The spiral and EPI sequences used a slice thickness of 5 mm and 16 averages, while the 3D cones sequence used a slab thickness of 16 cm with one average. The spiral field maps were acquired with a ΔTE of 4.608 ms, and the EPI sequence implemented echo time shifting (2).
For phantom experiments, the spiral and 3D cones sequences were scanned in the axial plane. The EPI sequence was scanned in an oblique plane to test the ability of the trajectory estimation methods to deal with a rotated scan orientation. For in-vivo experiments, all sequences were run in the axial plane.
Gradient fields were measured using the off-isocenter measurement sequence with parameters: TR = 200 ms, four 2-mm slices at ±3, ±1 cm off-isocenter, and ±125 kHz receiver bandwidth. Depending on the gradient waveform duration, TE values ranged from 13 to 37 ms, and the number of averages ranged from 3 to 16 averages/slice. k-Space offset gradients were implemented to reduce the presence of noise in the measurements when necessary. The same gradient field measurement sequence was used both for system characterization and trajectory measurements.
For LTI characterization, both triangle and slew-rate-limited chirp test gradient waveforms were implemented to determine the gradient system frequency response. A 5 mT/m amplitude, 72 μs duration triangle waveform corresponding to a full width at half maximum bandwidth of 33.5 kHz was tested to represent an impulse-like input. The triangle waveform was preferred over the sinc and Gaussian waveforms, because it allowed the highest maximum gradient amplitude for a given characterization bandwidth. A low-pass filter was applied to the calculated frequency response to avoid unusable regions surrounding the nulls of the triangle waveform's Fourier transform. The cut-off frequency was set to 17 kHz to avoid affecting the imaging gradient waveforms whose spectral contents were mostly below 5 kHz. The designed chirp waveform swept the full 125 kHz of the receiver bandwidth over a duration of 30 ms. In post-processing, the measured chirp waveform was time segmented using a Hanning window and passed through a Hamming-window-based linear-phase bandpass filter centered at the instantaneous chirp frequency with a bandwidth of 15 kHz to reject harmonic distortion and other nonlinear components present in the measurement. The full ±125 kHz characterization of the frequency response with the chirp was not necessary for accurate trajectory estimation, but beneficially eliminated the need for a low-pass filter to remove regions of the response dominated by noise. Since, the imaging gradient waveform spectra occupy a small fraction of the full receiver bandwidth, successful trajectory estimation is possible with smaller frequency sweep ranges and lower sampling rates which can be chosen according to the MR system in use.
Comparison Estimation Methods
Two additional trajectory estimation methods were tested and compared with the proposed method. First, for reference, gradient measurements were performed for each interleaf of all the trajectories to represent the actual trajectories achieved on the scanner. Due to the large number of interleaves of the 3D cones trajectories, measurements were taken from only the 32 basis gradient waveforms from which all the interleaves are generated. Second, delays from the prescribed to measured gradient waveforms were calculated using a second-order interpolation of the cross-correlation function (26). Trajectories were then estimated by delaying the original trajectories by the average delay value for each axis. In this work, this is referred to as the average delay model.
Images were reconstructed through gridding (27) using the originally designed trajectories and those estimated using the average delay, measurement, and proposed methods. The sampling density of the estimated trajectories was recalculated using an iterative method for the spiral trajectory (28) and based on analytical equations for the 3D cones trajectory. Spiral images were also corrected for off-resonance artifacts (29).
Results
LTI System Characterization
An LTI gradient system model was calculated using both triangle and chirp test gradient waveforms to observe the dependence of characterization on the test gradient input. Figure 2 shows the waveforms resulting from the gradient field measurement sequence. On the different axes, the measured triangle waveforms differ in terms of delay, peak amplitude, and undershoot following the waveform. A noticeable distinction can be seen between the two transverse axes, x and y, and the longitudinal axis, z. Due to the shape of the bore, different gradient coil geometries are implemented for transverse and longitudinal axes. Therefore, it is expected that the performance of the two sets of gradient coils will vary. For the chirp waveforms, it is more diffcult to distinguish the performance of the gradient coils in the time domain, compared to the triangle waveforms.
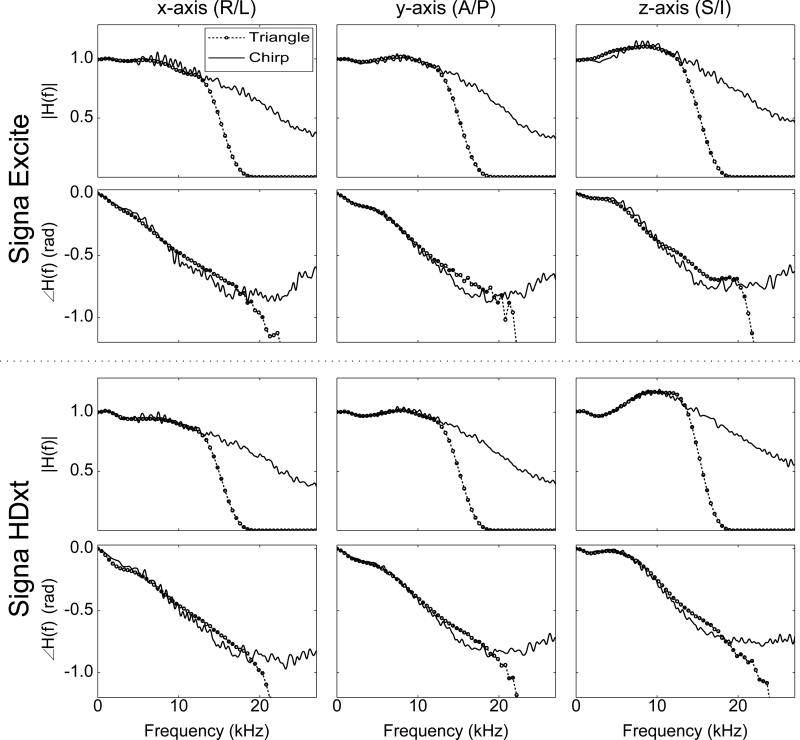
Figure 3 shows that the frequency responses of the gradient axes exhibit the same overall shape, irrespective of the two test gradient waveforms and two scanners, although less agreement between the two waveform models is seen above 10 kHz. As seen in the time domain plots in Fig 2., the responses of the transverse x− and y−axes differ from that of the longitudinal z-axis. Note that the Fourier transform of the chosen triangle waveform has a null at 28 kHz. The more pronounced low-pass nature of the triangle waveform based frequency responses is due to the low-pass filter which excludes the noise dominated region caused by the null.
Figure 3.
Calculated gradient system frequency responses for the Signa Excite (top section) and Signa HDxt (bottom section) scanners. Each section shows magnitude (1st row) and phase (2nd row) responses for each physical axis
As stated previously, a primary result of gradient system imperfections is a delay from the desired trajectories, so the critical information of the frequency response is found in its phase response which shows how various frequency components of a signal are delayed. In the ideal case, the phase response would be zero meaning no system delay or distortion of gradient waveforms. Trajectory estimation methods based on a single delay value for each axis assume frequency responses with linear phase. Figure 3 shows that the phase responses are roughly linear up to about 20 kHz, and hence, a single delay value for each axis may be a reasonable approximation for limited frequency ranges. However, the slightly nonlinear phase responses within this range show that overall, the gradient system produces delays dependent on the gradient waveforms associated with a trajectory.
Fast Imaging Trajectory Measurements
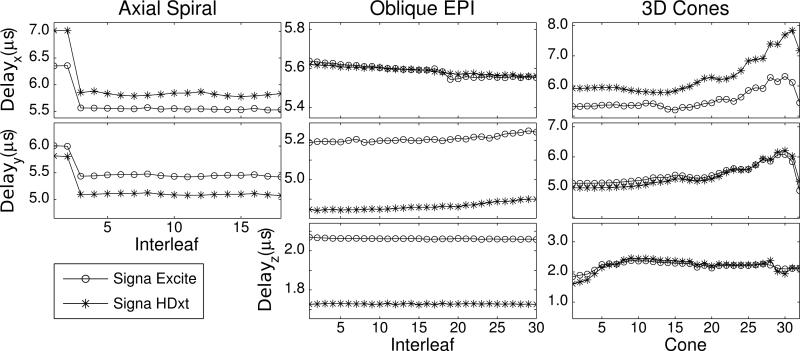
For spiral and EPI trajectories, the measured delay values remain essentially constant for all interleaves as shown in Fig. 4. There is a discrepancy for the first two spiral interleaves which correspond to the single-shot spirals for a field map acquisition. The rest of the interleaves are based on the linear combination of two waveforms. If both waveforms exhibit the same delay on their original axes, all linear combinations of the two waveforms will have roughly the same delay. The same holds for EPI, although the waveforms change slightly with each interleaf to obtain proper phase encoding. Measured delays vary for the 3D cones trajectory which has a more complex waveform design process to effciently sample a 3D sphere in k-space.
Figure 4.
Measured gradient delays for spiral (left), EPI (middle), and 3D cones (right) trajectories for the x−, y−, and z−axes.
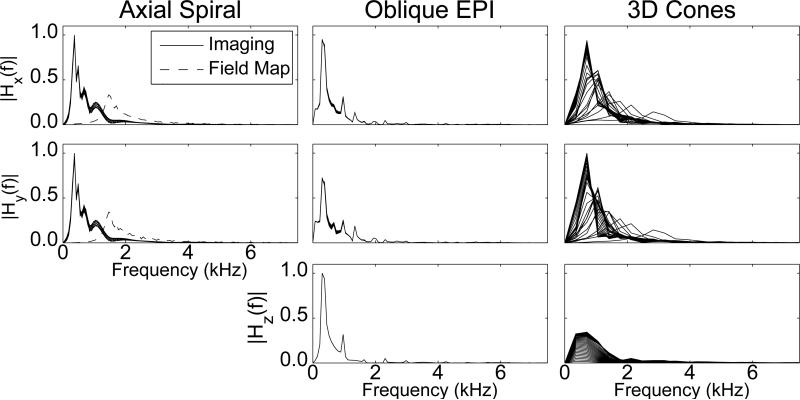
The non-linear gradient system phase-responses shown in Fig. 3 suggest that the observed delays are related to the spectral content of the imaging gradient waveforms. The spiral and EPI gradient waveforms, which exhibit a constant delay for all interleaves per axis, also have spectra which do not change with the interleaf as shown in Fig. 5. The field map spiral, however, oscillates at a higher frequency than the imaging spirals resulting in a larger delay. The same result is seen for the 3D cones gradient waveforms which produce larger delays for faster oscillating waveforms.
Figure 5.
Frequency spectra of the gradient waveforms corresponding to the tested imaging trajectories. All interleaves are shown for the spiral and EPI trajectories. All basis waveforms are shown for the 3D cones trajectory.
The average deviation between the estimated and measured trajectories was calculated to compare the performance of the estimation methods. In non-Cartesian image reconstruction processes, the acquired data is typically resampled onto a grid in k-space. Taking this into account, the average deviation was normalized by a grid spacing of Δk = 1/FOV as shown in Table 1. An error value of 1 corresponds to a trajectory in which on average, the k-space deviation is one grid point. All estimation methods considerably reduce the deviation present on each axis with the chirp-based LTI model providing the lowest deviation for all trajectories.
Table 1.
Average k-space deviations from the measured trajectory to the original trajectory and to trajectories estimated with the average delay and LTI models based on triangle and chirp waveforms.
| Axial Spiral | Oblique EPI | 3D Cones | |||||||||
|---|---|---|---|---|---|---|---|---|---|---|---|
| x | y | Overall | x | y | z | Overall | x | y | z | Overall | |
| Signa Excite | |||||||||||
| Original | 0.83 | 0.80 | 1.28 | 0.76 | 0.55 | 0.30 | 1.04 | 0.64 | 0.64 | 0.18 | 1.02 |
| Average Delay | 0.21 | 0.14 | 0.28 | 0.24 | 0.12 | 0.12 | 0.33 | 0.10 | 0.09 | 0.10 | 0.19 |
| LTI (triangle) | 0.13 | 0.05 | 0.15 | 0.25 | 0.10 | 0.08 | 0.31 | 0.10 | 0.06 | 0.04 | 0.14 |
| LTI Delay (chirp) | 0.21 | 0.14 | 0.27 | 0.23 | 0.12 | 0.13 | 0.34 | 0.10 | 0.08 | 0.09 | 0.18 |
| LTI (chirp) | 0.09 | 0.04 | 0.10 | 0.20 | 0.05 | 0.09 | 0.24 | 0.07 | 0.05 | 0.04 | 0.11 |
|
Signa HDxt | |||||||||||
| Original | 0.83 | 0.74 | 1.21 | 0.70 | 0.50 | 0.21 | 0.93 | 0.72 | 0.62 | 0.17 | 1.06 |
| Average Delay | 0.14 | 0.15 | 0.22 | 0.14 | 0.11 | 0.09 | 0.23 | 0.11 | 0.08 | 0.08 | 0.18 |
| LTI (triangle) | 0.38 | 0.19 | 0.45 | 0.28 | 0.16 | 0.16 | 0.39 | 0.33 | 0.13 | 0.09 | 0.40 |
| LTI Delay (chirp) | 0.14 | 0.14 | 0.21 | 0.15 | 0.11 | 0.09 | 0.23 | 0.09 | 0.07 | 0.08 | 0.16 |
| LTI (chirp) | 0.08 | 0.04 | 0.09 | 0.08 | 0.09 | 0.09 | 0.19 | 0.08 | 0.04 | 0.04 | 0.12 |
Values are in units of 1/FOV. The overall error is calculated in 2D k-space for the spiral and EPI trajectories and 3D k-space for the 3D cones trajectory.
Image Comparison
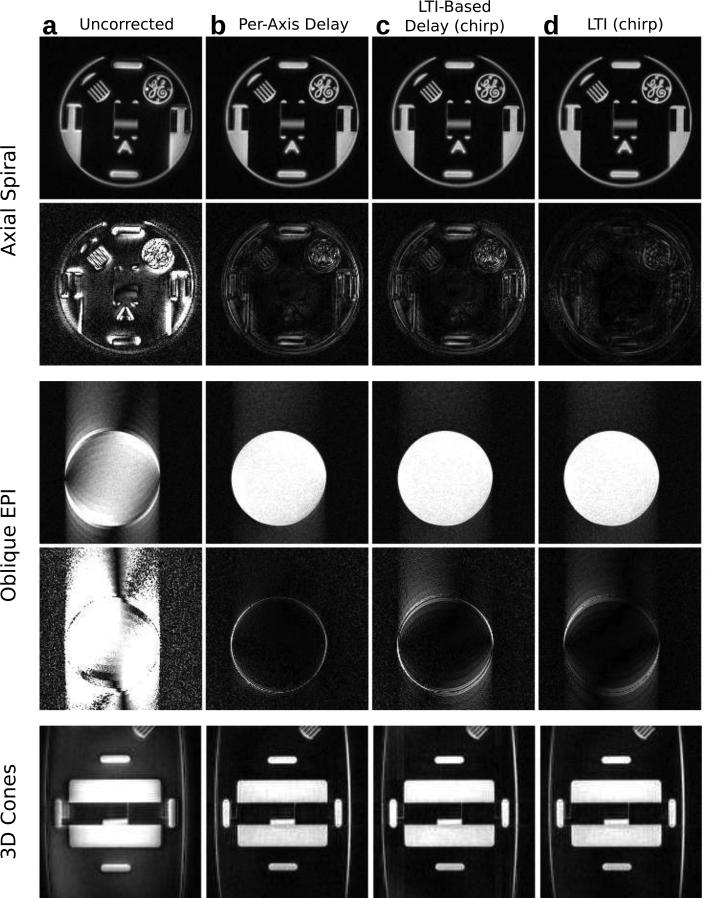
Figure 6 shows the phantom image reconstructions with and without trajectory estimation. Spiral and 3D cones images reconstructed with the original trajectory show blurring, a slight rotation artifact, and signal pileup at transitions between high and low signal regions. Additional artifacts in the 3D cones image are signal loss on the left side of the image and extra overall background signal. In the EPI images, the k-space deviations mainly cause a ghosting artifact. Using the trajectory estimation methods, the images are greatly improved as shown by the difference images based on a comparison with reconstructions with measured trajectories. The scaled difference images reveal that in terms of root mean square error (RMSE), the chirp-based LTI model performs best for the spiral images. There is no clear best estimation method in terms of RMSE for the EPI images between the average delay and chirp-based models, although the average delay model difference image appears to show less artifacts.
Figure 6.
Axial spiral (top), oblique EPI (middle), and 3D cones phantom images (bottom) reconstructed using the original trajectories (a) and trajectories estimated using the average delay (b), LTI-based delay (c), and full LTI-estimated (d) models. Difference images for spiral and EPI are made from a comparison to a reference image reconstructed based on measured trajectories and are scaled by 8x.
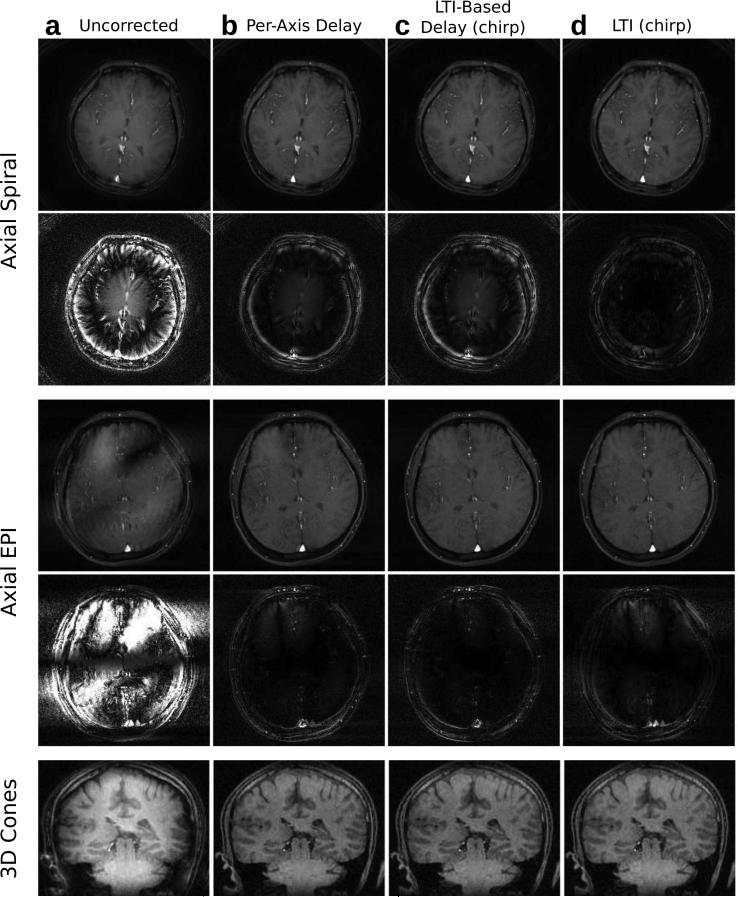
Head images shown in Fig. 7 were acquired using all three trajectories. The main effects of the gradient system imperfections on spiral and 3D cones images were seen as a signal drop off in the peripheral regions of the image and blurring of small structures such as vessels. Again, the uncorrected EPI image suffers from a ghosting artifact. The estimation methods greatly improve image quality in a similar manner as the phantom experiments. Again, the chirp-based LTI model provides the lowest RMSE for the spiral images, while all three estimation methods provide similar improvements in image quality for the EPI images. The difference images show, however, that the image artifacts vary slightly with the estimation method. A summary of the image RMSE values are shown in Table 2 for spiral and EPI images.
Figure 7.
Axial spiral (top), axial EPI (middle), and 3D cones head images (bottom) reconstructed using the original trajectories (a) and trajectories estimated using the average delay (b), LTI-based delay (c), and full LTI-estimated (d) models. Difference images for spiral and EPI are made from a comparison to a reference image reconstructed based on measured trajectories and are scaled by 8x.
Table 2.
RMSE between images reconstructed with estimated trajectories and images reconstructed with measured trajectories.
| Trajectory / Object | Average Delay | LTI-Based Delay (chirp) | Full LTI (chirp) |
|---|---|---|---|
| Axial Spiral / Phantom | 0.32 | 0.31 | 0.20 |
| Oblique EPI / Phantom | 0.09 | 0.13 | 0.08 |
| Axial Spiral / Brain | 0.36 | 0.41 | 0.22 |
| Axial EPI / Brain | 0.18 | 0.18 | 0.17 |
RMSE values are normalize by the error of images reconstructed with the original trajectories.
Discussion
k-Space trajectory deviations, although benign for conventional imaging methods, have been shown to cause significant image artifacts for non-Cartesian trajectories. As shown in Fig. 7, for spiral and 3D cones trajectories, k-space trajectory deviations lead to low signal in the outer regions of the image. This is a problem concerning acquired k-space data near the origin. Delays present in the gradient system delay the start time of spatial encoding. For spiral and 3D cones trajectories, which begin sampling at the k-space origin, the DC k-space sample may be acquired multiple times and mapped to multiple locations in k-space during reconstruction. This spreading of the DC value adds a weighting in the image domain. Other artifacts present in spiral and 3D cones trajectories include rotation and blurring. These trajectories have a large circumferential component; thus the effect of delays manifests as a rotation of trajectories leading to a rotation in the image domain. These trajectories also contain a radial component; therefore in addition to the rotation, blurring occurs in images. For the bipolar EPI trajectory, the k-space deviations in the readout direction result in a ghosting artifact due to a misalignment of k-space data in the positive and negative readout directions.
The use of measured trajectories in image reconstruction reduces the aforementioned artifacts, but trajectory measurement can be a time-consuming process. The axial spiral, oblique EPI, and 3D cones trajectories consisted of 16, 30, and 8942 interleaves, respectively. The measurement process must be repeated with changes in the scan orientation, because the physical gradient waveforms depend on the scan orientation. The more general average delay model can be applied to multiple scan orientations, although with slightly reduced image quality. However, as shown in Fig. 4, delay values which depend on the trajectory and scan orientation must be determined through measurements or manual estimation. The use of a trajectory and orientation-independent characterization with the proposed chirp-based LTI model is able to provide equivalent image quality improvement as the average delay model in the case of the EPI trajectory or improved image quality in the case of the spiral trajectory. The proposed LTI model builds on previous models, providing a more direct and effcient means of calculating the gradient system frequency response based on a single test gradient waveform rather than choosing a set of frequencies to sample.
Although the proposed method successfully reduces the presence of image artifacts, it is limited by the dependence of the LTI model on the chosen test gradient waveform. Visually, the calculated frequency responses slightly differ between the triangle- and chirp-based LTI models, but the chirp-based model outperforms the triangle-based model in matching the measured trajectories. The triangle-based model is on par with the chirp-based model on the Signa Excite scanner, but less accurate on the Signa HDxt scanner. For system characterization, the impulse-like triangle waveform requires a low noise floor in the data acquired with the gradient field measurement sequence to produce accurate frequency responses. The ripples in the measured signal following the triangle waveform play an important role in shaping the frequency response and are easily obstructed by noise and transient effects due to their small amplitudes. A key feature of the chirp waveform is its duration which can easily be designed to last tens of milliseconds, much longer than the duration of the gradient system impulse responses, which were found to be less than one millisecond. This makes the chirp-based model more robust to time variant effects (25).
Simply observing the k-space deviations in estimating the measured trajectories would suggest that the chirp-based model would consistently provide the best images. However, most of the signal in k-space data is located near the origin, so image quality is determined mainly by the accuracy of trajectory estimation at points near the origin in k-space. Error values shown in Table 1, however, reflect the estimation accuracy throughout all of k-space.
The chirp-based LTI model, however, does provide the best images for the spiral trajectory with chirp-like gradient waveforms with each imaging waveform sweeping down from about 5 to 1 kHz. The range of group delays experienced by the gradient waveforms are best captured by the chirp-based LTI model. The same improvement does not hold for the EPI trajectory in which all the estimation methods provide roughly the same results. Since acquisition is performed during regions of constant gradients, it is not expected that the LTI models would provide a noticeable advantage over the average delay model. In some cases, the triangle-based LTI model is quite inaccurate in tracking the gradient waveform during the constant regions and better results can be achieved by applying delays estimated by the model.
The LTI model bandwidth also plays a factor in estimation performance, and can be increased, but at cost of increased noise. For the triangle-based model, the waveform bandwidth is increased by decreasing the pulse width, necessitating a reduced amplitude due to the slew limit. This generates a noisier, less accurate frequency response. The same holds for the chirp waveform based model, in which increasing the waveform's bandwidth also increases slew demands. Possible options to increase the frequency response bandwidth include extending the response by fitting appropriate functions to the magnitude and phase responses or using a set of test gradient waveforms (30).
In conjunction with a delay model, eddy current field models have been used by Tan and Meyer (16) and Atkinson et al. (15) to improve gradient waveform estimation. Without precise knowledge of the field generated by the gradient coils, the remaining error between the prescribed and actual trajectories is attributed to eddy currents. In the aforementioned works, the time constants and amplitudes corresponding to the decaying exponentials of the eddy current impulse response are calculated and used in trajectory estimation. Direct analysis of the eddy current effects is not implemented in the proposed method. Rather, the effects of eddy currents are implicitly incorporated into the LTI model, because in measuring gradient fields, the gradient and linear eddy current based fields are indistinguishable. Further work could be done to expand the LTI model to also provide direct characterization of linear eddy current effects.
Conclusion
A simple method was developed to use a single LTI model to estimate multiple k-space trajectories achieved on the scanner in arbitrary scan orientations. It was shown that with LTI-estimated trajectories, artifacts created in the image reconstruction process could be reduced significantly for spiral, interleaved EPI and 3D cones trajectories. The method is not limited to these three trajectories and further work includes testing the model for a variety of non-Cartesian selective excitation and fast MR imaging trajectories.
ACKNOWLEDGEMENTS
We would like to thank the Atsushi Takahashi for helpful conversations about the gradient system and the referees for providing insightful and pertinent comments. This work was supported by NIH R01 HL075803, R01 HL039297, T32 HL007846 and GE Health Care.
This work was supported by NIH R01 HL075803, R01 HL039297, T32 HL007846 and GE Healthcare.
References
- 1.Ahn CB, Kim JH, Cho ZH. High-speed spiral-scan echo planar NMR imaging-I. IEEE Trans Med Imaging. 1986;5:2–7. doi: 10.1109/TMI.1986.4307732. [DOI] [PubMed] [Google Scholar]
- 2.Cho ZH, Ahn CB, Kim JH, Lee YE, Mun CW. Phase error corrected interlaced echo planar imaging.. 6th Annual Meeting, SMRM; New York. 1987.p. 912. [Google Scholar]
- 3.Gurney PT, Hargreaves BA, Nishimura DG. Design and analysis of a practical 3D cones trajectory. Magn Reson Med. 2006;55:575–582. doi: 10.1002/mrm.20796. [DOI] [PubMed] [Google Scholar]
- 4.Onodera T, Matsui S, Sekihara K, Kohno H. A method of measuring field-gradient modulation shapes. Application to high-speed NMR spectroscopic imaging. Journal of Physics E: Scientific Instruments. 1987;20:416–419. [Google Scholar]
- 5.Takahashi A, Peters T. Compensation of multi-dimensional selective excitation pulses using measured k-space trajectories. Magn Reson Med. 1995;34:446–456. doi: 10.1002/mrm.1910340323. [DOI] [PubMed] [Google Scholar]
- 6.Papadakis NG, Wilkinson AA, Carpenter TA, Hall LD. A general method for measurement of the time integral of variant magnetic field gradients: application to 2D spiral imaging. Magn Reson Imaging. 1997;15:567–578. doi: 10.1016/s0730-725x(97)00014-3. [DOI] [PubMed] [Google Scholar]
- 7.Alley MT, Pauly JM, Sommer FG, Pelc NJ. Angiographic imaging with 2D RF pulses. Magn Reson Med. 1997;37:260–267. doi: 10.1002/mrm.1910370220. [DOI] [PubMed] [Google Scholar]
- 8.Mason GF, Harshbarger T, Hetherington HP, Zhang Y, Pohost GM, Twieg DB. A method to measure arbitrary k-space trajectories for rapid MR imaging. Magn Reson Med. 1997;38:492–496. doi: 10.1002/mrm.1910380318. [DOI] [PubMed] [Google Scholar]
- 9.Duyn JH, Yang Y, Frank JA, van der Veen JW. Simple correction method for k-space trajectory deviations in MRI. J Magn Reson. 1998;132:150–153. doi: 10.1006/jmre.1998.1396. [DOI] [PubMed] [Google Scholar]
- 10.Zhang Y, Hetherington HP, Stokely EM, Mason GF, Twieg DB. A novel k-space trajectory measurement technique. Magn Reson Med. 1998;39:999–1004. doi: 10.1002/mrm.1910390618. [DOI] [PubMed] [Google Scholar]
- 11.Latta P, Gruwel MLH, Volotovskyy V, Weber MH, Tomanek B. Simple phase method for measurement of magnetic field gradient waveforms. Magn Reson Imaging. 2007;25:1272–1276. doi: 10.1016/j.mri.2007.02.002. [DOI] [PubMed] [Google Scholar]
- 12.Spielman DM, Pauly JM. Spiral imaging on a small-bore system at 4.7T. Magn Reson Med. 1995;34:580–585. doi: 10.1002/mrm.1910340414. [DOI] [PubMed] [Google Scholar]
- 13.Barmet C, Zanche ND, Prüssmann KP. Spatiotemporal magnetic field monitoring for MR. Magnetic Resonance in Medicine. 2008;60:187–197. doi: 10.1002/mrm.21603. [DOI] [PubMed] [Google Scholar]
- 14.Peters DC, Derbyshire JA, McVeigh ER. Centering the projection reconstruction trajectory: reducing gradient delay errors. Magn Reson Med. 2003;50:1–6. doi: 10.1002/mrm.10501. [DOI] [PMC free article] [PubMed] [Google Scholar]
- 15.Atkinson IC, Lu A, Thulborn KR. Characterization and correction of system delays and eddy currents for MR imaging with ultrashort echo-time and time-varying gradients. Magn Reson Med. 2009;62:532–537. doi: 10.1002/mrm.22016. [DOI] [PubMed] [Google Scholar]
- 16.Tan H, Meyer CH. Estimation of k-space trajectories in spiral MRI. Magn Reson Med. 2009;61:1396–1404. doi: 10.1002/mrm.21813. [DOI] [PMC free article] [PubMed] [Google Scholar]
- 17.Robison RK, Devaraj A, Pipe JG. Fast, simple gradient delay estimation for spiral MRI. Magn Reson Med. 2010;63:1683–1690. doi: 10.1002/mrm.22327. [DOI] [PubMed] [Google Scholar]
- 18.Kerr AB. PhD thesis. Stanford University; United States – California: 1998. Real-time interactive magnetic resonance imaging. [Google Scholar]
- 19.Cheng J, Gagoski B, Bolar D, Triantafyllou C, Hamm M, Krueger G, Adalsteinsson E. Gradient linear system modeling using gradient characterization.. Proceedings 16th Scientific Meeting, International Society for Magnetic Resonance in Medicine; Toronto. 2008.p. 1155. [Google Scholar]
- 20.Jehenson P, Westphal M, Schu N. Analytical method for the compensation of eddy-current e ects induced by pulsed magnetic field gradients in NMR systems. Journal of Magnetic Resonance (1969) 1990;90:264–278. [Google Scholar]
- 21.Van Vaals JJ, Bergman AH. Optimization of eddy-current compensation. Journal of Magnetic Resonance (1969) 1990;90:52–70. [Google Scholar]
- 22.Brodsky EK, Samsonov AA, Block WF. Characterizing and correcting gradient errors in non-Cartesian imaging: Are gradient errors linear time-invariant (LTI)? Magn Reson Med. 2009 doi: 10.1002/mrm.22100. [DOI] [PMC free article] [PubMed] [Google Scholar]
- 23.Gurney P. PhD thesis. Stanford University; United States – California: 2007. Magnetic resonance imaging using a 3D cones k-space trajectory. [Google Scholar]
- 24.Beaumont M, Lamalle L, Segebarth C, Barbier EL. Improved k-space trajectory measurement with signal shifting. Magn Reson Med. 2007;58:200–205. doi: 10.1002/mrm.21254. [DOI] [PubMed] [Google Scholar]
- 25.Müller S, Massarani P. Transfer-function measurement with sweeps. J. Audio Eng. Soc. 2001;49:443–471. [Google Scholar]
- 26.Jacovitti G, Scarano G. Discrete time techniques for time delay estimation. IEEE Transactions on Signal Processing. 1993;41:525–533. [Google Scholar]
- 27.Beatty PJ, Nishimura DG, Pauly JM. Rapid gridding reconstruction with a minimal oversampling ratio. IEEE Trans Med Imaging. 2005;24:799–808. doi: 10.1109/TMI.2005.848376. [DOI] [PubMed] [Google Scholar]
- 28.Johnson KO, Pipe JG. Convolution kernel design and e cient algorithm for sampling density correction. Magn Reson Med. 2009;61:439–447. doi: 10.1002/mrm.21840. [DOI] [PubMed] [Google Scholar]
- 29.Cheng JY, Santos JM, Pauly JM. Fast concomitant gradient field and field inhomogeneity correction for spiral cardiac imaging. Magn Reson Med. 2011 doi: 10.1002/mrm.22802. (In press) [DOI] [PMC free article] [PubMed] [Google Scholar]
- 30.Vannesjö J, Häberlin M, Kasper L, Barmet C, Prüssmann KP. A method for characterizing the magnetic field response of a gradient system.. Proceedings 18th Scientific Meeting, International Society for Magnetic Resonance in Medicine; Stockholm. 2010.p. 1536. [Google Scholar]


