

Abstract
Aims: Systemic lupus erythematosus (SLE) patients' peripheral blood lymphocytes (PBL) show mitochondrial dysfunction and oxidative stress. To determine the electrochemical bases of mitochondrial dysfunction, we measured electron transport chain (ETC) activity and its regulation by N-acetylcysteine (NAC) that reversed glutathione depletion and improved disease activity in SLE. ETC activity was assessed in PBL of 69 SLE patients and 37 healthy donors. Negatively isolated T cells were examined in 7 SLE patients, 11 healthy donors, and 10 nonlupus inflammatory arthritis (IA) donors. Results: O2 consumption (in nmol/ml/min) by lupus PBL was increased at baseline (SLE: 2.492±0.196, control: 2.137±0.153; p=0.027) and with complex IV substrates (SLE: 7.722±0.419, control: 7.006±0.505; p=0.028). SLE PBL consumed more O2 upon in-chamber T-cell activation (p=0.012). After overnight T-cell stimulation, ETC activity of SLE PBL was 2.27-fold increased through complex I (SLE: 1.606±0.273, control: 0.709±0.169; p=0.001) and, to a lesser extent, through complex IV. Likewise, complex I activity was elevated in negatively isolated “untouched” T cells of SLE patients (1.816±0.180) relative to healthy controls (0.917±0.094; p=0.0003) and IA disease controls studied in parallel (1.057±0.199; p=0.0308). NAC diminished O2 consumption through complex I and H2O2 levels both in SLE and in control PBL. Innovation: O2 consumption was found to be increased in SLE patients' PBL relative to control subjects evaluated in parallel. ETC complex I is identified as the main source of oxidative stress in SLE. Conclusions: Lupus PBL exhibit increased O2 consumption through mitochondrial ETC complex I that is inhibited by NAC, which may have therapeutic efficacy through reducing oxidative stress in SLE. Antioxid. Redox Signal. 21, 56–65.
Introduction
Systemic lupus erythematosus (SLE) is an autoimmune disease of unknown origin that often elicits debilitating and potentially life-threatening manifestations. Current therapies are only partially effective and carry significant side effects (13). The pathogenesis of SLE involves dysfunction of T cells that exhibit elevated mitochondrial transmembrane potential (ΔΨm) or mitochondrial hyperpolarization (MHP), increased mitochondrial mass, and diminished ATP levels. Mitochondrial dysfunction is associated with oxidative stress (24), which has been characterized by the depletion of reduced glutathione (GSH), increased production of reactive oxygen intermediates (ROI), and nitric oxide (NO) (14, 18). T-cell receptor activation-induced transient MHP is mediated by NO (19). In turn, sustained exposure to NO triggers mitochondrial biogenesis (20, 21). Thus, oxidative stress in SLE is associated with the accumulation of mitochondria that may be driven by increased NO-initiated biogenesis (20) and diminished mitophagy (4). While mitochondria are traditionally considered a primary source of energy production through oxidative phosphorylation, recent studies have clearly shown that they also regulate many signaling pathways, including T-cell activation and death pathway selection (10). ATP depletion predisposes lupus T cells to necrosis, a form of proinflammatory death relative to apoptosis (26).
Innovation.
To delineate the potential sources of oxidative stress in patients with systemic lupus erythematosus (SLE), mitochondrial O2 consumption was evaluated and found to be increased in peripheral blood lymphocytes (PBL) of SLE patients in comparison to PBL of healthy subjects matched for age, gender, and ethnicity and evaluated in parallel. Electron transport chain (ETC) activity was primarily increased at complex I, which may be the main source of oxidative stress in SLE. N-acetylcysteine (NAC) inhibited complex I activity and reduced H2O2 levels both in lupus and in control PBL. Therefore, the therapeutic efficacy of NAC in SLE may be mediated through inhibiting ETC complex I.
The depletion of GSH (2) and exposure to NO have been previously identified as potential metabolic triggers of MHP and biogenesis (19, 20). Importantly, pharmacological targeting of GSH depletion with N-acetylcysteine (NAC), which is a stable amino acid precursor, increased GSH levels in peripheral blood lymphocytes (PBL) and improved disease activity in a randomized double-blind placebo-controlled pilot study of patients with SLE (18). NAC failed to reverse MHP and oxidative stress, indicating that the depletion of GSH may not be a cause but rather a consequence of mitochondrial dysfunction in SLE. Therefore, we investigated the functional capacity of the mitochondrial electron transport chain (ETC) and the impact of T-cell activation, NO, and NAC on the ETC in patients with SLE. In the present study, we show that lupus PBL exhibit elevated baseline O2 consumption and ETC activity through complex I, which are further increased by T-cell receptor stimulation. The specificity of these findings has been confirmed in negatively isolated lupus T cells and their absence in healthy and non-lupus inflammatory arthritis (IA) disease controls. NAC diminished the ETC activity through complex I, which may thus reduce the oxidative stress in SLE.
Results
Lupus PBL exhibit increased mitochondrial ETC activity at complex I following CD3/CD28 costimulation
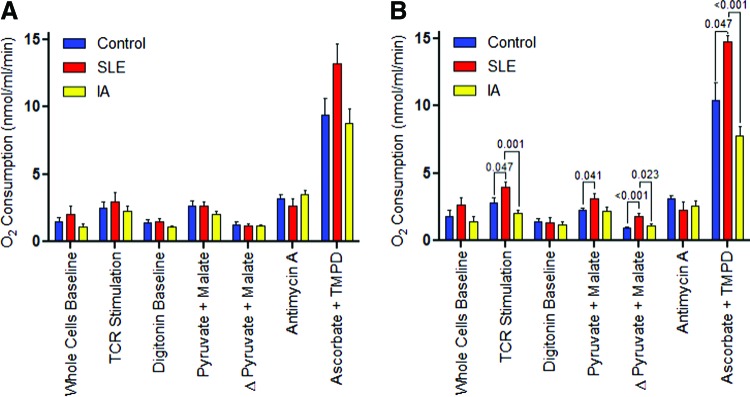
In accordance with earlier findings (14, 20), PBL of 48 SLE patients exhibited greater mitochondrial transmembrane potential (ΔΨm) or MHP and increased mitochondrial mass and oxidative stress evidenced by the increased production of NO, peroxynitrite (ONOO−), and H2O2 (Supplementary Fig. S1; Supplementary Data are available online at www.liebertpub.com/ars). When normalized for mitochondrial mass, SLE PBL also showed MHP relative to matched controls (tetramethylrhodamine methyl ester [TMRM]/nonyl acridine orange [NAO], SLE:+22%±0.062%; p=0.020; Supplementary Fig. S1B). Functional capacity of the mitochondrial ETC was evaluated in nonpermeabilized cells in the absence or presence of in-chamber CD3 stimulation, as well as in digitonin-permeabilized cells after provision of substrates metabolized through distinct ETC complexes. As shown in Figure 1A, O2 consumption of lupus PBL was increased by 16% without any stimulation (SLE: 2.492±0.196 nmol/ml/min, control: 2.137±0.153 nmol/ml/min; p=0.027), 13% after in-chamber stimulation of CD3 (SLE: 4.157±0.186 nmol/ml/min, control: 3.655±0.167 nmol/ml/min; p=0.012), or 10% through complex IV activity (SLE: 7.722±0.419 nmol/ml/min, control: 7.006±0.505 nmol/ml/min; p=0.028). Following overnight CD3/CD28 costimulation, lupus PBL showed decreased O2 consumption at baseline (SLE: 2.535±0.271 nmol/ml/min, control: 3.208±0.206 nmol/ml/min; p=0.016) but 2.27-fold increased ETC activity at complex I (SLE: 1.606±0.273 nmol/ml/min, control: 0.709±0.169 nmol/ml/min; p=0.001) and 13% increased activity at complex IV (SLE: 7.212±0.572 nmol/ml/min, control: 6.341±0.517 nmol/ml/min; p=0.040) (Fig. 1B).
FIG. 1.

Lupus PBL exhibit increased mitochondrial O2 consumption over matched healthy controls. (A) Representative O2 consumption traces of SLE and matched PBL after overnight rest at 37°C (left panel). Cumulative data represent parallel analyses of 48 SLE patients and 32 matched healthy controls (right panel). p-Values represent paired t-tests. (B) Representative O2 consumption traces of SLE and matched control PBL after overnight CD3/CD28 costimulation at 37°C (left panel). Cumulative data represent parallel analyses of 48 SLE patients and 32 matched healthy controls (right panel). p-Values represent paired t-tests. PBL, peripheral blood lymphocytes; SLE, systemic lupus erythematosus. To see this illustration in color, the reader is referred to the web version of this article at www.liebertpub.com/ars
Disease activity was determined in 58 SLE patients and characterized by an SLE disease activity score (SLE disease activity index [SLEDAI]) of 6.28±0.77. We divided the patients into two groups: 29 patients had SLEDAI of ≤4, with mean±SEM of 2.93±0.29. Twenty-nine patients had SLEDAI of >4, with mean±SEM of 9.86±1.22. SLEDAI scores were significantly different between the low and high disease activity patient groups (p=2×10⁻⁵). O2 consumption rate by rested and TCR-stimulated PBL were compared for all seven conditions tested. Moderately diminished ETC activity was noted at complex IV by rested PBL in patients with SLEDAI of >4 (6.50±0.51 nmol/ml/min) relative to those with SLEDAI of ≤4 (8.83±0.56 nmol/ml/min; p=0.005). Thus, increased ETC activities of lupus PBL are not related to disease activity.
Due to the limited availability of cells to supply concurrent ETC and metabolic studies by flow cytometry, PBL have not been further fractionated into subsets in all patients. However, the great majority of cells in the monocyte-depleted nonadherent PBL utilized in these studies were CD3+ T cells, and their numbers was similar in SLE patients (71.1%±2.1%) and control subjects (70.8%±1.8%). Nevertheless, following CD3/CD28 stimulation, the complex I activity was also elevated in “untouched” T cells of SLE patients (1.816±0.180) in comparison to healthy (0.917±0.094; p=0.0003) and as well as IA controls studied in parallel (1.057±0.199; p=0.0308; Fig. 2).
FIG. 2.
Measurement of ETC activity via O2 consumption by overnight rested (A) and CD3/CD28-stimulated T cells (B). “Untouched” T cells were negatively isolated with an “untouched” human T cell isolation kit from 7 female SLE patients, 10 female IA patients (8 rheumatoid arthritis and 2 psoriatic arthritis), and 11 healthy subjects matched for age within 10 years and ethnicity. Data represent mean±SEM. p-Values reflect comparison with unpaired two-tailed t-test. ETC, electron transport chain; IA, inflammatory arthritis. To see this illustration in color, the reader is referred to the web version of this article at www.liebertpub.com/ars
Next, we assessed whether the increased ETC activity may be attributed to the accumulation of mitochondria. O2 consumption by rested PBL was only elevated in the presence of complex III inhibitor antimycin A (SLE: 1.57±0.18 nmol/ml/min/NAO mean fluorescence intensity [MFI], control: 1.25±0.17 nmol/ml/min/NAO MFI, p=0.040; Supplementary Fig. S2A]. After overnight CD3/CD28 stimulation, respiration was diminished in digitonin-permeabilized lupus PBL by 30% (SLE: 0.60±0.07 nmol/ml/min/MitoTracker Green [MTG] MFI, control: 0.91±0.05 nmol/ml/min/MTG MFI, p=0.0006); however, the ETC activity at complex I was enhanced by 70% in lupus PBL (SLE: 1.51±0.09 nmol/ml/min/MTG MFI, control: 0.81±0.07 nmol/ml/min/MTG MFI, p=0.034; SLE: 1.59±0.10 nmol/ml/min/NAO MFI, control: 0.74±0.08 nmol/ml/min/NAO MFI, p=0.017; Supplementary Fig. S2B).
Complex I-driven O2 consumption of SLE PBL is resistant to inhibition by NO
Since NO, which is produced at elevated levels in lupus T cells (20), has been identified as a trigger of MHP (19) and mitochondrial biogenesis (20–22), we investigated its effect on ETC activity. The treatment of PBL with NOC-9, which is capable of rapidly releasing NO, augmented intracellular NO levels by 38%±6% (p=0.0002) as well as ONOO− levels by 674%±223% (p=0.033) (Fig. 3A). Such treatment of PBL with NOC-9 selectively inhibited the activity of complex I but not complex IV (Fig. 3B). While NOC-9 profoundly inhibited O2 consumption in the absence or presence of complex I substrates both in control (p<0.0001) and in SLE (p=0.0004), NO reduced baseline respiration in SLE to a greater extent (p=0.001; Fig. 3C). However, SLE PBL had an increase of 29% in ETC activity at complex I following NOC-9 treatment (SLE: 1.405±0.206 nmol/ml/min, controls: 1.277±0.150 nmol/ml/min, one-way analysis of variance (ANOVA) p=0.026; Fig. 3C).
FIG. 3.
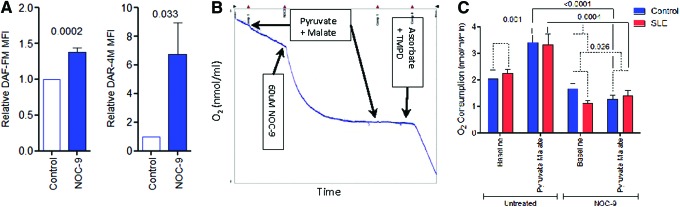
Differential regulation of ETC activity of lupus and control PBL by NO. (A) Effect of 60 μM NOC-9 on NO (DAF-FM) and ONOO− (DAR-4M) levels measured by flow cytometry of DAF-FM and DAR-4M fluorescence, respectively. MFI of NOC-9-treated cells were compared to untreated cells normalized to 1.0 for each experiment. Data represent mean±SEM of four independent experiments. (B) Effect of NOC-9 on ETC activity of digitonin-permeabilized healthy PBL. Representative Oxygraph tracing shows rapid consumption of O2 with injection of NOC-9, which results in complete blockade of complex I activity. (C) Effect of NOC-9 on ETC activity through complex I and complex IV in PBL of eight lupus patients and eight matched healthy controls. p-Values represent comparison with paired t-test (solid lines) and ANOVA (broken lines). ANOVA, analysis of variance; DAF-FM, 4-amino-5-methylamino-2′,7′-difluoroflourescein diacetate; DAR-4M, diaminorhodamine-4M; MFI, mean fluorescence intensity; NO, nitric oxide; ONOO−, peroxynitrite. To see this illustration in color, the reader is referred to the web version of this article at www.liebertpub.com/ars
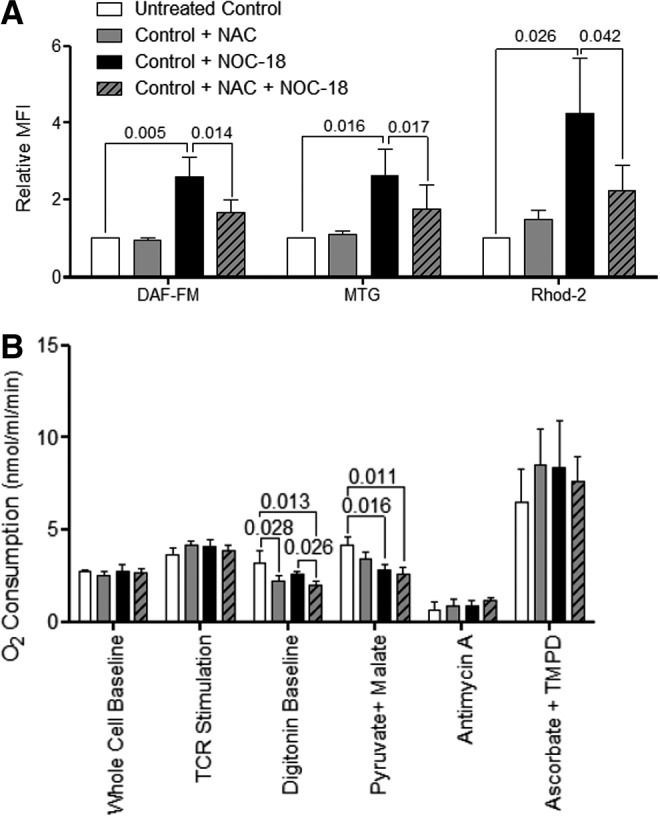
NAC reduces H2O2 levels relative to mitochondrial mass in lupus PBL
Given the promising clinical benefit of in vivo treatment with NAC (18), we evaluated its potential mechanism of action on mitochondrial function in vitro. After overnight incubation with 3 mM NAC, we observed reduced mitochondrial mass (MTG, control: −6.9%±0.3%, p=0.030; SLE:−7.5%±0.1%, p=0.020) and H2O2 levels both in control and in lupus PBL (dichlorofluorescein diacetate [DCF-DA], control: −29.3%±0.04%, p<0.001; SLE: −41.2%±0.6%, p<0.001). The relative impact of NAC on H2O2 levels was greater in SLE (ANOVA p=0.003). NAC also reduced MHP of lupus PBL when measured by TMRM (8.6%±0.48%; p=0.01) but not 3,3′-dihexyloxacarbocyanine iodide (DiOC6) fluorescence (Fig. 4A). When corrected for increased mitochondrial mass assessed by MTG (DCF-DA/MTG, control: −22.1%±0.05%, p=0.0005; SLE: −34.8%±0.06%, p<0.0001; ANOVA p=0.016) or NAO, the more profound suppression of H2O2 production by NAC was sustained in SLE PBL (DCF-DA/NAO, control:−29.9%±0.051%, p<0.0001; SLE: −39.2%±0.06%, p<0.0001; ANOVA p=0.001) (Fig. 4B). Interestingly, ΔΨm was increased by NAC when measured by DiOC6 relative to MTG (DiOC6/MTG, control: +11.6%±0.046%, p=0.022; SLE: +15.4%±0.056%, p=0.014) but reduced in SLE PBL when measured by TMRM relative to NAO (TMRM/NAO, SLE: −13%±0.047%, p=0.007, using paired two-tailed t-test; Fig. 4B). Such discordant detection of Δψm may be related to thiol-dependent fluorescence or partitioning of the mass sensor MTG (9). NAC reduced ONOO− in control PBL (diaminorhodamine-4M [DAR-4M], control: −18.1%±0.05%, p=0.004) and NO in SLE PBL (4-amino-5-methylamino-2′,7′-difluoroflourescein diacetate [DAF-FM], SLE: −18.4%±0.09%, p=0.026; Fig. 4B).
FIG. 4.

Effect of NAC on Δψm, mitochondrial mass, NO, ONOO−, H2O2, Ca2+ levels in control and lupus PBL. (A) Flow cytometry of mitochondrial mass (NAO and MTG), Δψm (DiOC6 and TMRM), ONOO− (DAR-4M), NO (DAF-FM), H2O2 (DCF-DA), mitochondrial Ca2+ levels (Rhod-2) in PBL of 24 SLE patients and 16 matched healthy controls incubated overnight without or with 3 mM NAC. MFI values were compared to those of untreated control PBL normalized at 1.0 for each experiment. (B) MTG or NAO normalized MFI data of 24 SLE and 16 matched healthy control PBL. Data were analyzed with two-tailed paired t-test. Ca2+, calcium; DCF-DA, dichlorofluorescein diacetate; DiOC6, 3,3′-dihexyloxacarbocyanine iodide; MTG, MitoTracker Green; NAC, N-acetylcysteine; NAO, nonyl acridine orange; TMRM, tetramethylrhodamine methyl ester. To see this illustration in color, the reader is referred to the web version of this article at www.liebertpub.com/ars
NAC modulates the impact of NO on mitochondrial function
Since NO exerted discordant influence on ETC of lupus and control PBL, we investigate whether NAC affects the impact of NO on mitochondrial function. PBL were incubated overnight with or without 600 μM NOC-18, an NO donor with a half-life of 20 h, 3 mM NAC, or a combination of NOC-18 and NAC. As expected, NOC-18 alone raised intracellular NO levels (+158%±51%; p=0.005), mitochondrial mass (MTG: +162%±68%; p=0.016), and mitochondrial calcium (Ca2+) levels (Rhod-2: +324%±144%; p=0.026; Fig. 5A). Coincubation with both NOC-18 and NAC compared with NOC-18 alone revealed a decrease in NO levels (DAF-FM: −92%; p=0.014), mitochondrial mass (MTG: −87%; p=0.017), and Ca2+ levels (Rhod-2: −52%; p=0.042; Fig. 5A), suggesting that NAC modulates both the metabolism of NO and its impact on mitochondrial homeostasis of PBL.
FIG. 5.
NAC modulates the impact of NO on mitochondrial function. (A) Flow cytometry of NO (DAF-FM), mitochondrial mass (NAO and MTG), and mitochondrial Ca2+ levels (Rhod-2) in PBL from five healthy controls following overnight treatment with or without 3 mM NAC, 600 μM NOC-18, or 3 mM NAC and 600 μM NOC-18. (B) O2 consumption by PBL from five healthy controls following overnight treatment with or without 3 mM NAC, 600 μM NOC-18, or 3 mM NAC and 600 μM NOC-18. p-Values reflect analysis with two-tailed paired t-test.
NAC reduced baseline respiration (untreated: 3.16±0.708 nmol/ml/min, NAC treated: 2.22±0.267 nmol/ml/min; p=0.028; NOC-18 and NAC treated: 2.018±0.178 nmol/ml/min; p=0.013). NOC-18 decreased respiration through complex I by 32% (untreated: 4.15±0.46 nmol/ml/min, NOC-18 treated: 2.83±0.25 nmol/ml/min; p=0.016; Fig. 5B). Despite the reduction in NO and ONOO− production by NAC (Fig. 4), the block of respiration by NOC-18 was not rescued by coincubation with 3 mM NAC, which also showed diminished O2 consumption through complex I by 37% in comparison to untreated controls (untreated: 4.15±0.46 nmol/ml/min, NOC-18 and NAC treated: 2.62±0.33nmol/ml/min; p=0.011; Fig. 5B). These results indicate that overnight pretreatment by NAC is capable of reducing oxidative stress (Fig. 4B) and NO-induced mitochondrial biogenesis (Fig. 5A), whereas it cannot rescue complex I inhibition by NO (Fig. 5B).
NAC selectively blocks ETC activity at complex I
To investigate whether NAC can directly block ETC activity, we compared the rate of respiration after 2 h pretreatment, which was followed by washing thrice or by direct addition of 3 mM NAC into the Oxygraph chamber. While pretreatment had no effect, the direct addition of NAC into the Oxygraph chamber led to a 53% inhibition of respiration through complex I (untreated: 2.625±0.193 nmol/ml/min, NAC-treated: 1.231±0.297 nmol/ml/min; p=0.004; Fig. 6A). To determine if the decrease in respiration was due to the general reducing capacity of NAC or a direct blocking of the ETC at complex I, we compared the O2 consumption rate through complex I in the absence or presence of 1.5 mM β-mercaptoethanol (BME), another reducing agent. NAC was again found to inhibit the ETC activity at complex I by 42% compared to control (untreated: 2.355±0.293 nmol/ml/min, NAC in chamber: 1.343±0.297 nmol/ml/min; p=0.043) or 43% relative to BME-treated PBL (BME in chamber: 2.336±0.293 nmol/ml/min, NAC in chamber: 1.343±0.297nmol/ml/min; p=0.013; Fig. 6B). When we measured O2 consumption-driven complex IV, we observed that NAC did not alter respiration (control: 28.610±1.630 nmol/ml/min, NAC in chamber: 29.115±2.345 nmol/ml/min). However, BME did block respiration through complex IV by 79% (control: 28.610±1.630 nmol/ml/min, BME in chamber: 6.068±0.234 nmol/ml/min; p=0.031). These results suggested that NAC selectively inhibits respiration through complex I.
FIG. 6.
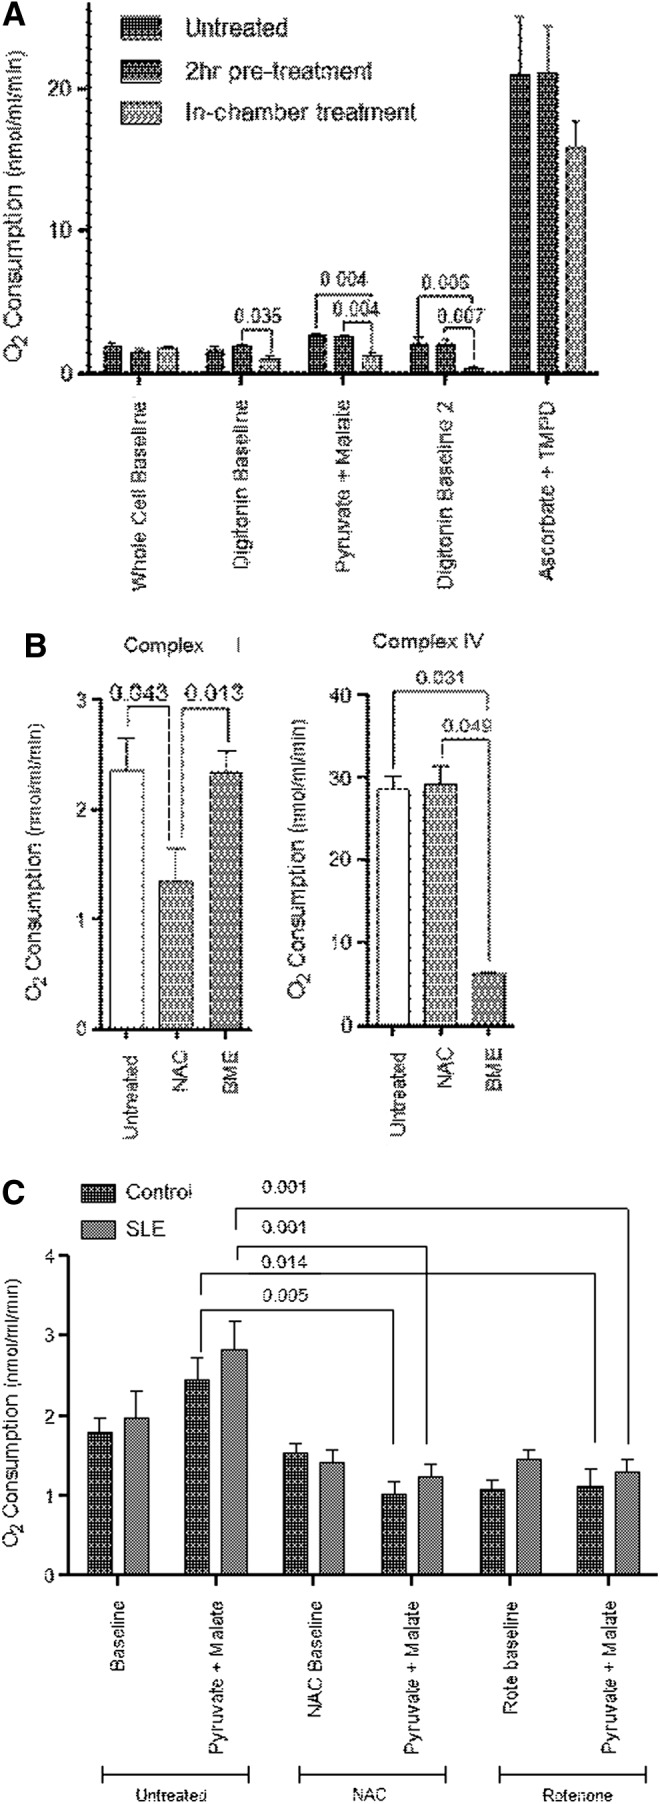
Inhibition of ETC activity by NAC at complex I. (A) O2 consumption of PBL following pretreated with 3 mM NAC for 2 h and subsequent washing, or direct addition 3 mM NAC into the Oxygraph chamber. Data represent mean±SEM of experiments using PBL of five healthy donors. (B) Effect of in-chamber addition of 3 mM NAC or 1.5 mM BME on ETC activities driven through complexes I and IV. Data represent mean±SEM of experiments using PBL of six healthy donors. (C) O2 consumption by PBL from five SLE and matched controls before and 5 min after in-chamber addition of 3 mM NAC or 3 μM rotenone. p-Values reflect analysis with two-tailed paired t-test. BME, β-mercaptoethanol.
To further evaluate the impact of NAC on mitochondrial homeostasis in SLE, its effects were compared to the conventional complex I inhibitor rotenone. As shown in Figure 6C, NAC again diminished respiration through complex I by −58% in controls (untreated: 2.433±0.283 nmol/ml/min, NAC in chamber: 1.019±0.161 nmol/ml/min; p=0.005) and by −56% in SLE PBL (untreated: 2.820±0.360 nmol/ml/min, NAC in chamber: 1.231±0.163 nmol/ml/min; p=0.0001). The extent of blockade by NAC at complex I was similar in control and lupus PBL (p=0.167 by one-way ANOVA) (Fig. 6C). The inhibitory effects of NAC on complex I respiration were similar to those of rotenone (Fig. 6C). Similar to NAC (Fig. 6B), the activity of complex IV was not inhibited by rotenone (Fig. 1A, B).
Discussion
The present study provides evidence that lupus PBL exhibit increased O2 consumption primarily driven through mitochondrial ETC complex I that is inhibited by NAC. Since NAC improves disease activity in mice (28) and patients with lupus (18), its effect on ETC complex I may be central to its therapeutic benefit in SLE. ETC activity through complex I remained elevated after compensating for the increased mitochondrial mass, suggesting that this defect may drive mitochondrial function in SLE (Fig. 7). Although the availability of cells for parallel ETC and flow cytometry studies was limited in most patients, negatively isolated T cells from a subset of SLE patients revealed greater ETC activity at complex I, and to a lesser extent at complex IV in comparison to both healthy and nonlupus IA disease controls. These findings are consistent with earlier observations that mitochondrial dysfunction of T cells is confined to patients with SLE relative to other rheumatic diseases (14, 15, 20). Here, we also confirm that NO is overproduced in patients with SLE (20), which is consistent with a role of NO in mitochondrial biogenesis (19, 21, 22) and increased mitochondrial mass in lupus T cells (4, 11, 20). NO production is also increased in lupus-prone mice, underlying its importance for lupus pathogenesis (23, 31). O2 consumption of SLE PBL driven by substrates of complex I was relatively resistant to the inhibition by NO in vitro, indicating a preexisting blockade, possibly having originated from increased NO production in vivo. NO can block complex I via S-nitrosylation (5), which may be reversed by GSH. Indeed, NAC treatment interfered with NO-induced mitochondrial biogenesis and accumulation of Ca2+. However, NAC did not significantly influence the inhibitory effect of NO on complex I activity. Thus, NAC may also act through mechanisms other than S-nitrosylation. For example, complex I may be directly inhibited by excess GSH through glutathionylation (17), which may interfere with the effect of subsequent NO exposure on ETC function. Moreover, as we recently discovered, HRES-1/Rab4-mediated depletion of Drp1 causes deficient mitophagy in lupus T cells, both in patients and in mice. Such mitochondrial defect precedes disease onset in lupus-prone mice (4). Therefore, deficient mitophagy may lead to the accumulation of mitochondria and the formation of megamitochondria (29) that carry the complex metabolic consequences of oxidative and nitrosative stress, including the resistance of ETC complex I activity to subsequent NO exposure.
FIG. 7.

Schematic diagram of differences in mitochondrial ETC activity between healthy and SLE PBL. Increased O2 consumption by SLE PBL drives elevated ΔΨm, which is associated with enhanced production of ROI, RNI, and the formation of megamitochondria. After TCR stimulation, SLE PBL displayed enhanced ETC activity at complex I that resisted its blockade by NO (dashed line). NAC blocked respiration at complex I and reduced mitochondrial mass and ROI production both in control and in lupus PBL. ROI, reactive oxygen intermediates. To see this illustration in color, the reader is referred to the web version of this article at www.liebertpub.com/ars
Along these lines, NAC but not the reducing agent BME selectively blocked respiration through complex I. The effects of NAC on ETC activity are consistent with earlier observations on its impact on mitochondrial oxidative stress (6). NAC reduced H2O2 levels relative to mitochondrial mass in lupus and control PBL, suggesting that the blockade of the ETC by NAC at complex I has antioxidant effects, which are clearly not confined to patients with SLE. Due to the exceptional safety and antioxidant potency of NAC in numerous chronic inflammatory diseases, such as chronic obstructive pulmonary disease (18a) and idiopathic pulmonary fibrosis (8), mechanistic studies aimed at mapping the sources of oxidative stress are warranted in each of these clinical conditions.
NAC reversed GSH depletion in lupus PBL, which revealed an overall reduction of oxidative stress in vivo (18). However, MHP was paradoxically increased, especially in double-negative T cells (18). As shown here, MHP assessed by DiOC6 fluorescence was also increased by in vitro NAC treatment relative to mitochondrial mass monitored by MTG fluorescence. However, MHP relative to mitochondrial mass was reduced by in vitro NAC treatment when estimated by TMRM/NAO ratio. These findings imply that the partitioning of mitochondrial potential sensor fluorescent probes is affected by NAC, possibly through influencing disulfide bonds (9), and further studies are needed to ascertain the mechanism by which in vivo NAC treatment affects MHP.
In conclusion, the present study reveals that SLE PBL and T cells exhibit enhanced mitochondrial ETC activity, primarily at complex I. This complex has been previously identified as the main source of oxidative stress that emanates from mitochondrial respiration (27). Thus, the blockade of ETC activity at complex I and reduced H2O2 production are likely to represent the mechanistic targets of NAC therapy in patients with SLE.
Materials and Methods
Human subjects
Sixty-nine female SLE patients with a mean age of 48.0±1.5 years (range: 22–68 years) were investigated. All patients fulfilled the diagnostic criteria for SLE (16, 30). Lupus disease activity was assessed by the SLEDAI (3). Use of medications have been recorded: hydroxychloroquine, 42; mycophenolate, 26; methotrexate, 3; prednisone, 9; rapamycin, 5; NAC, 3; azathioprine, 1. For each patient, a healthy female control matched for age (within 10 years) and ethnicity was recruited; cells were freshly isolated and studied in parallel. A total of 37 healthy female controls with a mean age of 43.1±2.1 years (range: 21–64 years) were investigated. Ten Caucasian female patients with IA with a mean age of 48.1±2.6 years (range: 32–61 years), 8 with rheumatoid arthritis, and 2 with psoriatic arthritis were also investigated as disease controls. The precise numbers of patients and control studied under each experiment are described in the Results section and figure legends. The study has been approved by the SUNY Upstate Institutional Review Board.
Isolation and culture of PBL
PBL were isolated on Ficoll gradient after the removal of monocytes by adherence to plastic dishes coated with autologous serum (25). PBL were then resuspended at 106 cells/ml in RPMI 1640 medium (Catalogue No. 15-040-CV; Cellgro, Manassas, VA) containing 10% fetal bovine serum (Catalogue No. 26140; Invitrogen/Gibco, Eugene, OR), 2 mM l-glutamine (Catalogue No. 25-005-cl; Cellgro), and 100 U/ml penicillin, 100 μg/ml streptomycin, 10 μg/ml amphotericin B (Catalogue No. 30-004-CI; Cellgro). NAC (Catalogue No. A7250; Sigma-Aldrich, St Louis, MO) was dissolved in water, titrated to pH 7.4, and used at a final concentration of 3 mM. The NO donor NOC-18 (Catalogue No. 487957; Millipore, Billerica, MA) was used at a concentration of 600 μM, as earlier titrated (19). Untouched T cells were isolated by negative selection using untouched human T-cell isolation kit (Catalogue No. 11344D; Life Technologies, Carlsbad, CA). Their purity was confirmed upon each isolation to be≥97% (data not shown). For overnight T-cell activation, PBL were stimulated with plate-bound OKT3 monoclonal antibody directed to CD3 (ATCC CRL-8001) and soluble anti-CD28 (Catalogue No. 555725; BD Biosciences, San Jose, CA), as earlier described (12).
Flow cytometry
Mitochondrial transmembrane potential (Δψm) was assessed with positively charged cationic dyes (DiOC6, 40 nM, excitation: 488 nm, emission: 525 nm recorded in FL-1; TMRM, 100 nM, excitation: 543 nm, emission: 567 nm recorded in FL-2). Mitochondrial mass was evaluated with potential-insensitive mitochondrial dyes MTG-FM (100 nM; excitation: 490 nm, emission: 516 nm recorded in FL-1) or NAO (50 nM; excitation: 490 nm, emission: 540 nm recorded in FL-1). ROI were assessed with H2O2-sensing DCF-DA (1 μM), NO sensor DAF-FM (1 μM, excitation: 495, emission: 515 nm recorded in FL-1), and ONOO− sensor DAR-4M (10 μM) (Catalogue No. 251760, ex544, em590; Calbiochem, San Diego, CA). Cytosolic Ca2+ was assessed with Fluo-3 (1 μM, excitation: 506 nm, emission: 526 nm recorded in FL-1), and mitochondrial Ca2+ was assessed with Rhod-2 (1 μM; excitation: 552 nm, emission: 581 nm recorded in FL-2), respectively. All metabolic and mitochondrial sensor dyes were obtained from Invitrogen (Carlsbad, CA) and used as earlier described (1, 2, 12, 19). We recorded up to 12 parameters simultaneously using a Becton Dickinson LSRII flow cytometer with 20 mW solid-state Nd-YAG (emission at 355 nm), 20 mW argon (emission at 488 nm), 10 mW diode-pumped solid-state yellow-green (emission 561 nm), and 16 mW helium–neon (emission at 634 nm) lasers. Data were analyzed with FlowJo version 7.5.5 software (Tree Star, Inc., Ashland, OR). Results are expressed as MFI values expressed relative to that of control PBL set to 1.0 for each experiment, as earlier described (15, 25). Due to the limitation of patient cell numbers, PBL have not been further fractionated into lymphocyte subsets. However, T-cell content was monitored by the percentage of CD3+ cells, and it was found to be 71.1%±2.1% in SLE patients and 70.8%±1.8% in healthy controls.
Measurement of mitochondrial ETC activity
ETC activity was measured in the absence and presence of substrates specific for individual ETC complexes using Oxygraph, a Clark-type O2 electrode (Hansatech, Norfolk, United Kingdom), as earlier described (25). Briefly, 1×10⁷ cells were washed in phosphate-buffered saline two times and resuspended at a concentration of 5×10⁶ cells/ml in respiration buffer (RB) containing 0.3 M mannitol, 10 mM KCl, 5 mM MgCl, 10 mM K2PO4, pH 7.4. Three hundred microliters of cell suspension was placed in the Oxygraph chamber and measured for a baseline rate of respiration. Next, OKT3 (1 μg/ml) was added into the chamber and T-cell receptor-activated respiration rate was recorded. Subsequently, another aliquot of cells was permeabilized with 60 μg/ml digitonin (Catalogue No. D141; Sigma-Adrich), centrifuged, and resuspended at a concentration of 5×10⁶ cells/ml in RB plus 1 mg/ml bovine serum albumin (Catalogue No. 03117057001; Roche, Indianapolis, IN) and 0.5 mM ADP (Catalogue No. A2754; Sigma-Adrich). Three hundred microliters of cell suspension was added to the chamber to test the activity of complex I with the addition of 8 mM pyruvate (Catalogue No. P5280; Sigma-Adrich) and 0.2 mM malate (Catalogue No. M7397; Sigma-Adrich). After complex I inhibition via 3 μM rotenone (Catalogue No. 45656; Sigma-Adrich), ETC complex II activity was tested in the presence of 10 mM succinate (Catalogue No. 208741000; ACROS/Fisher, Geel, Belgium) and 130 μM ATP (Catalogue No. A3377; Sigma-Adrich). Following complex III inhibition with 1 μM antimycin A (Catalogue No. A8674; Sigma-Adrich), complex IV activity was measured in the presence of 10 mM ascorbate (Catalogue No. A5960; Sigma-Adrich) and 0.2 mM N,N,N′,N′-tetramethyl-p-phenylenediamine (TMPD; Catalogue No. T7394; Sigma-Adrich). Separate aliquots of cells were treated in the Oxygraph chamber with 3 mM NAC, 1.5 mM BME (Catalogue No. M-3148; Sigma-Adrich), or 60 μM NOC-9 (Catalogue No. 487927; Millipore) for testing their ability to modulate the ETC activity. Each assay was performed in duplicate, and their means were used as the results of individual experiments.
Statistics
Statistical analyses were carried out with GraphPad Prism version 5.04 software (La Jolla, CA). Paired and unpaired t-tests as well as one-way and two-way ANOVA were performed as indicated for each experiment. p-Values<0.05 were considered significant.
Supplementary Material
Abbreviations Used
- ΔΨm
mitochondrial transmembrane potential
- ANOVA
analysis of variance
- BME
β-mercaptoethanol
- Ca2+
calcium
- DAF-FM
4-amino-5-methylamino-2′,7′-difluoroflourescein diacetate; nitric oxide indicator
- DAR-4M
diaminorhodamine-4M; peroxynitrite indicator
- DCF-DA
dichlorofluorescein diacetate, H2O2 sensor
- DiOC6
3,3′-dihexyloxacarbocyanine iodide; mitochondrial potential indicator
- ETC
electron transport chain
- GSH
glutathione
- IA
inflammatory arthritis
- MFI
mean fluorescence intensity
- MHP
mitochondrial hyperpolarization
- MTG
MitoTracker Green
- NAC
N-acetylcysteine
- NAO
nonyl acridine orange
- NO
nitric oxide
- ONOO−
peroxynitrite
- PBL
peripheral blood lymphocytes
- RB
respiration buffer
- ROI
reactive oxygen intermediates
- SLE
systemic lupus erythematosus
- SLEDAI
SLE disease activity index
- TMPD
N,N,N′,N′-tetramethyl-p-phenylenediamine
- TMRM
tetramethylrhodamine methyl ester
Acknowledgments
This work was supported in part by grant RO1 AI072648 from the National Institutes of Health, the Alliance for Lupus Research, and the Central New York Community Foundation. We thank Drs. Fatme Allam, Hom Neupane, Paul Phillips, and Julie Yu for referral of patients for our studies.
Author Disclosure Statement
No competing financial interests exist.
References
- 1.Banki K, Hutter E, Colombo E, Gonchoroff NJ, and Perl A. Glutathione levels and sensitivity to apoptosis are regulated by changes in transaldolase expression. J Biol Chem 271: 32994–33001, 1996 [DOI] [PubMed] [Google Scholar]
- 2.Banki K, Hutter E, Gonchoroff N, and Perl A. Elevation of mitochondrial transmembrane potential and reactive oxygen intermediate levels are early events and occur independently from activation of caspases in Fas signaling. J Immunol 162: 1466–1479, 1999 [PMC free article] [PubMed] [Google Scholar]
- 3.Bombardier C, Gladman DD, Urowitz MB, Caron D, Chang CH, and The Committee on Prognosis Studies in SLE. Derivation of the SLEDAI. A disease activity index for lupus patients. Arthritis Rheum 35: 630–640, 1992 [DOI] [PubMed] [Google Scholar]
- 4.Caza TN, Fernandez D, Talaber G, Oaks Z, Haas M, Madaio MP, Lai Z-W, Miklossy G, Singh RR, Chudakov DM, Malorni W, Middleton FA, Banki K, and Perl A. HRES-1/RAB4-mediated depletion of DRP1 impairs mitochondrial homeostasis and represents a target for treatment in SLE. Ann Rheum Dis 2013. DOI: 10.1136/annrheumdis-2013-203794 [DOI] [PMC free article] [PubMed] [Google Scholar]
- 5.Clementi E, Brown GC, Feelisch M, and Moncada S. Persistent inhibition of cell respiration by nitric oxide: crucial role of S-nitrosylation of mitochondrial complex I and protective action of glutathione. Proc Natl Acad Sci U S A 95: 7631–7636, 1998 [DOI] [PMC free article] [PubMed] [Google Scholar]
- 6.Cossarizza A, Franceschi C, Monti D, Salvioli S, Bellesia E, Rivabene R, Biondo L, Rainaldi G, Tinari A, and Malorni W. Protective effect of N-acetylcysteine in tumor necrosis factor-alpha-induced apoptosis in U937 cells: the role of mitochondria. Exp Cell Res 220: 232–240, 1995 [DOI] [PubMed] [Google Scholar]
- 7.This reference has been deleted.
- 8.Demedts M, Behr J, Buhl R, Costabel U, Dekhuijzen R, Jansen HM, MacNee W, Thomeer M, Wallaert B, Laurent F, Nicholson AG, Verbeken EK, Verschakelen J, Flower CD, Capron F, Petruzzelli S, De Vuyst P, van den Bosch JM, Rodriguez-Becerra E, Corvasce G, Lankhorst I, Sardina M, Montanari M, and IFIGENIA Study Group. High-dose acetylcysteine in idiopathic pulmonary fibrosis [see comment]. N Engl J Med 353: 2229–2242, 2005 [DOI] [PubMed] [Google Scholar]
- 9.Elmore SP, Nishimura Y, Qian T, Herman B, and Lemasters JJ. Discrimination of depolarized from polarized mitochondria by confocal fluorescence resonance energy transfer. Arch Biochem Biophys 422: 145–152, 2004 [DOI] [PubMed] [Google Scholar]
- 10.Fernandez D. and Perl A. Metabolic control of T cell activation and death in SLE. Autoimmun Rev 8: 184–189, 2009 [DOI] [PMC free article] [PubMed] [Google Scholar]
- 11.Fernandez D, Bonilla E, Mirza N, and Perl A. Rapamycin reduces disease activity and normalizes T-cell activation-induced calcium fluxing in patients with systemic lupus erythematosus. Arthritis Rheum 54: 2983–2988, 2006 [DOI] [PMC free article] [PubMed] [Google Scholar]
- 12.Fernandez DR, Telarico T, Bonilla E, Li Q, Banerjee S, Middleton FA, Phillips PE, Crow MK, Oess S, Muller-Esterl W, and Perl A. Activation of mTOR controls the loss of TCR. in lupus T cells through HRES-1/Rab4-regulated lysosomal degradation. J Immunol 182: 2063–2073, 2009 [DOI] [PMC free article] [PubMed] [Google Scholar]
- 13.Francis L. and Perl A. Pharmacotherapy of systemic lupus erythematosus. Expert Opin Pharmacother 10: 1481–1494, 2009 [DOI] [PubMed] [Google Scholar]
- 14.Gergely PJ, Grossman C, Niland B, Puskas F, Neupane H, Allam F, Banki K, Phillips PE, and Perl A. Mitochondrial hyperpolarization and ATP depletion in patients with systemic lupus erythematosus. Arthritis Rheum 46: 175–190, 2002 [DOI] [PMC free article] [PubMed] [Google Scholar]
- 15.Gergely PJ, Niland B, Gonchoroff N, Pullmann R, Jr, Phillips PE, and Perl A. Persistent mitochondrial hyperpolarization, increased reactive oxygen intermediate production, and cytoplasmic alkalinization characterize altered IL-10 signaling in patients with systemic lupus erythematosus. J Immunol 169: 1092–1101, 2002 [DOI] [PMC free article] [PubMed] [Google Scholar]
- 16.Hochberg MC. Updating the American College of Rheumatology revised criteria for the classification of systemic lupus erythematosus. Arthritis Rheum 40: 1725, 1997 [DOI] [PubMed] [Google Scholar]
- 17.Hurd TR, Requejo R, Filipovska A, Brown S, Prime TA, Robinson AJ, Fearnley IM, and Murphy MP. Complex I within oxidatively stressed bovine heart mitochondria is glutathionylated on Cys-531 and Cys-704 of the 75-kDa Subunit. J Biol Chem 283: 24801–24815, 2008 [DOI] [PMC free article] [PubMed] [Google Scholar]
- 18.Lai Z-W, Hanczko R, Bonilla E, Caza TN, Clair B, Bartos A, Miklossy G, Jimah J, Doherty E, Tily H, Francis L, Garcia R, Dawood M, Yu J, Ramos I, Coman I, Faraone SV, Phillips PE, and Perl A. N-acetylcysteine reduces disease activity by blocking mTOR in T cells of lupus patients. Arthritis Rheum 64: 2937–2946, 2012 [DOI] [PMC free article] [PubMed] [Google Scholar]
- 18a.Montuschi P. Pharmacological treatment of chronic obstructive pulmonary disease. Int J Chron Obstruct Pulmon Dis 1: 409–423, 2006 [DOI] [PMC free article] [PubMed] [Google Scholar]
- 19.Nagy G, Koncz A, and Perl A. T cell activation-induced mitochondrial hyperpolarization is mediated by Ca2+- and redox-dependent production of nitric oxide. J Immunol 171: 5188–5197, 2003 [DOI] [PMC free article] [PubMed] [Google Scholar]
- 20.Nagy G, Barcza M, Gonchoroff N, Phillips PE, and Perl A. Nitric oxide-dependent mitochondrial biogenesis generates Ca2+ signaling profile of lupus T cells. J Immunol 173: 3676–3683, 2004 [DOI] [PMC free article] [PubMed] [Google Scholar]
- 21.Nisoli E, Clementi E, Paolucci C, Cozzi V, Tonello C, Sciorati C, Bracale R, Valerio A, Francolini M, Moncada S, and Carruba MO. Mitochondrial biogenesis in mammals: the role of endogenous nitric oxide [comment]. Science 299: 896–899, 2003 [DOI] [PubMed] [Google Scholar]
- 22.Nisoli E. and Carruba MO. Nitric oxide and mitochondrial biogenesis. J Cell Sci 119: 2855–2862, 2006 [DOI] [PubMed] [Google Scholar]
- 23.Oates JC, Ruiz P, Alexander A, Pippen AMM, and Gilkeson GS. Effect of late modulation of nitric oxide production on murine lupus. Clin Immunol Immunopathol 83: 86–92, 1997 [DOI] [PMC free article] [PubMed] [Google Scholar]
- 24.Perl A. Oxidative stress in the pathology and treatment of systemic lupus erythematosus. Nat Rev Rheumatol 9: 674–686, 2013 [DOI] [PMC free article] [PubMed] [Google Scholar]
- 25.Perl A, Hanczko R, and Doherty E. Assessment of mitochondrial dysfunction in lymphocytes of patients with systemic lupus erythematosus. Methods Mol Biol 900: 61–89, 2012 [DOI] [PubMed] [Google Scholar]
- 26.Sauter B, Albert ML, Francisco L, Larsson M, Somersan S, and Bhardwaj N. Consequences of cell death: exposure to necrotic tumor cells, but not primary tissue cells or apoptotic cells, induces the maturation of immunostimulatory dendritic cells. J Exp Med 191: 423–434, 2000 [DOI] [PMC free article] [PubMed] [Google Scholar]
- 27.St Pierre J, Buckingham JA, Roebuck SJ, and Brand MD. Topology of superoxide production from different sites in the mitochondrial electron transport chain. J Biol Chem 277: 44784–44790, 2002 [DOI] [PubMed] [Google Scholar]
- 28.Suwannaroj S, Lagoo A, Keisler D, and McMurray RW. Antioxidants suppress mortality in the female NZB x NZW F1 mouse model of systemic lupus erythematosus (SLE). Lupus 10: 258–265, 2001 [DOI] [PubMed] [Google Scholar]
- 29.Talaber G, Miklossy G, Oaks Z, Liu Y, Tooze SA, Chudakov DM, Banki K, and Perl A. HRES-1/Rab4 promotes the formation of LC3+ autophagosomes and the accumulation of mitochondria during autophagy. PLoS One 9: e84392, 2014 [DOI] [PMC free article] [PubMed] [Google Scholar]
- 30.Tan EM, Cohen AS, Fries JF, Masi AT, McShane DJ, Rothfield NF, Schaller JG, Talal N, and Winchester RJ. The 1982 revised criteria for the classification of systemic lupus erythematosus. Arthritis Rheum 25: 1271–1277, 1982 [DOI] [PubMed] [Google Scholar]
- 31.Weinberg JB, Granger DL, Pisetsky DS, Seldin MF, Misukonis MA, Mason SN, Pippen AM, Ruiz P, Wood ER, and Gilkeson GS. The role of nitric oxide in the pathogenesis of spontaneous murine autoimmune disease: Increased nitric oxide production and nitric oxide synthase expression in MRL-lpr/lpr mice, and reduction of spontaneous glomerulonephritis and arthritis by orally administered NG-monomethyl-L-arginine. J Exp Med 179: 651–660, 1994 [DOI] [PMC free article] [PubMed] [Google Scholar]
Associated Data
This section collects any data citations, data availability statements, or supplementary materials included in this article.