

Numerous milk components, such as lactoferrin, are recognized as health-promoting compounds. A growing body of evidence suggests that glycans could mediate lactoferrin’s bioactivity. Goat milk lactoferrin is a candidate for infant formula supplementation because of its high homology with its human counterpart. The aim of this study was to characterize the glycosylation pattern of goat milk lactoferrin. After the protein was isolated from milk by affinity chromatography, N-glycans were enzymatically released and a complete characterization of glycan composition was carried out by advanced mass spectrometry. The glycosylation of goat milk lactoferrin was compared with that of human and bovine milk glycoproteins. Nano-LC-Chip–Q-TOF MS data identified 65 structures, including high mannose, hybrid and complex N-glycans. Among the N-glycan compositions, 37% were sialylated and 34% were fucosylated. The results demonstrated the existence of similar glycans in human and goat milk but also identified novel glycans in goat milk that were not present in human milk. These data suggest that goat milk could be a source of bioactive compounds, including lactoferrin that could be used as functional ingredients for food products beneficial to human nutrition.
1 Introduction
Milk contains a variety of components, including proteins, endogenous peptides, lipids, carbohydrates and minerals, all of which contribute to the growth and development of newborns. Beyond the simple nutritional value of milk compounds, other components, including glycoproteins, antibodies and oligosaccharides, also protect infants by reducing the number of pathogen infections and promoting the development of the intestinal epithelium [1–3]. Therefore, milk is more than a simple source of essential nutrients. Milk contains two major groups of proteins, caseins and whey proteins, both of which play a role in the nourishment and protection of the young. During recent decades, interest has grown in the nutritional and protective properties of whey proteins and their use as ingredients in food products due to their high nutritional value and functional properties [4].
Lactoferrin, a member of the transferrin protein family, is one of the most abundant glycoproteins in human and ruminant milks [5, 6]. Human milk is rich in lactoferrin, with a concentration around 1–2 mg/mL [7–9], whereas lactoferrin concentration in ruminant milk is 10–100 times lower than in human milk (in the range of 0.02–0.2 mg/mL) [10, 11]. Lactoferrin exhibits an array of biological activities, including antioxidant, antibacterial, antiviral activities, iron- (and other metals) binding and immunomodulation [7, 12–14]. Lactoferrin’s function is modulated by both the polypeptide chain and its glycosylation [15]. The discovery of lactoferrin’s functional properties has resulted in increased supplementation of bovine milk-based infant formula with bovine milk lactoferrin as a means to enable health claims [16, 17]. Goat milk lactoferrin may better mimic the functional properties of human milk lactoferrin and therefore be an improvement over bovine milk lactoferrin in formula supplementation. Goat milk is an attractive source for infant feeding due to its high digestibility, immunological properties, and its higher concentration of minerals, including calcium and magnesium [18]. In addition, goat milk lactoferrin has both anticancer and antimicrobial activity [19–21]. Because goat milk oligosaccharides have many similarities to human milk oligosaccharides [22, 23], goat milk lactoferrin glycosylation may be close to human milk lactoferrin glycosylation pattern. Although the glycosylation profile of lactoferrin in human and bovine milk has been described [15, 24–26], the glycosylation pattern of goat milk lactoferrin has remained unknown.
Glycosylation is a post-translational modification with a large diversity of possible structures. N-linked glycans (N-glycans) are glycans attached via N-acetylglucosamine (HexNAc) to the asparagine residues of proteins in the specific amino acid sequence Asn-X-Ser/Thr (where X can be any amino acid except proline). Literature studies report that respectively two sites and four sites are occupied in human and bovine lactoferrin [27]. To the best of our knowledge, there are no published reports about the actual occupancy of goat lactoferrin’s glycosylation sites. Prediction studies reveal the presence of five potential sites (Asn233, Asn281, Asn368, Asn476 and Asn545) just like in bovine lactoferrin [27]. The N-glycan core is composed of two HexNAc and three mannose residues. This core is elongated by other monosaccharides, including fucose (Fuc) and sialic acid, via the actions of glycosyltransferases and glycosidases, which determine the degree of branching and the type of linkage [28]. N-glycans vary widely in composition and structure, sometimes even within a single site of glycosylation. N-glycans are divided into three main classes: high mannose, complex and hybrid [29]. Identifying the composition, structure and glycosylation site represents a significant analytical challenge because of the absence of template and the presence of elongated branches and isomers. Glycosylation can modify the structural conformation of the protein and consequently its biological activity [30, 31]. Milk glycans can interfere with pathogen adhesion to intestinal epithelial cells [32], which strengthens the idea that glycosylation can be involved in protecting the host against microbial and viral attacks.
The objective of this study was to determine the profile of N-glycans of goat milk lactoferrin by mass spectrometry. Human milk lactoferrin has a significant degree of homology (>68%) with bovine and goat milk lactoferrin [33], so we hypothesized the presence of similar N-glycans structures. Therefore, we used goat milk lactoferrin as a model for this investigation because this protein shows great potential as a candidate for infant formula supplementation. Detailed lactoferrin glycan characterization will be essential to an understanding of the protein’s functionalities.
2 Materials and Methods
2.1 Goat milk lactoferrin purification
Goat milk was pooled from 29 goats, including five Alpines, 10 Saanens, one Toggenburg, nine Lamanchas and four crossbreds. The lactation stage of these goats at the time of milk collection was 104–221 days, except for one that was 462 days. Lactoferrin was purified from goat milk by affinity chromatography as described by Barboza et al. [15], with minor modifications. Goat milk was centrifuged at 4,000 × g for 30 min at 4°C to eliminate fat and part of the casein micelles. After centrifugation, the aqueous phase between the upper fat layer and the casein micelle pellet was collected. The pH of the collected fraction was decreased to pH 4.6 by addition of hydrochloric acid to precipitate the remaining casein micelles. As a comparison with acid precipitation, caseins were also precipitated with 200 mM CaCl2, pH 4.6, to obtain a final concentration of 60 mM CaCl2. The samples were then centrifuged at 4000 × g for 30 min, and the supernatants were collected. The centrifugation step was repeated and the supernatants were collected. The supernatant from acid precipitation was concentrated 20 times using a 50 kDa molecular weight cut-off centrifugal filter device (Amicon, Millipore, Billerica, MA, USA). The concentrate was diluted in the affinity chromatography running buffer (100 mM Tris HCl (pH 8), or 100 mM Tris HCl (pH 8), 0.05% Tween 20, 0.05 M NaCl) and gently shaken for 30 min.
Affinity chromatography was performed by manually packing heparine Sepharose beads (GE Healthcare Life Sciences, Pittsburgh, PA, USA) into a 12-mL polypropylene column as a chromatographic support. The column was equilibrated with the running buffer. The loading, washing and elution steps was performed manually on the column. The whey protein sample was loaded onto the column. The flow-through was collected and reloaded on the column to increase lactoferrin-binding efficiency. This step was repeated two times. The sample was incubated with the heparin Sepharose beads for 3 h. The column was washed with running buffer to remove non-specifically bound proteins. The bound protein was eluted with a step-wise gradient using NaCl concentrations ranging from 0.1 to 1 M NaCl. Fractions were collected for each salt concentration and analyzed on 12% SDS-PAGE. Fractions with higher lactoferrin concentration (without many other protein bands) were dialyzed (Spectra/Por® 1 dialysis tubing, MWCO 6000–8000) against water. Protein concentrations were determined by the Bradford assay using bovine serum albumin as the standard [34].
2.2 Protein identification
To identify the goat milk lactoferrin, the gel band with a molecular weight around 78 kDa (the molecular weight of lactoferrin) was excised and cut into pieces. To weaken the gel, these pieces were washed with successive baths of 100 mM NH4HCO3, pH 8, and pure ACN for 10 min each under agitation. This step was repeated three times. The gel pieces were incubated in a mixture of 100 mM NH4HCO3 and ACN (50:50) for 30 min. Digestion was performed with 20 μg of trypsin (Promega, Madison, WI, USA) in 100 mM NH4HCO3, pH 8, overnight at 37°C. Digested peptides were extracted with two baths of 5% TFA, 60% ACN in water (v/v) for 30 min. The samples were dried overnight by vacuum centrifugation (Genevac, Stone Ridge, NY) and resuspended in 20 μL of water prior to MS analysis.
2.3 N-glycan release and purification
Purified lactoferrin (100 μg) in water was dried and reconstituted in 100 μL of 100 mM NH4HCO3 (pH 8), 10 mM DTT. Samples were heated for 5 min at 90°C to denature the protein. Two microliters of 500,000 units/mL peptidyl-N-glycosidase F (New England BioLabs, Ipswich, MA, USA) were added to the sample. The mixture was incubated overnight at 37°C. Deglycosylated lactoferrin was removed using a C8 solid-phase extraction column (DSC-C8 Discovery, 3-mL tube capacity, 500-mg bed weight, Supelco, Bellefonte, PA, USA). The cartridge was conditioned with three volumes of 80% ACN, 0.1% TFA in water (v/v) and washed by three volumes of water. The sample was loaded and the N-glycans were eluted with six volumes of water. The N-glycan solution was loaded on a graphitized carbon cartridge (GCC-SPE, 150 mg carbon, 4-mL tube capacity, Alltech, Deerfield, IL, USA) that was washed as described above for the C8 cartridge. The GCC cartridge was washed with three volumes of water, and the N-glycans were eluted with three volumes of 40% ACN, 0.1% TFA in water (v/v). The enriched N-glycan fraction was dried overnight by vacuum centrifugation. N-glycans were rehydrated in 60 μL of water prior to MS analysis.
2.4 Nano-LC-Chip-Q-TOF MS
The N-glycan and peptide samples were analyzed using the Agilent 6520 accurate-mass Q-TOF LC/MS with a microfluidic nano-electrospray chip (Agilent Technologies, Santa Clara, CA, USA). The N-glycans were separated using an HPLC-chip with a 40-nL enrichment column and a 43-mm × 75-μm analytical column, both packed with 5 μm of porous graphitized carbon (PGC). The peptides were separated with a C18 chip. The system was composed of a capillary and nanoflow pump, and both used binary solvents consisting of solvent A (3% ACN, 0.1% formic acid in water (v/v)) and solvent B (90% ACN, 0.1% formic acid in water (v/v)). Two microliters of sample were loaded with solvent A at a capillary pump flow rate of 4 μL/min. The N-glycan separation was performed on a 65-min gradient delivered by the nanopump at a flow rate of 0.3 μL/min. The 65-min gradient followed this program: 0% B (0.0–2.5 min), 0 to 16% B (2.5–20.0 min), 16 to 44% B (20.0–30.0 min), 44 to 100% B (30.0–35.0 min) and 100% B (35.0–45.0 min). The gradient was followed by equilibration at 0% B (45.0–65.0 min). For the peptide analysis, the gradient was 0 to 8% B (0.0–5.0 min), 8 to 26.5% B (5.0–24.0 min), 26.5 to 100% B (24.0–48.0 min), 100% B (48.0–50.0 min) and 100% A for 10 min to re-equilibrate the column. Data were acquired within the mass range of 450–3000 m/z for N-glycans and 500–3000 m/z for peptides in the positive ionization mode with an acquisition rate of 2.01 spectra/s for N-glycans and 0.63 spectra/s for peptides. An internal calibrant ion of 922.010 m/z from the tuning mix (ESI-TOF Tuning Mix G1969–85000, Agilent Technologies) was used for continual mass calibration. For tandem MS analysis, the N-glycans and peptides were fragmented with nitrogen as the collision gas. Spectra were acquired within the mass range of 100–3000 m/z. The collision energy (CE) was varied according to the equation:
in which m/z was the mass-to charge ratio of the precursor ion, k was the slope and b was the y-intercept of the equation. The fragmentation energy was set at 1.8 V (k) with an offset of −2.4 (b) for glycans and 3.6 V with an offset of −4.8 for peptides. Acquisition was controlled by MassHunter Workstation Data Acquisition software (Agilent Technologies).
2.5 Peptide identification
Spectra were analyzed by a database search according to the procedure of Dallas et al. [35]. Briefly, data were exported from Agilent MassHunter in .mgf format and imported into the offline search engine X!Tandem [36]. X!Tandem searches were against a goat milk library compiled from previous goat milk proteome studies [37–39]. Peptides were accepted if e-values were ≤ 0.05, corresponding to a 95% confidence level. Masses were allowed a 20 ppm error. No complete (required) modifications were included. Potential modifications allowed were phosphorylation of serine, threonine and tyrosine; oxidation of methionine and tryptophan; deamidation of asparagine and glutamine; and dehydration of glutamic acid. A non-specific cleavage ([X]|[X]) (where X’ is any amino acid) was used to search against the protein sequences. Because the instrument did not always select the monoisotopic ion for tandem fragmentation, isotope errors were allowed (allowing up to one C13). No model refinement was employed in X!Tandem.
2.6 Identification of the N-glycans
Compounds were identified with MassHunter Qualitative Analysis software (version B.04.00 SP2, Agilent Technologies). The compounds were extracted using the Molecular Feature Extractor algorithm. The software generated extracted compound chromatograms (ECCs) in a range of 400–3,000 m/z with a ≥ 1,000 ion count cut-off, allowing charge states of +1–3, a retention time from 5–40 min and a typical isotopic distribution of small biological molecules. The resulting compounds were matched to a theoretical glycan library based on previous theoretical libraries [40, 41] and previously identified milk N-glycans from bovine and human milk [42] using a mass error tolerance of 20 ppm. The N-glycans from the library were composed of hexose (Hex), HexNAc, Fuc, N-acetylneuraminic acid (NeuAc) and N-glycolylneuraminic acid (NeuGc).
3 Results and discussion
Developing new products that mimic human milk properties is a current target for infant formula manufacturers. Lactoferrin is well conserved across mammalian species; however, the lactoferrin content is higher in human milk compared with bovine milk. This difference stimulated an increased desire of supplementing bovine milk-based infant formula with lactoferrin from other sources. Human lactoferrin has 68% and 70% primary sequence homology with bovine and goat lactoferrin, respectively [33, 43]. Because goat and bovine milk lactoferrin also have a high degree of homology (90%) [33], goat milk represents a good candidate for infant formula supplementation. However, little information is available on goat milk lactoferrin glycans compared with the bovine and human counterpart; increased knowledge on goat N-glycans will enable a better understanding of the relationship between glycan diversity and protein functionalities.
3.1 Goat milk lactoferrin purification
Obtaining a high purity lactoferrin fraction was crucial for N-glycan analysis by MS. Achieving a high-purity sample was challenging because lactoferrin (78 kDa) is present at relatively low levels in goat milk (concentration range of 0.02–0.2 mg/mL) and the majority of proteins in goat milk, the caseins (a family of acidic phosphoproteins), are present at a concentration of 26.8 g/L [44]. Due to their high concentration, caseins can easily contaminate enriched lactoferrin fractions, and lactoferrin is known to bind to caseins [45]. Caseins are organized into a supramolecular structure, the casein micelle that is sensitive to both acid and calcium precipitation. SDS-PAGE analysis showed that decreasing the pH to 4.6, which is the pI of the caseins, is more efficient for casein depletion than calcium precipitation (Fig. 1A). Casein precipitation by calcium was used by Barboza et al. [15] to eliminate casein micelles from human milk, but the lower amount of caseins in human milk compared with goat milk [46] may explain why calcium precipitation did not successfully remove the higher amounts of caseins in goat milk. Indeed, acid-precipitated whey sample contained less caseins than calcium-precipitated whey sample (Fig. 1A).
Figure 1.
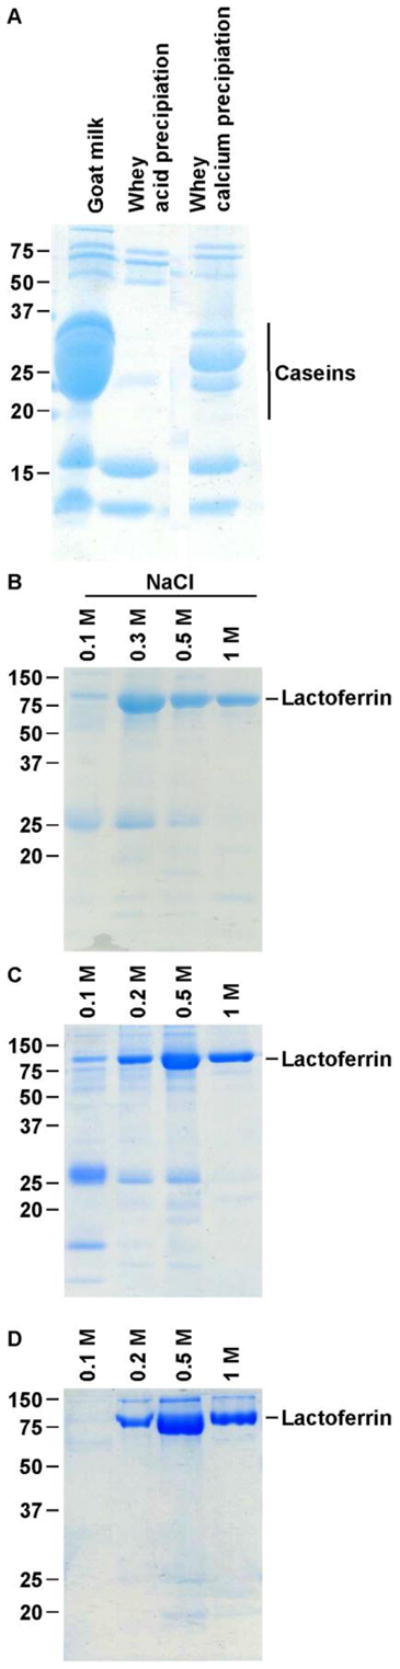
Goat milk lactoferrin purification. (A) Casein removal by calcium or acid precipitation. Caseins were precipitated from skimmed goat milk by acid precipitation at pH 4.6 or calcium precipitation with a final calcium concentration at 60 mM. The resulting whey fractions were analyzed by SDS-PAGE. (B–D) Optimization of elution conditions for goat milk lactoferrin purification. The whey sample was incubated 30 min in the running buffer and loaded on the column. The heparin Sepharose beads were washed with the running buffer and the lactoferrin was eluted with NaCl. (B) The running buffer was 100 mM Tris HCl, pH 8, and the lactoferrin was eluted with 0.1, 0.3, 0.5 and 1 M NaCl. (C) The running buffer was 100 mM Tris HCl, pH 8, and the lactoferrin was eluted with 0.1, 0.2, 0.5 and 1 M NaCl. (D) The running buffer was 100 mM Tris HCl (pH 8) 0.05% Tween 20, 0.05 M NaCl, and lactoferrin was eluted with 0.1, 0.2, 0.5 and 1 M NaCl.
After removal of milk fat by centrifugation and elimination of casein micelles by acid precipitation, whey proteins were concentrated and smaller proteins eliminated via a 50 kDa size-exclusion membrane filtration. This step also removed other small molecules, including salt, lactose, oligosaccharides and endogenous milk peptides.
Lactoferrin was purified from the remaining whey proteins via heparin Sepharose affinity chromatography. We chose this method because it is highly specific to lactoferrin [47, 48]. Indeed, despite the high similarity between lactoferrin and transferrin (also present in goat milk) [49], only lactoferrin is retained by heparin Sepharose [48]. The purification was optimized by modifying the physico-chemical conditions of the running buffer and elution solutions to improve the purity of the lactoferrin fractions. The degree of purification across these parameters was monitored by electrophoresis. Bound lactoferrin was eluted with a step-wise gradient of increasing salt concentrations ranging from 0.1 to 1 M. The elution profile in Fig. 1 shows a major band around 78 kDa that corresponded to the molecular weight of the lactoferrin [50]. The majority of the lactoferrin was eluted at 0.3 M NaCl, but various protein contaminants, including caseins, were still present (Fig. 1B). The two last fractions (0.5 M and 1 M NaCl) contained lactoferrin with high purity; however, most of the lactoferrin was lost in the previous fractions. To resolve this problem, the salt concentration of the elution buffer was modified. After this optimization, most of the lactoferrin was recovered in the 0.5 M NaCl fraction, and more contaminants were eliminated in the previous fractions with lower concentrations of NaCl (Fig. 1C). To further improve the purity of the lactoferrin-enriched fraction, salt (NaCl) and detergent (Tween 20) were added to the running buffer to disrupt the potential interactions between the lactoferrin and protein contaminants, especially residual caseins. Gel electrophoresis revealed that the addition of salt and Tween 20 to the running buffer increased the purity of the 0.5 M and 1 M NaCl lactoferrin fractions (Fig. 1D). This optimization showed that the combination of acid precipitation with a single affinity chromatography step can be employed to obtain a high purity lactoferrin fraction. Heparin Sepharose was chosen as the purification system for this research study because it affords a highly selective binding to lactoferrin and has the ability to deliver the level of high purity necessary to perform analytical mass spectrometry. However, heparin Sepharose is rather expensive and other lactoferrin purification methods are available for large-scale production. Indeed, lactoferrin has already been isolated from bovine milk at industrial scale by ion-exchange chromatography [51].
The identity of the presumed lactoferrin band (around 78 kDa) on SDS-PAGE (Fig. 1D) was confirmed by digesting the protein band with trypsin, analyzing the released peptides by tandem MS (LC-MS/MS), and identifying the sequences by database searching with X!Tandem. Twenty-six tryptic peptide sequences of goat milk lactoferrin were identified (Fig. 2A), confirming that the band represented isolated lactoferrin. An example confirmation of a peptide identity with tandem MS is shown for the goat milk lactoferrin peptide GSNFQLDQLQGQK in Fig. 2B.
Figure 2.

Identification of goat lactoferrin by peptide mass fingerprinting. (A) Peptides identified from lactoferrin by X!Tandem with a 95% confidence value. “Modifications” are the post-translational modifications, including deamidation (D), oxidation (O) and dehydration (W). (B) Deconvoluted tandem spectrum of the peptide GSNFQLDQLQGQK from goat lactoferrin. This peptide corresponded to 731.86 m/z with z = +2.
3.2 Identification of goat milk lactoferrin N-glycans
N-glycans from the purified goat milk lactoferrin were released by enzymatic digestion, further purified by solid-phase extraction and analyzed by nano-LC-Chip–Q-TOF MS. The microchip, with porous graphitized carbon enrichment and analytical columns, enabled isomer-level separation of N-glycans with reproducible retention times [52, 53].
A theoretical library for goat milk N-glycans was created based on the largest structures of the three N-glycan types (high mannose, complex and hybrid). Theoretical libraries were previously applied to analyze N-glycans from human and mouse serum [40, 41]. These libraries were constructed with the three largest oligosaccharide compositions and also based on biological rules. These structures were sequentially degraded, one monosaccharide at a time, until the N-glycan core remained. To determine the largest putative N-glycans for goat milk lactoferrin, knowledge of the milk N-glycome was applied [42]. The minimal level of each monosaccharide was nine Hex, seven HexNAc, four Fuc and two sialic acids, including NeuAc and NeuGc (Fig. 1S, Supporting Information). NeuGc was included in the library because it was identified in glycoproteins from bovine and goat milk [42, 54, 55]. The library contained 655 possible structures. Application of the theoretical N-glycan library as a mass filter in Find by Molecular Feature allowed the identification of 32 different N-glycan compositions from the goat milk lactoferrin (Table 1).
Table 1.
Identified goat milk lactoferrin N-glycans.
| N-glycan composition | |||||||||
|---|---|---|---|---|---|---|---|---|---|
|
| |||||||||
| Mass | z | m/z | Hex | HexNAc | Fuc | NeuAc | NeuGc | Glycan type | Comparison between species |
| 1072.40 | 2 | 537.21 | 4 | 2 | 0 | 0 | 0 | High mannose | Human |
| 1234.45 | 2 | 618.23 | 5 | 2 | 0 | 0 | 0 | High mannose | Bovine and human |
| 1396.51 | 2 | 699.26 | 6 | 2 | 0 | 0 | 0 | High mannose | Bovine and human |
| 1558.56 | 2 | 780.29 | 7 | 2 | 0 | 0 | 0 | High mannose | Bovine and human |
| 1720.62 | 2 | 861.32 | 8 | 2 | 0 | 0 | 0 | High mannose | Bovine and human |
| 1437.54 | 2 | 719.78 | 5 | 3 | 0 | 0 | 0 | Hybrid | Bovine and human |
| 1599.59 | 2 | 800.80 | 6 | 3 | 0 | 0 | 0 | Hybrid | Bovine |
| 1761.65 | 2 | 881.83 | 7 | 3 | 0 | 0 | 0 | Hybrid | Bovine |
| 1802.68 | 2 | 902.35 | 6 | 4 | 0 | 0 | 0 | Hybrid | Bovine |
| 1583.60 | 2 | 792.81 | 5 | 3 | 1 | 0 | 0 | Hybrid-fucosylated | Human |
| 1948.74 | 2 | 975.38 | 6 | 4 | 1 | 0 | 0 | Hybrid-fucosylated | Bovine and human |
| 1744.64 | 2 | 873.33 | 5 | 3 | 0 | 0 | 1 | Hybrid-sialylated | Goat |
| 1906.69 | 2 | 954.35 | 6 | 3 | 0 | 0 | 1 | Hybrid-sialylated | Goat |
| 2068.75 | 2 | 1035.38 | 7 | 3 | 0 | 0 | 1 | Hybrid-sialylated | Goat |
| 2052.75 | 2 | 1027.38 | 6 | 3 | 1 | 0 | 1 | Hybrid-fucosylated- sialylated | Goat |
| 1316.51 | 2 | 659.26 | 3 | 4 | 0 | 0 | 0 | Complex | Bovine |
| 1722.68 | 2 | 862.34 | 3 | 6 | 0 | 0 | 0 | Complex | Bovine |
| 1462.57 | 2 | 732.29 | 3 | 4 | 1 | 0 | 0 | Complex-fucosylated | Bovine |
| 1478.56 | 2 | 740.29 | 4 | 4 | 0 | 0 | 0 | Complex/Hybrid | Bovine and human |
| 1681.65 | 2 | 841.83 | 4 | 5 | 0 | 0 | 0 | Complex/Hybrid | Bovine |
| 1640.62 | 2 | 821.32 | 5 | 4 | 0 | 0 | 0 | Complex/Hybrid | Bovine and human |
| 1624.62 | 2 | 813.32 | 4 | 4 | 1 | 0 | 0 | Complex/Hybrid- fucosylated | Bovine and human |
| 1827.71 | 2 | 914.86 | 4 | 5 | 1 | 0 | 0 | Complex/Hybrid- fucosylated | Bovine |
| 1786.68 | 2 | 894.35 | 5 | 4 | 1 | 0 | 0 | Complex/Hybrid- fucosylated | Bovine and human |
| 1785.66 | 2 | 893.84 | 4 | 4 | 0 | 0 | 1 | Complex/Hybrid- sialylated | Goat |
| 1947.72 | 2 | 974.87 | 5 | 4 | 0 | 0 | 1 | Complex/Hybrid- sialylated | Bovine |
| 1931.73 | 2 | 966.87 | 5 | 4 | 0 | 1 | 0 | Complex/Hybrid- sialylated | Bovine and human |
| 1728.64 | 2 | 865.33 | 5 | 3 | 0 | 1 | 0 | Complex/Hybrid - sialylated | Bovine and human |
| 1915.73 | 2 | 958.87 | 4 | 4 | 1 | 1 | 0 | Complex/Hybrid- fucosylated-sialylated | Bovine |
| 2134.81 | 2 | 1068.41 | 4 | 5 | 1 | 0 | 1 | Complex/Hybrid- fucosylated--sialylated | Goat |
| 2093.78 | 2 | 1047.90 | 5 | 4 | 1 | 0 | 1 | Complex/Hybrid- fucosylated-sialylated | Bovine |
| 2077.78 | 2 | 1039.90 | 5 | 4 | 1 | 1 | 0 | Complex/Hybrid- fucosylated-sialylated | Bovine and human |
Shown are the neutral mass, charge (z), m/z, monosaccharide composition, glycan type, and whether or not the composition was found in human and/or bovine milk. Hex, Hexose; HexNAc, N-acetylglucosamine; Fuc, Fucose; NeuAc, N-acetylneuraminic acid, NeuGc; N-glycolylneuraminic acid.
From these 32 compositions, 65 total compounds were identified, resulting from the separation of structural and/or linkage isomers or anomers. The identified compositions were confirmed by tandem MS as described below. Whereas isomers can be differentiated by using tandem MS, only partial information about the possible linkage can be obtained from mass spectrometry analysis alone. Full elucidation of glycosidic linkages requires the combined use of pre-fractionated samples and sequential exoglycosidase enzymes with different linkage specificity [56]. In this fashion, all N-glycans could be fully annotated. Goat milk lactoferrin N-glycans were identified from a pool of milk from 4 different goat breeds and, also, from crossbreds. The N-glycan pool on goat milk lactoferrin was composed of the three main classes (high mannose, hybrid and complex) like the identified N-glycans of human and bovine milk lactoferrin [9, 26]. Glycosylation pattern may vary among breeds. Indeed, some studies from bovine milk revealed some variation in sialylated milk oligosaccharides concentration between cow breeds [57]. Additionally, it has shown that Jersey milk contains a few more neutral oligosaccharides compared to Holstein [58]. This study revealed five high mannose glycans, nine neutral non-fucosylated hybrid/complex glycans, six neutral fucosylated hybrid/complex glycans and 12 sialylated glycans (Table 1S, Supporting Information). The MS data showed a specific distribution of the N-glycans across retention time. The ECCs of the N-glycans from goat milk lactoferrin are shown in Fig. 3. High mannose glycans (green) eluted first, followed by the neutral complex/hybrid glycans (blue). The sialylated glycans (pink) were eluted later as the concentration of ACN in the mobile phase increased, demonstrating that their interaction with the PGC was stronger than that of the high mannose and neutral complex/hybrid glycans. Fucosylated compounds eluted after their non-fucosylated counterparts. These results are consistent with previous observations of elution patterns from PGC in human and bovine N-glycans [42, 52].
Figure 3.

Extracted compound chromatograms (ECCs) from goat milk lactoferrin N-glycans. The glycan types are differentiated by color: high mannose glycans are green, neutral hybrid/complex glycans are blue, and sialylated glycans are pink.
Of the goat milk lactoferrin N-glycans identified, 34% were fucosylated. These results are important because fucosylated glycans are known to be involved in pathogen inhibition [59]. In particular, Fuc-α1,2 glycans protect against Campylobacter pylori infection, a known cause of infant diarrhea [60]. Fucosylated glycans can also exert prebiotic activity by promoting the growth of bacteria associated with beneficial functions in the gastrointestinal tract [61]. The presence of lactoferrin could modulate the development of a protective intestinal microbiota because some bifidobacteria—the predominant bacteria in breast-fed infant gut—contain enzymes that hydrolyze the N-glycan core [62]; thus, bifidobacteria could utilize the released glycans, including fucosylated glycans. Additionally, 37% of identified N-glycans were sialylated. Sialic acid-containing glycans protect against rotavirus infection, which is another of main pathogens causing infant diarrhea [63].
3.3 MS/MS analysis of N-glycans
Goat milk lactoferrin N-glycans were initially identified from the mass spectra based on accurate mass match to the library. Tandem MS was performed to confirm N-glycan compositions. MS/MS analysis generated specific fragment ions that are common to all N-glycans, including 163.06 m/z [Hex+H]+1, 204.09 m/z [HexNAc+H]+1 and 366.14 m/z [HexNAc-Hex+H]+1. To facilitate data analysis, spectra were screened for the presence of these fragment ions. The deconvoluted tandem spectra with 792.79 m/z (z = +2), which corresponded to a hybrid-fucosylated glycan (5Hex-3HexNAc-1Fuc), is shown in Fig. 2SA, Supporting Information. The spectrum shows the presence of the fragment ions described above. This compound has multiple potential isomers. The isomers observed due to PGC separation result from different enzymatic actions in the mammary epithelial cell [64]. Each structure may differently affect lactoferrin function. Tandem mass spectra can be analyzed for fragments that can disambiguate between various possible structures. For example, two isomers for 792.79 m/z (z = +2) with two different positions of the Fuc residue are shown in Fig. 2S, Supporting Information. To determine the position of Fuc, the spectra were screened for the specific fragments represented in Fig. 2SB, Supporting Information. The deconvoluted tandem spectrum of the glycan 5Hex-3HexNAc-1Fuc showed the presence of the fragment 1056.37 Da, which corresponded to the mass of 3Hex- 2HexNAc-1Fuc. This result suggests the attachment of the Fuc to the HexNAc residue in the N-glycan core rather than to the other HexNAc of the compound, as described in Fig. 2SB, Supporting Information.
3.4 LC-MS/MS analysis of NeuAc- and NeuGc-containing N-glycans
Data analysis revealed that goat milk lactoferrin N-glycans contained NeuAc or NeuGc. Both NeuAc- and NeuGc-containing N-glycans are present on bovine milk proteins, but NeuGc-containing N-glycans are not present on human milk proteins [42, 53]. In some instances, accurate mass alone is not sufficient to positively identify N-glycan compositions. For instance, 1Fuc-1NeuGc and 1Hex-1NeuAc have the same molecular formula and, consequently, the same mass (453.15 Da). The composition of these glycans can be resolved by tandem MS. The N-glycans containing sialic acids were screened for specific NeuAc or NeuGc fragments. An MS/MS spectrum for NeuAc-containing N-glycans typically includes fragments with 292.10 m/z [NeuAc+H]+1, 274.09 m/z [NeuAc-H2O+H]+1 and 657.23 m/z [Hex-HexNAc-NeuAc+H]+1. A deconvoluted tandem spectrum with 865.32 m/z (z = +2), which corresponded to the neutral mass 1728.63, is shown in Fig. 4A. This spectrum reveals that the neutral masses of fragments corresponded to the specific monosaccharides and the trisaccharide described previously. The composition of this compound was 5Hex-3HexNAc-1NeuAc. NeuGc-containing N-glycan tandem spectra typically include 308.10 m/z [NeuGc+H]+1, 290.10 m/z [NeuGc-H2O+H]+1 and 673.23 m/z [Hex-HexNAc-NeuGc]+1. These fragments were observed for the compound with 1068.40 m/z (z = +2), which corresponds to the neutral mass 2134.76 (Fig. 4B). The composition of this compound is 4Hex-5HexNAc-1Fuc-1NeuGc.
Figure 4.

MS/MS analysis of NeuAc and NeuGc N-glycans. (A) Deconvoluted tandem spectrum of the NeuAc-sialylated N-glycan 5Hex-3HexNAc-1NeuAc from goat milk lactoferrin. This glycan corresponded to 865.32 m/z with z = +2. The tandem spectrum contained fragments with neutral mass of 291.10 [NeuAc], 273.09 [NeuAc-H2O] and 656.23 [Hex-HexNAc-NeuAc]. (B) Deconvoluted tandem spectrum of the NeuGcsialylated N-glycan 4Hex-5HexNAc-1Fuc-1NeuGc from goat milk lactoferrin. This glycan corresponded to 1068.40 m/z with z = +2. The spectrum was characterized by fragments with neutral mass of 307.09 [NeuGc], and 289.08 [NeuGc-H2O]. NeuAc, N-acetylneuraminic acid; NeuGc, N-glycolylneuraminic acid.
Green circles, yellow circles, blue squares, red triangles, purple diamonds and gray diamonds represent mannose, galactose, HexNAc, Fuc, NeuAc and NeuGc residues, respectively.
3.5 Comparison with human and bovine milk N-glycome
The N-glycans identified in goat milk lactoferrin were compared with those in human and bovine milk (Fig. 5). Goat milk lactoferrin resulted to have 24 and 15 N-glycans in common with the N-glycomes of bovine and human milk, respectively, and 13 were common among the three species. The majority of the high mannose N-glycans was conserved across these species. Two N-glycans were identified in both human milk and goat milk lactoferrin that were absent from bovine milk. These experiments revealed a significant degree of homology for lactoferrin N-glycans between human and goat milk, suggesting that goat milk could be used as a source of functional components, including lactoferrin, for infant formula supplementation.
Figure 5.

Comparison of goat milk lactoferrin N-glycan compositions with the known human and bovine milk N-glycomes.
Differences were also observed among the three species within the hybrid and complex structures containing Fuc and sialic acids. The number of fucosylated N-glycans of goat milk lactoferrin was slightly lower than that on bovine milk lactoferrin (41% and 34% of all N-glycans were fucosylated in bovine milk and goat milk lactoferrin, respectively). The percentage of fucosylation in human milk (63/65%) [42, 53] is higher than in goat milk lactoferrin and bovine milk. Goat milk lactoferrin contains 37.5% of sialylated N-glycans. This value is less than the bovine milk N-glycome (43%) and close to the human milk N-glycome (31/38%) [42, 53]. Among the 32 N-glycan compositions identified from goat milk lactoferrin, six were absent from the bovine and human milk N-glycome. These glycans may have unique health-improving functions that could enhance the development and protection of the infant.
4 Concluding remarks
Current interest in lactoferrin is related to its functional roles, including antimicrobial action. However, all the mechanisms involved in lactoferrin’s antibacterial actions have not been well elucidated including the role of glycosylation in the protection against pathogen infection. The N-glycans identified in this study could enable future investigations of the effects of glycosylation on this protein’s function.
This study reveals a high diversity for N-glycan structures in goat milk lactoferrin that may help infants’ health by decreasing pathogen infection. The analytical platform used enabled a comprehensive profiling of N-glycans, of a protein purified from a complex mixture, with high resolution and separation of isomeric forms. The N-glycan compositions were identified by an automated data analysis using a theoretical library for goat milk glycoproteins. This library was created combining biological rules and previous knowledge on milk N-glycome; the library will find applications in the N-glycan identification for other glycoproteins in goat milk or other sources.
As the search for novel functional foods increases, producers can turn towards other sources of bioactive proteins than bovine milk. An abundant source of goat lactoferrin that will enable infant formula supplementation is the significant amount of whey generated during the production of goat cheese. This study contributed to increase the knowledge on goat milk lactoferrin and showed that goat milk lactoferrin is a good candidate to supplement bovine based infant formula because of the homology in the N-glycan composition with its human counterpart. Additionally, a variety of dairy products, from cheese to yogurts, to liquid milk could be fortified with lactoferrin to promote health in the general population.
Supplementary Material
Acknowledgments
The authors thank CJ Dillard for critical reading of the manuscript and Agilent Technology for assistance with the instrumentation. The authors gratefully acknowledge Jan Carlson from the dairy goat research facility in the Department of Animal Science, University of California, Davis, for providing the goat milk used in this study. The authors thank INRA for partly funding this study. The authors also acknowledge support from the NIH NCCAM (grant R01AT007079) and from the UC Davis Peter J. Shields Endowed Chair in Dairy Food Science.
Abbreviations
- ECCs
extracted compound chromatograms
- GCC
graphitized carbon column
- Fuc
fucose
- Hex
hexose
- HexNAc
N-acetylglucosamine
- NeuAc
N-acetylneuraminic acid
- NeuGc
N-glycolylneuraminic acid
- N-glycan
N-linked glycan
- PGC
porous graphitized carbon
Footnotes
The authors have declared no conflict of interest.
References
- 1.Coppa GV, Zampini L, Galeazzi T, Gabrielli O. Digest Liver Dis. 2006;38(Supplement 2):S291–S294. doi: 10.1016/S1590-8658(07)60013-9. [DOI] [PubMed] [Google Scholar]
- 2.Yekta MA, Verdonck F, Van Den Broeck W, Goddeeris B, Cox E, Vanrompay D. Vet Med- CZECH. 2010;55:359–368. [Google Scholar]
- 3.Zivkovic AM, German JB, Lebrilla CB, Mills DA. Proc Natl Acad Sci USA. 2010;108:4653–4658. doi: 10.1073/pnas.1000083107. [DOI] [PMC free article] [PubMed] [Google Scholar]
- 4.de Wit JN. J Dairy Sci. 1998;81:597–608. doi: 10.3168/jds.s0022-0302(98)75613-9. [DOI] [PubMed] [Google Scholar]
- 5.Froehlich JW, Dodds ED, Barboza M, McJimpsey EL, Seipert RR, Francis J, An HJ, Freeman S, German JB, Lebrilla CB. J Agric Food Chem. 2010;58:6440–6448. doi: 10.1021/jf100112x. [DOI] [PMC free article] [PubMed] [Google Scholar]
- 6.Masson PL, Heremans JF, Dive CH. Clin Chim Acta. 1966;14:735–739. [Google Scholar]
- 7.Lönnerdal B. Am J Clin Nutr. 2003;77:1537S–1543S. doi: 10.1093/ajcn/77.6.1537S. [DOI] [PubMed] [Google Scholar]
- 8.Nagasawa T, Kiyosawa I, Kuwahara K. J Dairy Sci. 1972;55:1651–1659. doi: 10.3168/jds.S0022-0302(72)85741-2. [DOI] [PubMed] [Google Scholar]
- 9.Smilowitz JT, Totten SM, Huang J, Grapov D, Durham HA, Lammi-Keefe CJ, Lebrilla C, German JB. J Nutr. 2013;12:1906–1912. doi: 10.3945/jn.113.180695. [DOI] [PMC free article] [PubMed] [Google Scholar]
- 10.Harmon RJ, Schanbacher FL, Ferguson LC, Smith KL. Am J Vet Res. 1975;36:1001–1007. [PubMed] [Google Scholar]
- 11.Hiss S, Meyer T, Sauerwein H. Small Ruminant Res. 2008;80:87–90. [Google Scholar]
- 12.Legrand D, Elass E, Carpentier M, Mazurier J. Cell and Mol Life Sci. 2005;62:2549–2559. doi: 10.1007/s00018-005-5370-2. [DOI] [PMC free article] [PubMed] [Google Scholar]
- 13.Orsi N. Biometals. 2004;17:189–196. doi: 10.1023/b:biom.0000027691.86757.e2. [DOI] [PubMed] [Google Scholar]
- 14.Seganti L, Di Biase AM, Marchetti M, Pietrantoni A, Tinari A, Superti F. Biometals. 2004;17:295–299. doi: 10.1023/b:biom.0000027708.27142.bc. [DOI] [PubMed] [Google Scholar]
- 15.Barboza M, Pinzon J, Wickramasinghe S, Froehlich JW, Moeller I, Smilowitz JT, Ruhaak LR, Huang J, Lönnerdal B, German JB. Mol Cell Proteomics. 2012;11:015248. doi: 10.1074/mcp.M111.015248. [DOI] [PMC free article] [PubMed] [Google Scholar]
- 16.Stevenson L, Knowles G. Dairy Products in Human Health and Nutrition. World Symposium; Dairy Industry Association of Australia; pp. 135–139. [Google Scholar]
- 17.Boland M, MacGibbon A, Hill J. Livest Prod Sci. 2001;72:99–109. [Google Scholar]
- 18.Slacanac V, Bozanic R, Hardi J, Rezessyne Szabo J, Lucan M, Krstanovic V. Int J Dairy Technol. 2010;63:171–189. [Google Scholar]
- 19.Atanasova J, Ivanova I. Biotechnol Biotech Eq. 2010;24:1799–1803. [Google Scholar]
- 20.Kim Y, Kim MJ, Han KS, Imm JY, Oh S, Kim SH. Int J Dairy Technol. 2009;62:277–281. [Google Scholar]
- 21.Recio I, Visser S. Int Dairy J. 2000;10:597–605. [Google Scholar]
- 22.Martinez-Ferez A, Guadix A, Guadix E. J Membr Sci. 2006;276:23–30. [Google Scholar]
- 23.Meyrand M, Dallas DC, Caillat H, Bouvier F, Martin P, Barile D. Small Ruminant Res. 2013;113:411–420. doi: 10.1016/j.smallrumres.2013.03.014. [DOI] [PMC free article] [PubMed] [Google Scholar]
- 24.Hua S, Nwosu CC, Strum JS, Seipert RR, An HJ, Zivkovic AM, German JB, Lebrilla CB. Anal and Bioanal Chem. 2011;403:1291–1302. doi: 10.1007/s00216-011-5109-x. [DOI] [PubMed] [Google Scholar]
- 25.Nwosu CC, Strum JS, An HJ, Lebrilla CB. Anal Chem. 2010;82:9654–9662. doi: 10.1021/ac101856r. [DOI] [PMC free article] [PubMed] [Google Scholar]
- 26.Nwosu CC, Huang J, Aldredge DL, Strum JS, Hua S, Seipert RR, Lebrilla CB. Anal Chem. 2012;85:956–963. doi: 10.1021/ac302574f. [DOI] [PMC free article] [PubMed] [Google Scholar]
- 27.Baker EN, Baker HM. Biochimie. 2009;91:3–10. doi: 10.1016/j.biochi.2008.05.006. [DOI] [PubMed] [Google Scholar]
- 28.Ohtsubo K, Marth JD. Cell. 2006;126:855–867. doi: 10.1016/j.cell.2006.08.019. [DOI] [PubMed] [Google Scholar]
- 29.Stanley P, Schachter H, Taniguchi N. In: Essentials of Glycobiology. Varki A, Cummings RD, Esko JD, Freeze HH, Stanley P, Bertozzi CR, Hart GW, Etzler ME, editors. Cold Spring Harbor Laboratory Press; Cold Spring Harbor (NY): 2009. [PubMed] [Google Scholar]
- 30.Marth JD, Grewal PK. Nat Rev Immunol. 2008;8:874–887. doi: 10.1038/nri2417. [DOI] [PMC free article] [PubMed] [Google Scholar]
- 31.Shental-Bechor D, Levy Y. Curr Opin Struct Biol. 2009;19:524–533. doi: 10.1016/j.sbi.2009.07.002. [DOI] [PubMed] [Google Scholar]
- 32.Bode L. Glycobiology. 2012;22:1147–1162. doi: 10.1093/glycob/cws074. [DOI] [PMC free article] [PubMed] [Google Scholar]
- 33.Leprovost F, Nocart M, Guerin G, Martin P. Biochem and Biophys Res Commun. 1994;203:1324–1332. doi: 10.1006/bbrc.1994.2327. [DOI] [PubMed] [Google Scholar]
- 34.Bradford MM. Anal Biochem. 1976;72:248–254. doi: 10.1016/0003-2697(76)90527-3. [DOI] [PubMed] [Google Scholar]
- 35.Dallas DC, Guerrero A, Khaldi N, Castillo PA, Martin WF, Smilowitz JT, Bevins CL, Barile D, German JB, Lebrilla CB. J Proteome Res. 2013;12:2295–2304. doi: 10.1021/pr400212z. [DOI] [PMC free article] [PubMed] [Google Scholar]
- 36.Craig R, Beavis RC. Bioinformatics. 2004;20:1466–1467. doi: 10.1093/bioinformatics/bth092. [DOI] [PubMed] [Google Scholar]
- 37.Cebo C, Caillat H, Bouvier F, Martin P. J Dairy Sci. 2010;93:868–876. doi: 10.3168/jds.2009-2638. [DOI] [PubMed] [Google Scholar]
- 38.Olumee-Shabon Z, Swain T, Smith EA, Tall E, Boehmer JL. J Dairy Sci. 2013;96:2903–2912. doi: 10.3168/jds.2012-5956. [DOI] [PubMed] [Google Scholar]
- 39.Roncada P, Gaviraghi A, Liberatori S, Canas B, Bini L, Greppi GF. Proteomics. 2002;2:723–726. doi: 10.1002/1615-9861(200206)2:6<723::AID-PROT723>3.0.CO;2-I. [DOI] [PubMed] [Google Scholar]
- 40.Hua S, Jeong HN, Dimapasoc LM, Kang I, Han C, Choi JS, Lebrilla CB, An HJ. Anal Chem. 2013;85:4636–4643. doi: 10.1021/ac400195h. [DOI] [PMC free article] [PubMed] [Google Scholar]
- 41.Kronewitter SR, An HJ, de Leoz ML, Lebrilla CB, Miyamoto S, Leiserowitz GS. Proteomics. 2009;9:2986–2994. doi: 10.1002/pmic.200800760. [DOI] [PMC free article] [PubMed] [Google Scholar]
- 42.Nwosu CC, Aldredge DL, Lee H, Lerno LA, Zivkovic AM, German JB, Lebrilla CB. J Proteome Res. 2012;11:2912–2924. doi: 10.1021/pr300008u. [DOI] [PMC free article] [PubMed] [Google Scholar]
- 43.Pakkanen R, Aalto J. Int Dairy J. 1997;7:285–297. [Google Scholar]
- 44.Holt C, Jenness R. Comp Biochem Physiol Part A: Physiology. 1984;77:275–282. doi: 10.1016/0300-9629(84)90060-4. [DOI] [PubMed] [Google Scholar]
- 45.Anema SG, de Kruif CG. Biomacromolecules. 2011;12:3970–3976. doi: 10.1021/bm200978k. [DOI] [PubMed] [Google Scholar]
- 46.Martin P, Ferranti P, Leroux C, Addeo F. In: Advanced Dairy Chemistry—1 Proteins. Fox PF, McSweeney PLH, editors. Springer US; 2003. pp. 277–317. [Google Scholar]
- 47.Paramasivam M, Saravanan K, Uma K, Sharma S, Singh TP, Srinivasan A. Protein Expres Purif. 2002;26:28–34. doi: 10.1016/s1046-5928(02)00528-4. [DOI] [PubMed] [Google Scholar]
- 48.Wang CS, Chan WY, Kloer HU. Comp Biochem Phys B. 1984;78:575–580. doi: 10.1016/0305-0491(84)90100-7. [DOI] [PubMed] [Google Scholar]
- 49.Park YW, Juárez M, Ramos M, Haenlein GFW. Small Ruminant Res. 2007;68:88–113. [Google Scholar]
- 50.Hurley WL, Grieve RCJ, Magura CE, Hegarty HM, Zou S. J Dairy Sci. 1993;76:377–387. doi: 10.3168/jds.S0022-0302(93)77356-7. [DOI] [PubMed] [Google Scholar]
- 51.Tomita M, Wakabayashi H, Shin K, Yamauchi K, Yaeshima T, Iwatsuki K. Biochimie. 2009;91:52–57. doi: 10.1016/j.biochi.2008.05.021. [DOI] [PubMed] [Google Scholar]
- 52.Chu CS, Niñonuevo MR, Clowers BH, Perkins PD, An HJ, Yin H, Killeen K, Miyamoto S, Grimm R, Lebrilla CB. Proteomics. 2009;9:1939–1951. doi: 10.1002/pmic.200800249. [DOI] [PMC free article] [PubMed] [Google Scholar]
- 53.Dallas DC, Martin WF, Strum JS, Zivkovic AM, Smilowitz JT, Underwood MA, Affolter M, Lebrilla CB, German JB. J Agric Food Chem. 2011;59:4255–4263. doi: 10.1021/jf104681p. [DOI] [PMC free article] [PubMed] [Google Scholar]
- 54.Addeo F, Soulier S, Pelissier JP, Chobert JM, Mercier JC, Ribadeau-Dumas B. J Dairy Res. 1978;45:191–196. doi: 10.1017/s0022029900016368. [DOI] [PubMed] [Google Scholar]
- 55.Moreno FJ, Recio I, Olano A, Lopez-Fandino R. J Dairy Res. 2001;68:197–208. doi: 10.1017/s002202990100471x. [DOI] [PubMed] [Google Scholar]
- 56.Aldredge DL, Geronimo MR, Hua S, Nwosu CC, Lebrilla CB, Barile D. Glycobiology. 2013;23:664–676. doi: 10.1093/glycob/cwt007. [DOI] [PMC free article] [PubMed] [Google Scholar]
- 57.McJarrow P, van Amelsfort-Schoonbeek J. Int Dairy J. 2004;14:571–579. [Google Scholar]
- 58.Sundekilde UK, Barile D, Meyrand M, Poulsen NA, Larsen LB, Lebrilla CB, German JB, Bertram HC. J Agric Food Chem. 2012;60:6188–6196. doi: 10.1021/jf300015j. [DOI] [PMC free article] [PubMed] [Google Scholar]
- 59.Newburg DS. J Animal Sci. 2009;87:26–34. doi: 10.2527/jas.2008-1347. [DOI] [PubMed] [Google Scholar]
- 60.Morrow AL, Ruiz-Palacios GM, Jiang X, Newburg DS. J Nut. 2005;135:1304–1307. doi: 10.1093/jn/135.5.1304. [DOI] [PubMed] [Google Scholar]
- 61.Marcobal A, Barboza M, Froehlich JW, Block DE, German JB, Lebrilla CB, Mills DA. J Agric Food Chem. 2010;58:5334–5340. doi: 10.1021/jf9044205. [DOI] [PMC free article] [PubMed] [Google Scholar]
- 62.Garrido D, Dallas DC, Mills DA. Microbiology. 2013;159:649–664. doi: 10.1099/mic.0.064113-0. [DOI] [PMC free article] [PubMed] [Google Scholar]
- 63.Yolken RH, Peterson JA, Vonderfecht SL, Fouts ET, Midthun K, Newburg DS. J Clin Invest. 1992;90:1984–1991. doi: 10.1172/JCI116078. [DOI] [PMC free article] [PubMed] [Google Scholar]
- 64.Kunz C, Rudloff S, Baier W, Klein N, Strobel S. Annu Rev Nutr. 2000;20:699–722. doi: 10.1146/annurev.nutr.20.1.699. [DOI] [PubMed] [Google Scholar]
Associated Data
This section collects any data citations, data availability statements, or supplementary materials included in this article.