Abstract
The preparation, characterization, and use of a UV responsive non-woven nanofiber polymeric mesh is reported that transitions from being hydrophobic to hydrophilic. Three distinct wetting profiles are observed during the wetting process. 3D hydrophilic cavities were created within the hydrophobic bulk material by using a photo mask to control the geometry and UV exposure time to control the depth of the region.
Control over polymeric material properties such as phase transition temperatures,1 degradation rates,2 and/or hydrophobicity3 are of interest for many biomedical and industrial applications.4 Methods that enable real-time alteration or spatial control over these property changes are of particular utility as it provides even greater control and functionality.5 As such, approaches employing external triggers like temperature,6 pH,3b, 7 and light5, 8 offer significant opportunities to address this need.4a Our interest is in polymeric meshes or scaffolds where changes in hydrophobicity can be induced using light to afford wetting of a material at the surface and bulk. Herein, we describe the fabrication of photo responsive electrospun polymeric nano-fiber meshes, the transition from a hydrophobic to a hydrophilic material upon light exposure, the kinetics of the wetting process and its agreement with previous theoretical work, the creation of defined three-dimensional (3D) hydrophilic cavities within the mesh, the characterization of these cavities using X-ray micro CT imaging, and use of these materials for a pilot protein adsorption/cell patterning study.
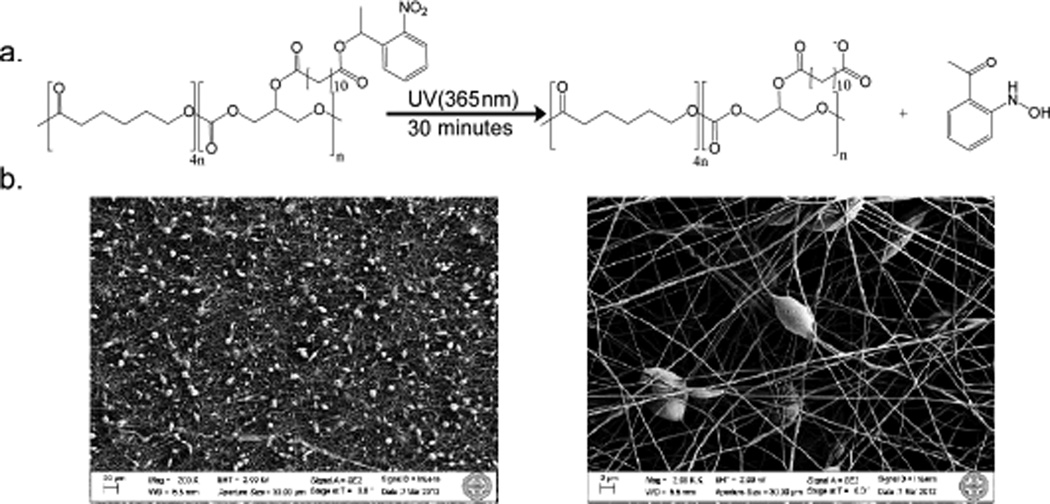
Photo activated wetting of a surface can be either reversible or irreversible.9 Surfaces displaying reversible changes in hydrophobicity upon exposure to UV light rely on strategies such as inducing the cis-to-trans transition in azobenzene derivatives10 or creating photo generated electrons or holes in titanium oxide or zinc oxide materials.11 Non-reversible light induced hydrophobicity changes typically rely on photo labile protecting groups which cleave in the presence of light exposing more hydrophilic moieties.5 A common and extensively studied family of photo labile protecting groups is the ortho-nitrobenzyl derivatives, where upon excitation at long wavelength UV light (~365 nm), the group is cleaved.12 Within this family, the 1-(2-nitrophenyl) ethyl (NPE) protecting group is particularly advantageous since it cleaves faster and forms a less harmful nitrosoketone rather than a nitrosoaldehyde compared to the ortho-nitrobenzyl group.12b Consequently, we selected this group for protection of a carboxylic acid, and then this photo active functionality was linked to the secondary hydroxyl of a glycerol repeat unit in a co-polymer composed of glycerol and 6-hydroxycaproic acid for subsequent mesh formation.
Specifically, poly(glycerol-co-ε-caprolactone) (1:4) (PGC) was synthesized following a previously published protocol,13 and 12-(1-(2-nitrophenyl)ethoxy)-12-oxododecanoic acid (C12-NPE) was attached to the free hydroxyl of the PGC through an ester linkage using a DCC coupling method. The UV active polymer, poly(glycerol 12-(1-(2-nitrophenyl)ethoxy)-12-oxododecanoic acid-co-caprolactone) (PGC-C12-NPE; 8.2 kg/mol), was dissolved in a 5:1 chloroform:methanol solution with poly(ε-caprolactone) (PCL) (70–90 kg/mol, Sigma) at a 3:7 weight ratio. The resulting polymer solution, at 10% by weight, was electrospun to give photo responsive meshes. Scanning electron microscopy reveals micrometer (~3–5 µm beads) and nanometer (fiber diameters ~100–150 nm) scale textures on the surface (see supporting information for experimental details).
NMR spectroscopy was used to confirm the photolysis of the NPE group from the polymeric mesh side chains after various UV exposure times. The integration of the peak at ~6.3ppm, which corresponds to the lone hydrogen on the carbon linking the NPE group to the alkyl chain, was followed (Figure S1). An exponential fit was applied to the deprotection kinetics resulting in a strong correlation with the data (R2=0.9975) where after 15 minutes of exposure 61.8±24% of the NPE groups were deprotected and after 60 minutes 99.1±1.5% of the groups were removed (n=3). No backbone polymer degradation was observed via GPC analysis, even after 120 minutes (21.6 J/cm2) of UV exposure (Table S1).
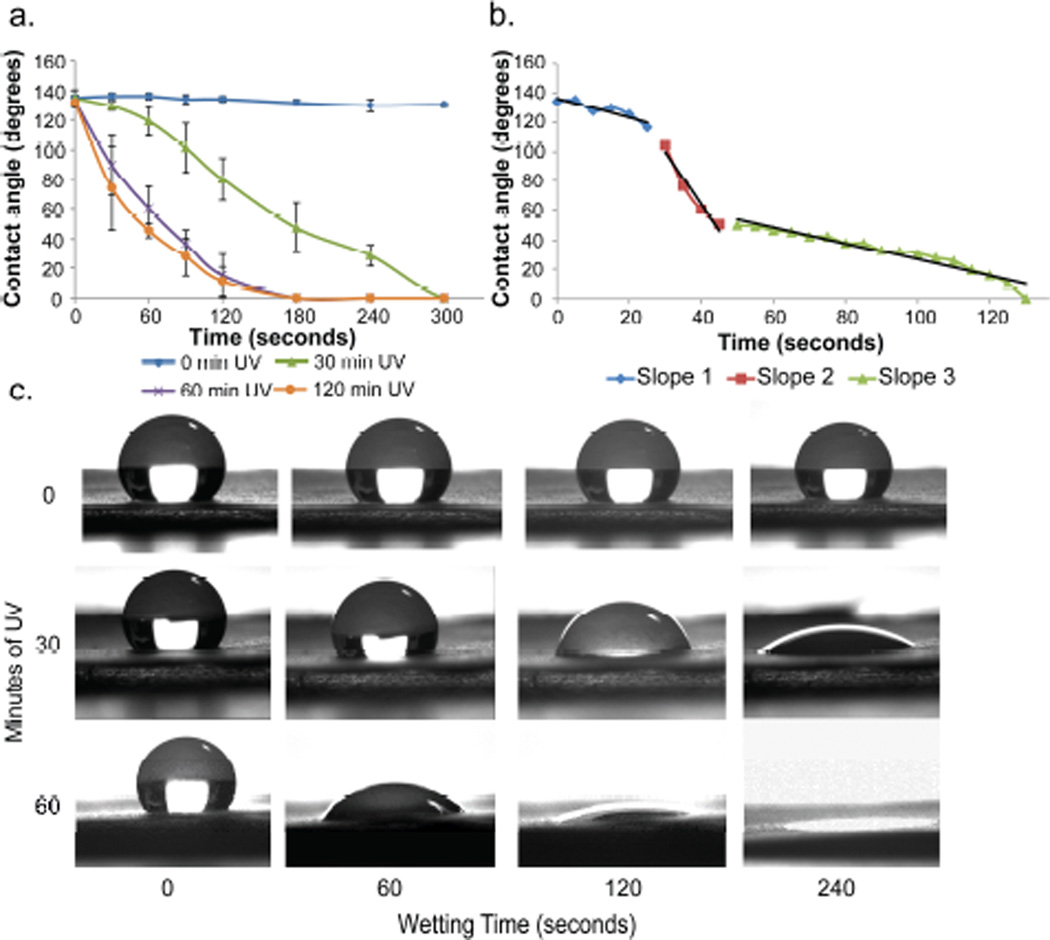
Next, a series of electrospun ~80 µm thick meshes were then exposed to UV light (λ = 365 nm,) for 0, 15, 30, 60, 90, and 120 minutes. The photoactive electrospun PGC-C12-NPE mesh exhibited a UV induced transition from a hydrophobic material, with an apparent contact angle (ACA) of ~135°, to a hydrophilic material with an ACA of ~0° after various UV exposure times (Figure 2a and Figure S2). SEM analysis of before and after photolysis showed no significant difference in fiber diameter or morphology (Figure S3). A UV dose dependent wetting profile was observed with smaller UV doses wetting more slowly over time compared to larger UV doses (5.4 J/cm2 vs. 10.8 J/cm2 for 30 minutes and 60 minutes of UV exposure, respectively). With as little as 15 minutes of UV exposure, the ACA decreased dramatically over 600 seconds compared to the unexposed control meshes (ACA ~20° vs. ~135°) (Figure S2). Doubling the UV exposure time to 30 minutes resulted in more consistent ACAs and a fully wetted surface (ACA ~0°) within 300 seconds. For all UV exposure times greater than 30 minutes, the change in ACA from the native mesh was statistically significant after 120 seconds of wetting (p< 0.05). For reference, the contact angle of a cast film of the polymer has a contact angle of 113° before UV irradiation and a contact angle of 108° after UV irradiation (120 minutes, 21.6 J/cm2).
Figure 2.
(a) UV induced hydrophobicity change from hydrophobic (~135°) to hydrophilic (~0°) ACA after 30, 60, or 120 minutes of UV exposure. The ACA of water (4 µl) on the electrospun polymeric mesh surface was measured over 300 seconds. (n=3; Avg ± SD) (b) Three distinct wetting rates for a mesh exposed to 120 minutes of UV exposure. (c) Images of a water droplet on meshes after exposure to 0, 30, or 60 minutes of UV light as a function of time.
Upon closer inspection of the wetting profiles, three distinct transitions were observed during the wetting process (Figure 2b and S4). The initial wetting rate is dictated by the Cassie-Baxter to Wenzel transition where air is slowly displaced by the water directly below it at a rate of −0.91±0.39 degrees per second. However, once the droplets reach a critical ACA of ~110°, the wetting rate dramatically increases by approximately 4 fold (−0.91±0.39 °/second vs. −3.43± 0.46 °/second) as the contact angle drops to ~50° (Table S2). The ACA then continues to decrease at a similar rate as to the initial wetting rate, until the droplet fully wets the surface (ACA = 0°) (Figure S4). Fortunately, previous theoretical work has examined this phenomenon of wetting on a hydrophilic rough surface. Ishino et al. describes this phenomenon of hydrophilic rough surfaces as a transition from the Cassie to Wenzel to Sunny-side-up state where the water begins to penetrate a rough surface beyond the boundaries of the water droplet on the surface such that it appears like a sunny-side-up egg.14
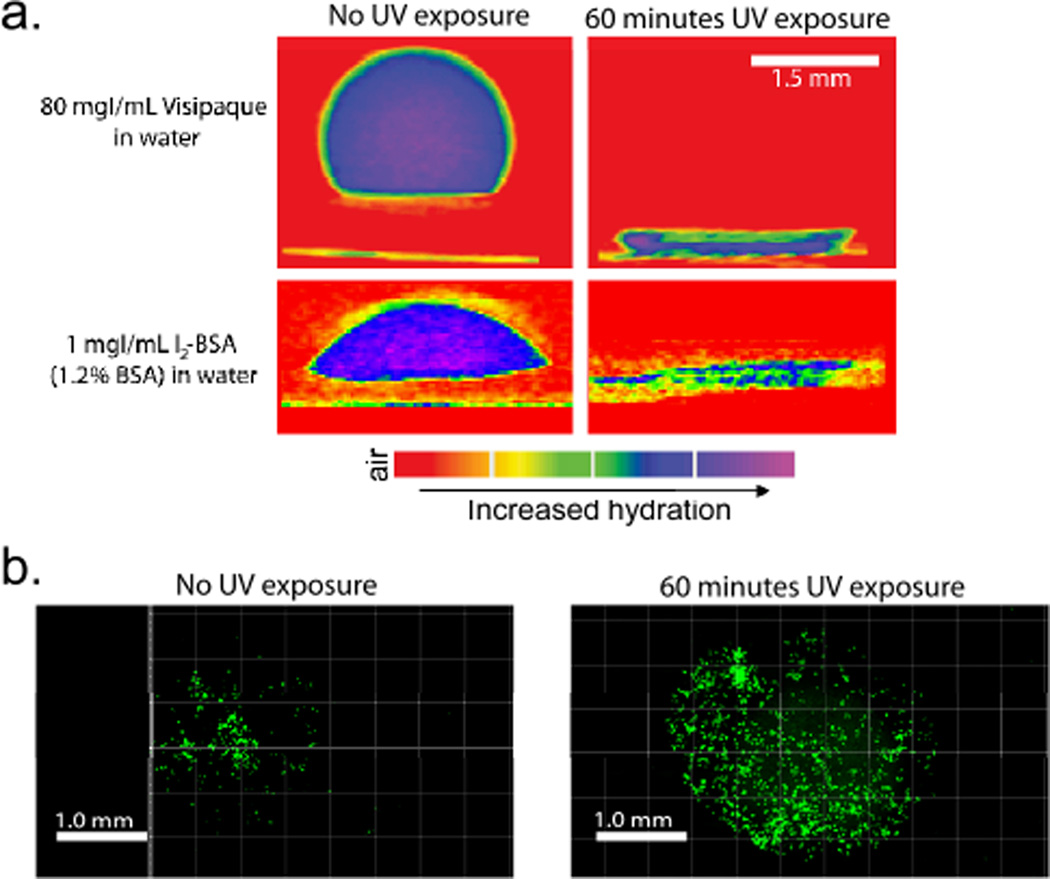
We next evaluated the utility of this photo induced wetting method to print 3D hydrophilic cavities surrounded by hydrophobic regions. Specifically, cavities of 194.2±8.2 µm and 301.1±55.7 µm depths were fabricated by exposing the photoactive meshes to UV light for 30 minutes and 60 minutes, respectively, using a circular photo mask (1590 µm in diameter). These hydrophilic regions were analysed by applying a dilute solution of a water soluble CT contrast agent (Visipaque, 80 mg of iodine per mL water, Figure S5) to the surface of the meshes and using an X-ray µCT scanner to measure the water penetration into the meshes. As shown in Figure 3a, the aqueous CT contrast agent solution was restricted to the surface of the hydrophobic mesh, and only after UV photolysis did it penetrate into the cavities. A linear relationship between the UV exposure time and the depth of the cavities was observed (Figure S6). However, the diameter of the cavities was not as well defined. The photo mask was 1590 µm in diameter while the average cavity diameters were 5803.9 ± 138.1 µm and 2709.1 ± 485.2 µm for the 30 minute and 60 minute exposure times respectively (n=3). This indicates that the hydrophobicity of the material is anisotropic where layers through the thickness of the material (XY plane: perpendicular to the fibers) are hydrophobic but across the plane of any given layer (XZ and YZ planes: parallel to the fibers), the material’s hydrophobicity is likely reduced. For the 60 minute UV exposure time point, the water infiltrates farther into the mesh and thus does not spread as much leading to a smaller diameter cavity.
Figure 3.
(a) µCT imaging of 7:3 PCL:PGC-C12-NPE electrospun meshes exposed to either 0 minutes (left) or 60 minutes (right) of 365 nm UV light through a 1590 µm in diameter photo mask. Visipaque (left) in water or an I2-BSA solution (right) was used to track wetting/adsorption into the mesh. (b) Fluorescence images of MCF7 cells (green) seeded onto meshes exposed to 0 minutes (left) and 60 minutes (right) of UV light.
These imaging results also provide insight into the mechanism of wetting as discussed earlier. The initial wetting is a result of a Cassie to Wenzel transition; however, the other two wetting rates may be associated with the anisotropic hydrophobicity of the materials where the water penetrates through XY planes more quickly than it does through XZ or YZ planes. The rapid wetting is likely a combination of the water flowing into the mesh (i.e., through photolyzed XY planes) and along the fibers of each XY plane (i.e., along the XZ and YZ planes). Once the water has reached the final deprotected XY plane, the remaining wetting is only associated with the spreading along the XY planes through the XZ and YZ planes which justifies the slower rate.
One potential application for a material with tunable hydrophobicity throughout its 3D structure is selective protein/cell patterning. A number of different strategies are used to adhere cells to a surface including the grafting of small peptides that bind to specific cell receptors (e.g., RGD); however, we will use the well-known phenomenon of protein adsorption to a surface followed by cell attachment for this pilot experiment.15 In order to observe protein adsorption to the wetted regions of mesh via CT, an iodinated bovine serum albumin (I2-BSA) was prepared16 as a model system. As before, a photolyzed cavity was prepared and a 1.2% I2-BSA solution (1 mgI/mL) was used to observe protein adsorption to the hydrophilic cavity as shown in Figure 3a where the protein adsorbs within the same 3D region as water. Next, we determined whether a human breast cancer cell line (MCF7) in fetal bovine serum containing media would selectively adhere on the hydrophilic regions of the UV active meshes. Using a live cell fluorescent stain and confocal microscopy, we observed cells adhered in the regions where the mesh wets and protein adsorbs (~2.7 mm in diameter cavities). In addition, there are approximately twice as many cells alive after 24 hours on the mesh exposed to UV light compared to the untreated control. We could not observe cells below the first layer due to poor light transmittance through the mesh, but given the porosity of the mesh (1–2 microns) we expect the majority of the cells to be at the top layer.17 Present efforts are focused on preparing a UV active mesh and procedure that allows for finer control over both the shape and the depth of hydrophilic regions printed as well as exploring different electrospinning parameters to vary mesh porosity, fiber diameter and thickness. These patterned materials maybe of interest for those conducting high throughput drug screening assays, studying cell-scaffold interactions, or studying the interactions between various cell types when arranged in predefined architectures.18
Conclusions
A photoactive non-woven nano-fiber hydrophobic mesh is reported that responds to UV light by becoming permanently more hydrophilic. A linear relationship between UV exposure and contact angle is observed with the rate of wetting increasing with greater UV exposure. SEM analysis reveals a mesh composed of nano-fibers and micro-beads with diameters between ~100–150 nm and ~3–5 µm, respectively, and is unchanged after photolysis. This morphology contributes to the roughness of the material, by enhancing the hydrophobicity and hydrophilicity of the material. A dynamic wetting profile is observed with three distinct wetting rates. Hydrophilic 3D cavities can be created within the hydrophobic mesh using a photo mask and UV exposure time to control the shape and depth of the hydrophilic regions, respectively. Mesh or scaffold materials possessing differing degrees of hydrophobicity at the surface and the bulk are of significant interest for a variety of industrial, biotechnology, and biomedical applications. This facile approach enables selective wetting of 3D regions within a material opening up additional avenues of investigation where real-time control of polymer properties are key.
Supplementary Material
Figure 1.
(a) Photoactive cleavage of NPE group yielding an exposed carboxylic acid and a nitrosoketone byproduct. (b) SEM images of electrospun PGC-C12-NPE : PCL (3:7) meshes (200× magnification (left), 2000× magnification (right))
Acknowledgments
This work was supported in part by the BU Nanomedicine Program and Cross-Disciplinary Training in Nanotechnology for Cancer (NIH R25 CA153955), the BU Nanotheranostics ARC, and the BU T32 Grant entitled Translational Research in Biomaterials (NIH T32EB006359).
Footnotes
Electronic Supplementary Information (ESI) available: Detailed experimental methods, synthesis, characterization, and supporting figures See DOI: 10.1039/c000000x/
Notes and references
- 1.a) Lendlein A, Sauter T. Macromol. Chem. Phys. 2013;214:1175–1177. [Google Scholar]; b) Serrano MC, Ameer GA. Macromol. Biosci. 2012;12:1156–1171. doi: 10.1002/mabi.201200097. [DOI] [PubMed] [Google Scholar]
- 2.a) Uhrich KE, Cannizzaro SM, Langer RS, Shakesheff KM. Chem. Rev. 1999;99:3181–3198. doi: 10.1021/cr940351u. [DOI] [PubMed] [Google Scholar]; b) Zhang H, Grinstaff MW. J. Am. Chem. Soc. 2013;135:6806–6809. doi: 10.1021/ja402558m. [DOI] [PubMed] [Google Scholar]
- 3.a) Jain JP, Sokolsky M, Kumar N, Domb AJ. Polym. Rev. 2008;48:156–191. [Google Scholar]; b) Griset AP, Walpole J, Liu R, Gaffey A, Colson YL, Grinstaff MW. J. Am. Chem. Soc. 2009;131:2469–2471. doi: 10.1021/ja807416t. [DOI] [PubMed] [Google Scholar]; c) Einmahl S, Capancioni S, Schwach-Abdellaoui K, Moeller M, Behar-Cohen F, Gurny R. Adv. Drug Delivery Rev. 2001;53:45–73. doi: 10.1016/s0169-409x(01)00220-4. [DOI] [PubMed] [Google Scholar]
- 4.a) Stuart MAC, Huck WT, Genzer J, Müller M, Ober C, Stamm M, Sukhorukov GB, Szleifer I, Tsukruk VV, Urban M. Nat. Mater. 2010;9:101–113. doi: 10.1038/nmat2614. [DOI] [PubMed] [Google Scholar]; b) Ahn S, Kasi RM, Kim S-C, Sharma N, Zhou Y. Soft Matter. 2008;4:1151–1157. doi: 10.1039/b714376a. [DOI] [PubMed] [Google Scholar]
- 5.Tomatsu I, Peng K, Kros A. Adv. Drug Delivery Rev. 2011;63:1257–1266. doi: 10.1016/j.addr.2011.06.009. [DOI] [PubMed] [Google Scholar]
- 6.a) Hayashi H, Kono K, Takagishi T. Biochim. Biophys. Acta, Biomembr. 1996;1280:127–134. doi: 10.1016/0005-2736(95)00273-1. [DOI] [PubMed] [Google Scholar]; b) Liu R, Fraylich M, Saunders BR. Colloid Polym. Sci. 2009;287:627–643. [Google Scholar]; c) Chilkoti A, Dreher MR, Meyer DE. Adv. Drug Delivery Rev. 2002;54:1093–1111. doi: 10.1016/s0169-409x(02)00060-1. [DOI] [PubMed] [Google Scholar]
- 7.a) Donini C, Robinson D, Colombo P, Giordano F, Peppas N. Int. J. Pharm. 2002;245:83–91. doi: 10.1016/s0378-5173(02)00335-6. [DOI] [PubMed] [Google Scholar]; b) Harmon ME, Kuckling D, Frank CW. Macromolecules. 2003;36:162–172. [Google Scholar]
- 8.a) Lustig SR, Everlof GJ, Jaycox GD. Macromolecules. 2001;34:2364–2372. [Google Scholar]; b) Tibbitt MW, Kloxin AM, Dyamenahalli KU, Anseth KS. Soft Matter. 2010;6:5100–5108. doi: 10.1039/C0SM00174K. [DOI] [PMC free article] [PubMed] [Google Scholar]; c) DeForest CA, Anseth KS. Angew. Chem. Int. Ed. Engl. 2012;51:1816–1819. doi: 10.1002/anie.201106463. [DOI] [PMC free article] [PubMed] [Google Scholar]; d) Katz JS, Burdick JA. Macromol. Biosci. 2010;10:339–348. doi: 10.1002/mabi.200900297. [DOI] [PubMed] [Google Scholar]
- 9.Wang S, Song Y, Jiang L. J. Photochem. Photobiol., C. 2007;8:18–29. [Google Scholar]
- 10.a) Willner I, Rubin S, Zor T. J. Am. Chem. Soc. 1991;113:4013–4014. [Google Scholar]; b) Lim HS, Han JT, Kwak D, Jin M, Cho K. J. Am. Chem. Soc. 2006;128:14458–14459. doi: 10.1021/ja0655901. [DOI] [PubMed] [Google Scholar]
- 11.a) Nakajima A, Hashimoto K, Watanabe T, Takai K, Yamauchi G, Fujishima A. Langmuir. 2000;16:7044–7047. [Google Scholar]; b) Li Y, Cai W, Duan G, Cao B, Sun F, Lu F. J. Colloid Interface Sci. 2005;287:634–639. doi: 10.1016/j.jcis.2005.02.010. [DOI] [PubMed] [Google Scholar]
- 12.a) Bochet CG. J. Am. Chem. Soc. 2002:125–142. [Google Scholar]; b) Mayer G, Heckel A. Angew. Chem., Int. Ed. 2006;45:4900–4921. doi: 10.1002/anie.200600387. [DOI] [PubMed] [Google Scholar]
- 13.Wolinsky JB, Ray WC, Colson YL, Grinstaff MW. Macromolecules. 2007;40:7065–7068. [Google Scholar]
- 14.Ishino C, Okumura K. Eur. Phys. J. E. 2008;25:415–424. doi: 10.1140/epje/i2007-10308-y. [DOI] [PubMed] [Google Scholar]
- 15.Ostuni E, Chen CS, Ingber DE, Whitesides GM. Langmuir. 2001;17:2828–2834. [Google Scholar]
- 16.Perlman RL, Edelhoch H. J. Biol. Chem. 1967;242:2416–2422. [PubMed] [Google Scholar]
- 17.Zander NE, Orlicki JA, Rawlett AM, Beebe TP., Jr J. Mater. Sci.: Mater. Med. 2013;24:179–187. doi: 10.1007/s10856-012-4771-7. [DOI] [PubMed] [Google Scholar]
- 18.a) Fernandes TG, Diogo MM, Clark DS, Dordick JS, Cabral J. Trends Biotechnol. 2009;27:342–349. doi: 10.1016/j.tibtech.2009.02.009. [DOI] [PMC free article] [PubMed] [Google Scholar]; b) Kim DH, Lee H, Lee YK, Nam JM, Levchenko A. Adv. Mater. 2010;22:4551–4566. doi: 10.1002/adma.201000468. [DOI] [PubMed] [Google Scholar]; c) Kachouie NN, Du Y, Bae H, Khabiry M, Ahari AF, Zamanian B, Fukuda J, Khademhosseini A. Organogenesis. 2010;6:234–244. doi: 10.4161/org.6.4.12650. [DOI] [PMC free article] [PubMed] [Google Scholar]; d) Kingshott P, Andersson G, McArthur SL, Griesser HJ. Curr. Opin. Chem. Biol. 2011;15:667–676. doi: 10.1016/j.cbpa.2011.07.012. [DOI] [PubMed] [Google Scholar]
Associated Data
This section collects any data citations, data availability statements, or supplementary materials included in this article.


