

Abstract
Photoacoustic (PA) detection of single absorbing targets such as nanoparticles or cells can be limited by absorption background. We show here that this problem can be overcome by using the nonlinear photoacoustics based on the differences in PA signal dependences on the laser energy from targets and background. Among different nonlinear phenomena, we focused on laser generation of nanobubbles as more efficient PA signal amplifiers from strongly absorbing, highly localized targets in the presence of spatially homogenous absorption background generating linear signals only. This approach was demonstrated by using nonlinear PA flow cytometry platform for label-free detection of circulating melanoma cells in blood background in vitro and in vivo. Nonlinearly amplified PA signals from overheated melanin nanoclusters in melanoma cells became detectable above still linear blood background. Nonlinear nanobubble-based photoacoustics provide new opportunities to significantly (5–20-fold) increase PA contrast of single nanoparticles, cells, viruses and bacteria in complex biological environments.
Keywords: Photoacoustic imaging, Flow cytometry, Nonlinear phenomena, Nanobubbles, Circulating tumor cells, Melanoma
1. Introduction
Photoacoustic (PA) spectroscopy, cytometry, and imaging demonstrated tremendous potential for high sensitivity detection, visualization, and identification of nanoparticles (NPs), cells, vessels and other absorbing targets in vitro and in vivo [1–9]. In particular, PA flow cytometry (PAFC) demonstrated detection of single circulating tumor cells (CTCs), cancer stem cells, pathogens, clots, normal and abnormal (e.g., sickle) blood cells as well as pharmacokinetics of NPs, capsulated dyes, and drug carriers in blood, lymph, bone, cerebral, and plant vasculatures [9]. In many applications, especially in biomedicine, PA detection limit can be restricted by background from absorption medium such as cellular cytoplasm, biotissue or blood. Many approaches were proposed to reduce the influence of absorption background due to the presence of multiple absorbing components in medium, including: (1) generation of second harmonic of PA signals from absorbing molecules with saturated absorption in the presence of linear background [2,10]; (2) increased PA contrast from targets with multiphoton absorption compared to background with linear absorption [11]; (3) two beam excitation with different wavelength and modulation frequency and detecting PA signals at frequency difference [2,12]; (4) discrimination of targets with different temperature-dependent absorption by sample heating or cooling down to liquid nitrogen temperature [2,12]; (5) discrimination of targets with different relaxation time [13]; (6) blood oxygenation and deoxygenation [14]; (7) magnet-induced PA signals preferentially from magnetic NPs only [15]; (8) laser-induced generation of nanobubbles as significant PA signal amplifier around strongly absorbing, spatially localized targets in relatively homogenous absorption background with no nanobubble formation [8]. The last approach was demonstrated to improve detection limit or enhance PA imaging contrast for quantum dots [16], melanoma cells in blood [2,14], golden carbon nanotubes in lymph [17,18], bacteria with intrinsic pigment (carotenoids) and silica-magnetic NPs in blood [19], and carbon nanotubes in plants [20]. Simultaneously with PA contrast enhancement, laser-induced nanobubbles led to spectral and spatial sharpening of PA and photothermal (PT) phenomena that allowed to break spectral (up to 1 nm) and diffraction (up to 50 nm) limits [8,21]. Nanobubble generation thresholds demonstrated high sensitivity to NP clustering (e.g., larger nanocluster size – lower threshold level) that was used in PT-based nanodiagnosis and nanotherapy [22]. PA spectroscopy and imaging was also explored using other nonlinear phenomena such as the dependence of PA signal amplitude on temperature-dependent target or medium parameters [23–26], photochemical reaction [27], multiphoton absorption [28], and absorption saturation [29]. Nevertheless, the detailed analysis of nonlinear detection of single NPs and cells in absorption background is lacking.
Here we fill this gap by exploring potential of nonlinear PAFC for detecting single CTCs in blood. Clinical significance of CTCs is associated with metastasis as leading cause of cancer deaths (50 reviews were published in 2012 alone and 300 clinical trials are in progress) [30–35]. Metastasis is the results of CTCs spreading from primary tumor to distant organs through blood network. Clinical studies have demonstrated the tremendous potential for using CTC count as a marker of metastatic development, cancer recurrence, and therapeutic efficacy [31]. Despite significant progress in development of CTC assays, the existing assays ex vivo still have many limitations including time-consuming blood processing and low sensitivity due to small blood samples [30–35]. As a result, at the time of initial detection, incurable metastasis might already have developed. To overcome these problems, in vivo PAFC was developed with the capability for detecting single CTCs in whole blood volume circulating in the peripheral blood vessels [9,14,17]. In particular, label-free detection of melanoma CTCs was demonstrated using melanin NPs as intrinsic melanoma marker [14]. Although cutaneous melanoma is the third most common type of skin cancer and accounts for only 3% of all cases, it accounts for 65% of all deaths from skin cancer [33]. The most alarming aspect of melanoma is its potential to metastasize at a very early stage of the disease. A pre-clinical study with PAFC revealed the feasibility of label-free melanoma CTC detection in vivo at extremely low concentration of 1 CTC/mL [9,14]. Most melanoma cells contain a large amount of melanin, a natural pigment with strong optical absorption in a wide spectrum in visible and near-infrared (NIR) range [14]. This makes PA techniques, an almost ideal method for label-free detection of strongly pigmented melanoma CTCs [14,32], especially in vivo. However, conventional linear mode PAFC can miss low pigmented CTCs which produce PA signals below blood background [36]. We demonstrate here that next generation of PAFC can solve this problem by nonlinear amplification of PA signals from laser-induced nanobubbles even in rare melanin NP clusters in low pigmented cells.
2. Materials and methods
2.1. Principle of nonlinear PAFC
When a CTC with intrinsic absorbing markers such as melanin or exogenous labels is illuminated by laser pulses, the absorbed energy is converted to heat which in turn induces thermal expansion of the heated zones leading to generation of PA waves referred as PA signals (Fig. 1a). Amplitude of a PA signal in linear mode is proportional to laser energy and absorption coefficient of the target. In positive-contrast PAFC, signal-to-background ratio (SBR) is determined by the ratio of PA signal amplitude from single CTC to background signal amplitude which is superposition of signals from individual red blood cells (RBCs) in the detected volume and noise of different origins (e.g., electronic, acoustic, fluctuating RBC number, or instability of laser energy [typically 3–5%]). According to multiple verifications using in vivo mouse model and ex vivo human blood spiked with melanoma cells, PAFC in near-infrared (NIR) spectral range (e.g., at 820 nm or 1064 nm) can detect single pigmented melanoma CTC in the presence of ∼100–300 RBCs that is also in line with coefficients of absorption for blood and melanin (see details in Ref. [14]). However, linear PAFC can miss low pigmented cells in blood background [36]. This problem can be partly overcome in nonlinear PAFC based on the differences in PA signal dependences on laser energy from targets and background. According to previous findings [8,9,16–21,26,29,37] and phenomenological model [8], absorbing targets (e.g., NPs, dyes, and chromophores) exhibit multistage behaviors when the energy fluence (E) is increased (Fig. 1c, black curve): (1) A gradual linear increase at a low fluence, En (n = 1); (2) absorption saturation (n ∼ 0.5–0.9); (3) slight nonlinear signal increase (n ∼ 1.2–1.6) related with temperature-dependent thermophysical parameters; (4) strong nonlinear signal amplification (n ∼ 2–5) related with nanobubble formation and its spatial and temporal overlapping; (5) secondary signal saturation (n ∼ 0–0.5) and even decrease related with nanobubble size saturation or target degradation, respectively; and (6) second strong signal amplification due to laser-induced explosion. Depending on the target's origin, only some of the aforementioned mechanisms may occur or are dominant, or the boundary between them may overlap. In view of the described phenomena, PA techniques can distinguish a target with strong nonlinearly amplified PA signals at certain laser energy which produce either linear or saturated PA signals from backgrounds (Fig. 1c). Specifically, the ability of nonlinear PAFC to detect low pigmented melanoma cells is based on high local absorption in melanin nanoclusters which at certain laser energy is sufficient to generate nanobubbles compared to lower local absorption of hemoglobin (Hb) in RBCs which generates linear PA signal only. Despite the average absorption of whole RBC with homogenously distributed Hb is relatively higher than of melanoma cell, local absorption of heterogeneously distributed melanin NPs and especially melanin nanoclusters in melanoma cell is higher (Fig. 1b), which leads to nanobubble formation, and hence PA signal amplification only in melanoma cells. As a result, at low laser energy the PA signal from a single low pigmented melanoma cell can be below blood background, while at higher energy nonlinearly amplified PA signals from overheated melanin nanoclusters become detectable above blood background (Fig. 1d). It should be noted that nanobubble-induced PA signal amplification is achieved when the laser energy fluence exceeds the nonlinear threshold by only 20–30%, while the cell photodamage threshold is at least 3–5 times higher. Nevertheless, at certain high energy, cells or NPs can be destroyed by strong PT and bubble related phenomena, that reduces the sample's absorption and hence PA signals. This photobleaching of PT origin (PT bleaching) is associated with overheating of absorbing zones and NPs that can lead to their melting, shape modification, destruction and explosion [9,14,16,18,31,38]. PT bleaching depends on both laser energy and number of laser pulses [16,17]. As a result, increasing the number of averaged PA signals (which is equal to number of laser pulses) from the same target may lead to increase SBRs when there is no PT bleaching effect, or can lead to decreased SBRs by PT bleaching due to PA signal degradation and increased average noise level (Fig. 1e).
Fig. 1.
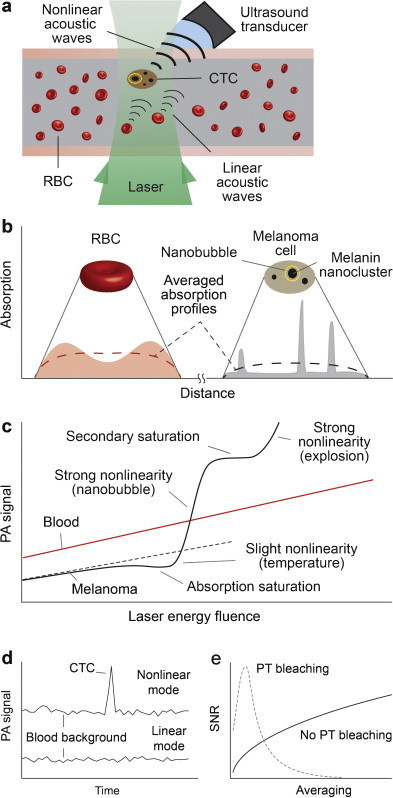
Principle of nonlinear PAFC. (a) Schematics. (b) Absorption profiles of an RBC and a melanoma cell. (c) Linear and nonlinear PA signal dependence on energy fluence from RBCs and melanoma cells. (d) PA signal traces in linear and nonlinear modes. (e) Dependence of signal-to-noise ratio (SNR) on averaging in the presence of photothermal bleaching.
2.2. Schematics of integrated PAFC
The PAFC used for in vitro experiments (Supplementary Fig. S1) was built on an inverted microscope platform (IX81, Olympus America, Inc., Central Valley, PA). The ultrasound transducer (V316-SM, 20 MHz, 12 mm focal distance, 150 μm focal area, Olympus) was attached to sample through ultrasound gel or water for acoustic coupling. A color CCD camera (DP72, Olympus) and a 625 nm LED were used for imaging and navigation of laser beam. The setup was equipped with a laser with the following parameters: wavelength, 1064 nm; pulse width, 10 ns; pulse energy, 350 μJ; and pulse repetitions rate (PRR), up to 750 kHz (MOPA-M-10, Multiwave Photonics, Porto, Portugal). PRRs of 2 kHz and 10 kHz were selected for most in vitro and in vivo studies. An electro-mechanical beam shutter (SH1, Thorlabs) was used to control laser dose delivery on sample. For static samples, the shutter was opened for 100 ms for each measurement, which delivered 200 pulses at 2 kHz PRR. Shutter was kept open for flow experiments. The beam diameter on the sample plane was 25 μm. Energy was set to the maximum at the controller and then adjusted using a set of natural density filters. Energy meter (PE10-SH, OPHIR, Israel) was used to measure laser pulse energy. Laser energy fluence was calculated as the fluence at the focal area in air, thus it did not account for the energy loss along the laser path (i.e., skin).
The PA setup was integrated with a transmission digital microscope (TDM), and PT microscope whose basic schematics (Supplementary Figs. S2 and S3) were described elsewhere [8,21,39]. Most PT measurements were performed with a tunable optical parametric oscillator (OPO: 420–2300 nm, 8 ns, 0.1–1 mJ, and 100 Hz). In PT thermal lens single channel mode, an OPO (called pump laser)-induced temperature-dependent variation of the refractive index around heated zones causes defocusing of a co-linear continuous wave laser probe beam (633 nm, ∼1 mW) that reduces the beam's center intensity detected by a photodiode through a pinhole as the integrated PT signal. The linear PT signal is manifested by a rapidly occurring peak associated with fast (ps–ns scale) cell heating and a slower (μs scale) tail corresponding to cell cooling. In nonlinear mode, overheating of localized zones is accompanied by short-lasting (10–500 ns) nanobubbles revealed by sharp negative PT peaks due to strong refraction and scattering effects. In PT imaging (PTI) mode pump-induced variations of the refractive index are visualized with a multiplex thermal lens scheme using a second, co-linear laser probe pulse from a Raman shifter (639 nm, 12 ns, 2 nJ, 10 Hz) or second high PRR laser (671 nm, 20 ns, 30 μJ, up to 30 kHz; CrystaLaser) with tunable 0 to 10 μs delay between pump and probe pulses [14]. Formation of a PT image requires just one laser pulse having a relatively broad beam diameter (10–25 μm) covering the entire cell. The PT image-acquisition procedure takes ∼0.1 s and 0.1 ms at 10 Hz or 20 kHz pump PRR using high speed CMOS camera (up to 40,000 frames per second; model, MV-D1024-160-CL8, Photonfocus).
For in vivo experiments, another PAFC setup based on Olympus BX51 platform, and described in [40] was used. The customized cylindrical lens provided linear laser beam (10 μm × 100 μm) to irradiate vessel cross section. An unfocused transducer (XMS-310, 10 MHz, 2 mm diameter, Olympus) was attached to mouse ear for PAFC monitoring.
2.3. Flow module
Flow module was built using a 5 mL syringe pump (model 780210; KD Scientific Inc.). A quartz capillary with 100 μm × 100 μm square cross-section was placed on the bottom of a glass cuvette filled with water. The syringe and quartz capillary were connected by ∼20 cm long silicon tube. Sample was withdrawn through the other end of the capillary which was sunk in a small container. Cell container was shaken prior to each measurement. Volumetric flow rate set on the pump was converted to flow velocity in the capillary using the known dimensions, and verified by measuring the time it takes for the sample to travel a known distance in the capillary. The ultrasound transducer was immersed in water.
2.4. PA data acquisition and analysis
PA signals from transducer were amplified (preamplifier model 5678; bandwidth, 200 kHz–40 MHz; gain 40 dB; Panametrics NDT) and digitized (PCI-5152, 12-bit, 200 MSPS, National Instruments Inc.). Custom developed software recorded PA signal amplitudes in three separate traces, in real-time, along with a fourth trace which consisted of readings from a photodiode. First trace consisted of the peak-to-peak amplitudes of each acquired PA wave in a predefined time gate. A buffer accumulated and averaged 10 consecutive PA waves. The amplitudes of the resulting averaged PA waves formed the second trace. In a similar fashion, the third trace was the result of averaging 100 PA waves. Photodiode trace was used to precisely locate where the beam shutter was opened in PA traces, and to control the laser energy. In the in vivo setting, a single trace of averaging 10 was recorded using a high speed digitizer (AD484, 14-bit, 125 MSPS, 4DSP, Inc.). Peak detection and other statistical analysis were done offline.
2.5. Cell culturing and sample preparation
B16F10 melanoma cells (ATCC, CRL 6475) were grown as a monolayer in Dulbecco's Modified Eagle Medium (Invitrogen, Carlsbad, CA) with 10% fetal bovine serum (Invitrogen) on T75 flasks (Fisher Scientific, Pittsburgh, PA) until the culture was 85% confluent. Media were replaced every 3–4 days. Incubator atmosphere was at 37 °C, 5% CO2 and 90% humidity. Cells were rinsed with phosphate buffered saline (PBS), and harvested from tissue culturing wells adding Versene (Invitrogen) and incubating until cells were detached. Cells were resuspended in media, centrifuged (10 min, 300 × g), and washed three times with PBS. After washing, cells were resuspended to a concentration of 1–5 × 10⁶ cells/mL (depending on experiment). Cell viability, in excess of 96%, was ensured using Trypan Blue staining. Blood samples were withdrawn from donor mice right before the experiment. Ten parts whole blood was mixed with 1 part 0.11 M sodium citrate to prevent coagulation, and then spiked with melanoma cells. All samples were diluted to achieve less than one melanoma cell per irradiation volume. Static measurements were done using 120 μm thick glass slides.
2.6. Animal model
Animals in this study were used in accordance with protocols approved by the UAMS Institutional Animal Care and Use Committee. Nude nu/nu mice weighing 20–25 g, was purchased from Harlan Sprague-Dawley (Indianapolis, IN). The animals were anesthetized by isoflurane and placed on a heated stage. The ultrasound transducer was placed on the ear. Warm water or ultrasound gel was used as acoustic contact medium.
3. Results
3.1. Evaluation of pigmentation of melanoma cells
The amount of melanin in melanoma cells widely varies (Fig. 2a–c) depending on several factors (cell line, growing methods, culturing time, etc.). Before proceeding with further study of nonlinear photoacoustics, the melanin-related pigmentation was evaluated at single cell level. We applied PT/PA methods to measure PT/PA signal amplitudes at the same energy as indicator of melanin content. Specifically, the PT thermal lens signal amplitude and PT image structure in individual live cells were used as indicators of average melanin content (through average cell absorption) and melanin cellular spatial distribution, respectively.
Fig. 2.
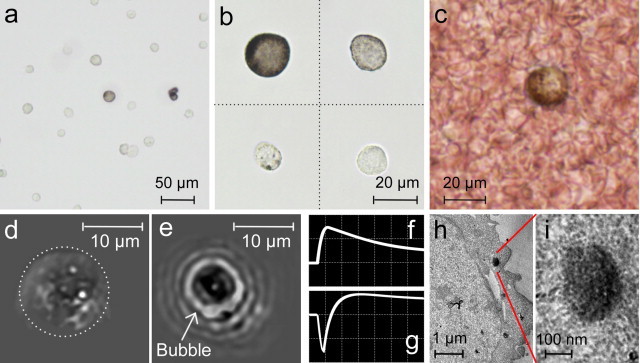
B16F10 mouse melanoma cells at various resolutions. (a and b) Cells with various melanin content suspended in PBS. (c) Blood spiked with melanoma cells. PT images and signals from single melanoma cells with low (d and f) and high (e and g) melanin content. (h) TEM image of a melanoma cell. (i) Closer view of a small melanosome. Amplitude, time scale, laser wavelength, and fluence: (f) 20 mV/div, 4 μs/div, 580 nm, and 80 mJ/cm2; (g) 50 mV/div, 4 μs/div, 580 nm, and 0.2 J/cm2.
Conventional TDM provided a melanin distribution in highly pigmented cells only. Low absorption sensitivity of TDM and its diffraction-limited optical resolution did not permit visualization of single melanin NPs (Fig. 2b), which was possible with transmission electron microscopy (TEM) (Fig. 2h and i). PTI with its high absorption sensitivity also provided visualization of single melanin NPs in linear (Fig. 2d) and nonlinear (Fig. 2e) modes. This capability of far-field PTI was based on analysis of laser-induced thermal fields (or bubbles) around melanin NPs during their expansion above the diffraction limit. The temporal dynamics of local structures in linear PT images associated with fast heating and cooling of individual melanin NPs provided information about their average sizes, as previously described [21]. In nonlinear mode, bubble-formation and their expansion led to enhanced PT contrast from individual melanin NPs or especially its clusters (Fig. 2e) and appears as negative PT peaks (Fig. 2g) in contrast to positive PT peak in linear mode (Fig. 2f). The PT studies as well as TEM images revealed that in most melanoma cells, 30–50 nm melanin NPs were assembled into clusters in relatively small melanosomes with an average diameter in the range of 200–600 nm.
Monitoring of the PT thermal lens signal amplitudes from individual cells in suspension showed their high heterogeneity as 5–10% of cells with high pigmentation produced PT signals with amplitude several times greater than that of PT signals from cells with low pigmentation that in line with our previous measurement [14]. At 580 nm and 0.1 J/cm2 energy fluence, 94 ± 4.0% of the melanoma cells were detectable with PT technique.
Finally, we also measured PA signals as indication of melanin content. This was accomplished by irradiating individual cells (at least total of 100) in a selected area in suspension, one by one, at fixed laser energy (1064 nm, 0.4 J/cm2). It was obtained that 20, 42, and 62% (in this study, cell pollution with dominantly low pigmented cells was used) of the cells produced detectable PA signals over background noise (3σ criterion) at 0, 10, and 100 signal averaging, respectively. Based on the PA signal amplitude levels as indicator of cell pigmentation, all cells were then split into four groups with rough definition of high, medium, low, and very low pigmentation with corresponding content of 7, 13, 42, and 38% of the population. Very low pigmented cells were either below the PA detection threshold or they did not contain melanin.
TDM was also used for preliminary quantification of melanin in melanoma cells (Supplementary text and Fig. S4). Typical absorbance distribution was obtained, where 7, 25, 45, and 22% of the cells were in high, medium, low, and very-low pigmented groups.
3.2. PA signals as function of laser energy fluence under static conditions
After the examination of pigmentation in the melanoma cell population, dependence of the PA signals on the laser energy fluence was explored for cells in PBS and blood. Starting from the lowest, the following laser energy fluences were applied to a single cell for PA measurements: 0, 3, 5, 8, 11, 16, 23, 30, 50, 66, 81, 93, 179, 224, 294, 362, 415, 805 mJ/cm2. At each level, ∼200 laser pulses irradiated the sample. The procedure was repeated on many other randomly selected cells. A high level of heterogeneity in the PA signal amplitudes (i.e., pigmentation levels) was observed. The cells were then classified into four pigmentation groups (high, medium, low, and very low) depending on the PA signal levels they produced at 415 mJ/cm2: highest step before PT-bleaching occurs.
Typical time-resolved PA waveforms from blood background and a single, medium-pigmented melanoma cell were compared at two selected fluence of 224 and 415 mJ/cm2 (Fig. 3). 1.85-fold increase in laser energy fluence caused 3.65- and 1.91-fold increase in PA signal amplitudes from melanoma cell and blood, respectively. At the given fluence range, SBR was improved ∼2-fold.
Fig. 3.
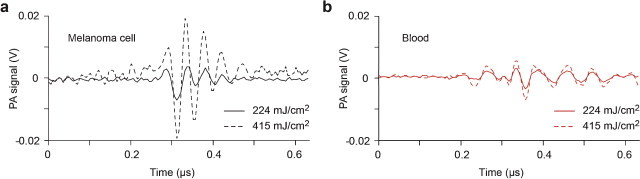
Typical PA waveforms obtained from (a) a single melanoma cell and (b) blood at 224 and 415 mJ/cm2 laser energy fluences.
For the cells in PBS, PA signal amplitudes were consistent from pulse to pulse at fluence of 415 mJ/cm2 and below (Fig. 4a). However, at higher fluence of 805 mJ/cm2, PA signals quickly diminished (Fig. 4b) due to PT-based bleaching. This effect was more profound for high-pigmented cells. In particular, PA signals from high-pigmented cells became even lower than the less pigmented cells after 20 laser pulses.
Fig. 4.
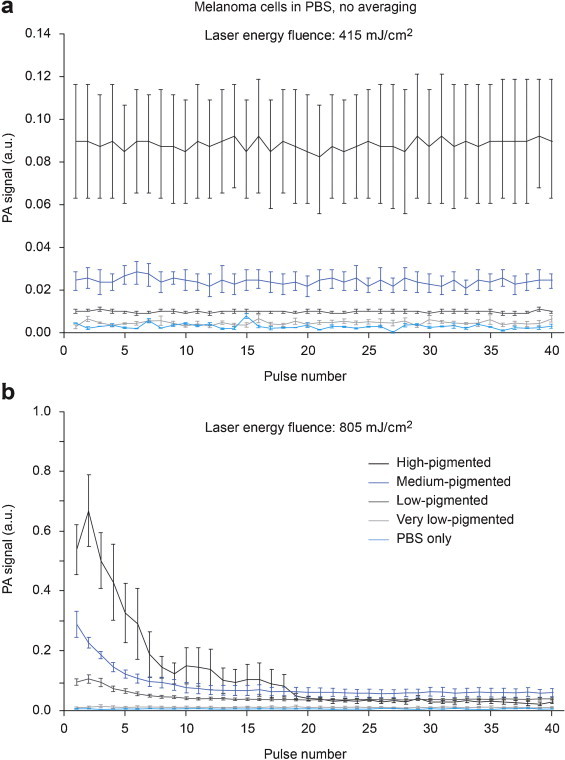
PA signal amplitudes from single melanoma cells as function of laser pulse number, at laser energy fluence of 415 mJ/cm2 (a) and 805 mJ/cm2 (b). Bars are mean ± SEM.
Within the relatively high energy range (0–800 mJ/cm2) used, PA signals of very low-pigmented cells and blood exhibited linear dependence, while most pigmented cells revealed nonlinear behavior (Fig. 5). Due to the role of laser-induced nanobubbles as nonlinear PT-PA signal amplifiers, we observed significant (5–20-fold) PA signal amplification from melanoma cells with heterogeneous melanin distribution (Fig. 5c and Supplementary Fig. 5a). Blood, on the other hand, exhibited linear signals because of the relatively homogeneous spatial distribution of Hb in RBCs, which prevented overheating and bubble formation.
Fig. 5.
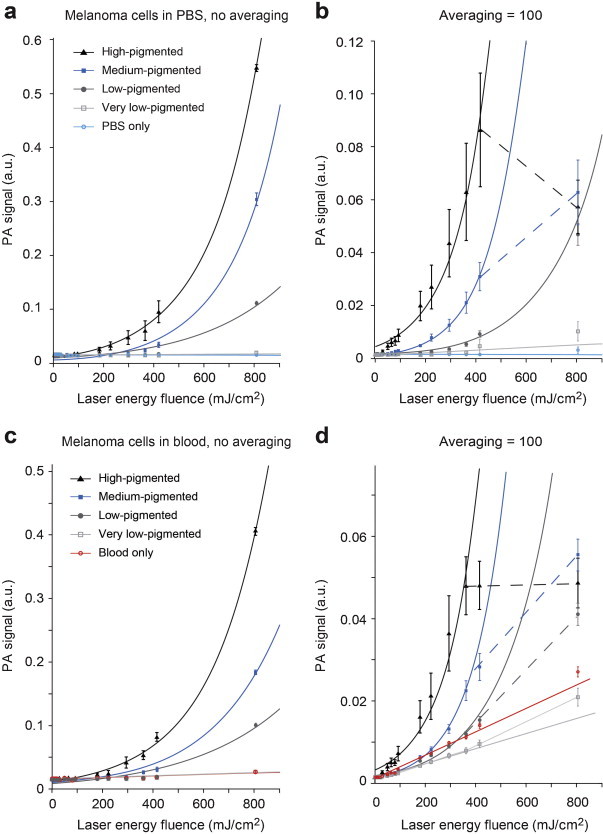
PA signal amplitudes from melanoma cells as function of laser energy fluence. PA signals from cells in PBS (a and b) and in blood (c and d) were acquired using single laser pulses (a and c), and by averaging 100 consecutive signals (b and d). Bars are mean ± SEM. Lines represent the linear or nonlinear (first order exponential for the top three [high, medium, low] pigmentation groups and first order polynomial model for the rest of the subjects [very-low pigmented cells, PBS, and blood]) regression fit of the data. Dashed lines indicate the points that were excluded from regression.
Detection thresholds of laser energy fluence, where the PA signals from cells exceed mean + 3σ of the PA signals from background (PBS or blood), are listed in Table 1. The data in this table reflect the presence of at least one cell producing signal above a given threshold (i.e., it is not directly comparable to Fig. 5). All cells that produce signals above threshold were then counted, and plotted in Fig. 6 as percentage of cell population that is detectable as function of laser fluence. When the signals of first laser pulses at each energy level were considered (i.e., no averaging), the detection thresholds were higher than the thresholds observed from averaged signals (Table 1). Averaging consecutive A-line signals reduced the random noise and background level from PBS, hence increased the SBR. When the background medium was blood, however, signals from blood was not diminished. As a result, for a given fluence, increase in SBR for cells in PBS was larger than those in blood. Background curves from PBS and blood are similar in Fig. 5a and c, but after averaging, the gap between curves of cells and background is smaller for blood (Fig. 5b and d). This effect is also visible in Fig. 6, as the improvement in detection by averaging only is better for cells in PBS than the cells in blood. For instance, when the medium-pigmented cells are considered, detection threshold in blood drops from 294 (N = 1) to 224 mJ/cm2 (N = 100). In comparison, detection threshold in PBS drops from 294 to 50 mJ/cm2, indicating ∼3-fold difference in improvement by averaging. On the other hand, when PT bleaching occurs and PA signals are not constant anymore, excessive averaging does not help to improve the SBR. This effect was observed in Fig. 5b and d, as distorted signals at highest fluences. These points were excluded from regression and indicated by dashed lines.
Table 1.
Detection thresholds for melanoma cells in PBS and blood.
| Cell pigmentation | Average % in population | Melanoma detection threshold (mJ/cm2) |
|||||
|---|---|---|---|---|---|---|---|
| Single pulse |
Averaging = 10 |
Averaging = 100 |
|||||
| In PBS | In blood | In PBS | In blood | In PBS | In blood | ||
| High | 11.7 | 81 | 179 | 50 | 50 | 30 | 30 |
| Medium | 12.7 | 294 | 294 | 179 | 294 | 50 | 224 |
| Low | 55.0 | 415 | 415 | 294 | 415 | 179 | 362 |
| Very low | 20.6 | 805 | – | 415 | – | 294 | – |
Fig. 6.
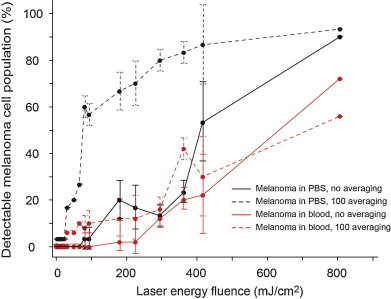
Percentage of melanoma cell population that is detectable as function of laser fluence, under static conditions. The threshold for detection was set to mean + 3σ of the PA signals from background (PBS or blood). Bars are mean ± σ.
Increased laser energy fluence produced nonlinear signal amplification for all pigmented melanoma cells (Fig. 5a–d). While the background from PBS did not change significantly, background from blood increased linearly as function of laser fluence. Averaging and/or higher fluences allowed the detection of even some of the cells in PBS that were categorized as very low-pigmented, but the signals from cells of this category were always below the blood background.
The data about evaluation of noise in the PAFC system is presented in Supplementary Fig. 6. Relative standard deviation of PA trace (standard deviation for a selected signal trace divided by its mean) depends on PA signal amplitude. The data for both blood and melanoma cells showed that trace fluctuations were 4% for high amplitude PA signals, when electronic noise can be neglected. Laser fluctuation was measured using a fast photodiode and estimated to be ∼2%. Additional noise sources may be related to transducer accuracy, mechanical noise, and quantization noise. The noise in PA signals was mostly related to fluctuations in laser energy and to signal acquisition system. At higher laser fluences, melanoma trace was influenced by PT bleaching and relative standard deviation increased (Supplementary Fig. 6a).
3.3. PA signals as function of laser energy fluence in flow
Although in vitro study is important as first step verification of PAFC in well controllable static condition, only flow study of both in vitro and in vivo could reveal real practical potential of new technology by taking into account flow dynamics, light scattering in surrounding tissue, or clearance of cells from circulation. In addition to measuring PA signal amplitudes, estimation of PA signal rate (number PA signals in certain time) is especially important for many biomedical applications, in particular associated with cancer or infections.
The study was first performed in artificial flow using 100 μm × 100 μm sized quartz tube to mimic small blood vessels. The flow velocity was set to 5 mm/s. When PBS was run through the tube as control, no PA signals were detected at various laser energy fluences applied. Then melanoma cells in PBS were diluted to achieve concentration of 1 cell per irradiation volume, in order to minimize the possibility of multiple cells passing the laser beam at the same time. PAFC was performed at the same set of laser energy fluences used in the study of static cells, for 5 min each. Snippets of the PAFC traces are shown in Fig. 7a. Peak rates (number of detected cells per minute) were averaged over the 5 min duration and normalized to the rate where highest fluence applied (Fig. 7d). After cleaning the tubes using alcohol, the same procedure repeated using blood (as control) and blood spiked with melanoma cells at the same concentration of 1 cell per irradiation volume (Fig. 7b and d). Although the peak rates differed for cells in PBS and blood at the same energy fluence, normalized rates revealed a similar nonlinear trend (Fig. 7d) as in the static conditions.
Fig. 7.
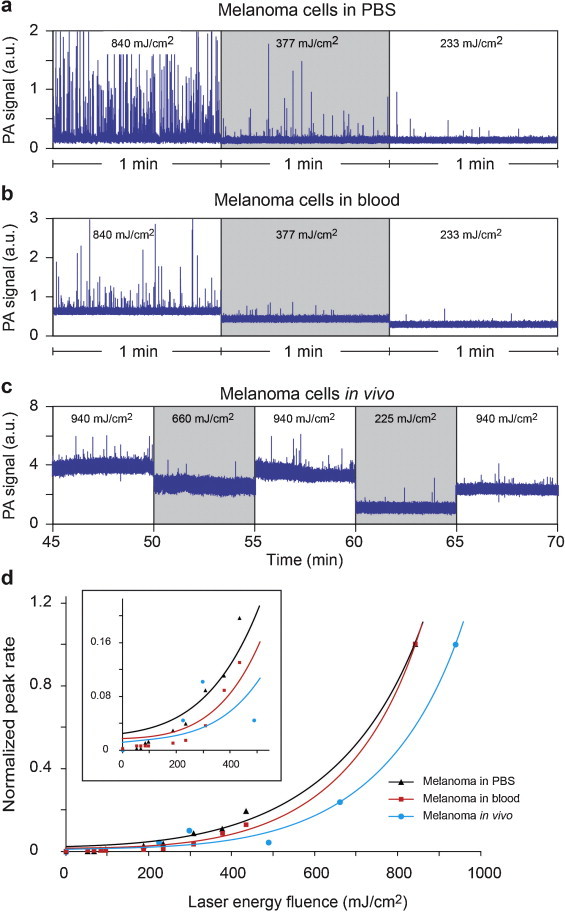
PA signal traces and rates of melanoma cells in flow at various laser energy fluences. (a) Cells in PBS and (b) mouse blood spiked with cells in artificial flow. (c) PA monitoring of a 50-μm vessel in mouse ear after injection of melanoma cells. (d) Peak rate in flow as function of laser energy fluence. Rates were normalized to the rate at the highest fluence applied. Averaging was 10.
The beam diameter on the sample plane was 25 μm, same as the size in static measurements. This approach provided consistency across experiments in terms of laser parameters; however, it prevented us to accurately control or estimate the total number of cells that pass through the laser beam, as the laser beam did not cover the whole tube diameter. Using the same flow protocol across multiple measurements with different fluences, the number of cells passing through the laser beam was assumed to be similar. Thus, the objective here was not to obtain the absolute percentage of detectable cells as it was done for static samples in Section 3.1 and in [14], but to demonstrate the nonlinear increase in the number of cells counted by PAFC when higher laser fluence was used.
Finally, an intact mouse was intracardially injected 0.5 million melanoma cells in 50 μL PBS. PA signals were monitored in a ∼60 μm capillary in ear. PAFC was started 30 min prior to injection as control, and no peaks were observed above blood background. Immediately after injection, PA peaks started to appear. Injected melanoma cells are naturally cleared from blood circulation (9.4–3.6 cells/min from t = 10 min to t = 120 min after injection). Due to biological factors, the number of cells in circulation varies in time, even if the same energy is used. To minimize the influence of clearance over the detection rate at various laser energy fluences, reference fluence (940 mJ/cm2) was repeatedly applied between each period of measurements as an indication of the maximum number of CTCs detectable in the target vessel, for a given period of time (Fig. 7c). Peak rates were averaged over 5 min periods and then normalized to the average of peak rates in reference regions before and after (Fig. 7d). It should be noted that only a portion of the listed energy fluences were delivered into the blood vessel, due to scattering and absorption in the surrounding tissues.
In all three experiments, nonlinear behavior was observed between peak rate and laser energy fluence (Fig. 7d). Significantly larger number of CTC-associated PA peaks was detected at higher energy fluences. Normalized peak rates were 0.03, 0.08, and 1.0 for energy fluences of 0.2, 0.4, and 0.8 J/cm2, respectively, for melanoma cells in blood, in vitro. The results were similar to those from static measurements, although the parameters measured were different (PA peak rate vs. PA amplitude). Normalized detection rate in blood was consistently lower than the detection rate in PBS, as expected, due to the background from blood. Variation in in vivo measurements was more than the variations in in vitro, possibly due to the physiological effects. It should be remarked that only single cells were selected for irradiation in static measurements. In flow, however, it is inevitable to have cell aggregates (i.e., possibly stronger signals), although they were kept to a minimum by dilution and preliminary shaking.
4. Discussion
We demonstrated nonlinear PAFC providing PA signal amplification from single melanoma cells through laser-induced nanobubbles as PA signal enhancers from melanin nanoclusters. Taking into account our previous discovery of the significant role of laser-induced nanobubbles around overheated local absorbing zones (e.g., NPs, dyes, and cellular chromophores) in nonlinear amplification of PT and PA effects [14,16–21], in current work we performed the detailed analysis of PA signals from melanoma cells with different pigmentation levels as a function of laser energy fluence. We observed significant (5–20-fold, depending on the pigmentation level) signal amplification from these cells compared to linear signals from RBCs with spatially homogenous Hb distribution.
PA signals and detection rates of melanoma cells were quantitatively analyzed with respect to laser energy fluence, in vitro and in vivo. It was demonstrated that both PA signal amplitudes and cell detection rates increased nonlinearly as the laser energy fluence increased. For instance, increase in PA signals from high pigmented melanoma cells was 15 times more than the increase in signals from blood cells only, when the energy increased from 0.2 J/cm2 to 0.4 J/cm2. The ratio of detectable melanoma cells in blood increased dramatically, from 3% to 72%, as the energy increased from 0.2 J/cm2 to 0.8 J/cm2. Although it depended mainly on the wide range of pigmentation among cells, it was possible to detect single (high pigmented) cells in blood at as low as 30 mJ/cm2. Nonlinear amplification was also observed during detection of moving cells in flow. Although in this condition peak rates (in contrast to PA signal amplitude in static measurements) were used as a measure of detection efficiency, 5–7-fold improvement in PA peak rate was achieved when the energy fluence was doubled.
Nonlinear amplification by the changes of the thermophysical parameters (e.g., thermal expansion coefficient) due to local temperature increase around gold NPs endocytosed in cells, resulted in 2–3-fold PA signal increase improvement between 10 and 15 mJ/cm2 at 532 nm [26]. Absorption saturation, on the other hand, caused ∼1.5-fold decrease in PA contrast for various dyes between 30 and 60 mJ/cm2 at 576 nm, but much less for oxygenated blood, and almost no change in deoxygenated blood for up to 280 mJ/cm2 [29]. Nanobubble-induced nonlinear amplification in our study provided the strongest enhancement of PA contrast (5–20-fold), for melanoma cells of various pigmentation levels. Thus, laser-induced nonlinear nanobubble formation provides maximal PA amplification effects.
Signal averaging may increase the SBR at low laser energy with no PT bleaching. However, SBR increase by extensive signal averaging can be less effective in the presence of PT-bleaching leading to decrease PA signal amplitude for subsequent pulses. In particular, PT bleaching of melanoma cells was observed over 0.4 J/cm2 energy fluence. This effect is disadvantageous for static samples when there is no time limit for cell irradiation; however, it is not as crucial in PAFC since the number of laser pulses to irradiate the cell is already limited by the flow velocity. Proper selection of laser and PAFC parameters are necessary for optimal signal enhancement and taking advantage of nonlinear effect. Specifically, only a limited number of PA signals, M, can be generated from a cell in flow during passing of the laser beam (i.e., detection volume). The parameter M can be defined as M = PRR × tL, where tL is the lifetime of the cell in the detection volume. The parameter M must be optimized for specific targets and measurement condition. For example, laser energy increase can lead both to significant nonlinear PA signal increase and simultaneously PA signal decease for subsequent laser pulses. Hypothetically, even single high energy laser pulse can dramatically increase PA signal amplitude (up to 100-fold) [8] that is enough for single NP or cell detection without need for a second laser pulse. These nonlinear effects in combination with high spatial resolution of PAFC minimizing number of RBCs in detected volume made it possible to detect single NPs and CTCs in blood circulation [9]. High laser energy can immediately destroy irradiated cell, and make PAFC minimally invasive. This may limit detection of circulating healthy cells; but on the other hand it provides excellent PA-PT theranostic platform integrating high sensitive detection of abnormal cells (e.g., CTC, bacteria or viruses) with simultaneous killing of them using limited number of laser pulses, potentially just one [9]. If an absorption background demonstrates stronger nonlinear PA/PT effects than in target at specific laser energy, it can be used for selective spectral burning of background to increase sensitivity for detection of target with linear effects (e.g., tumor cells in stained histological samples [41]).
One of the key applications of PAFC is detection of rare CTCs which are present in circulation in very low concentration, at level of 0.1–1 CTC/mL. This rarity makes the detection problematic for in vitro tests, where only a limited volume (few mL) of blood can be tested. In early stages of metastatic disease, there may not even be any CTCs in the blood sample withdrawn. In vivo PAFC overcomes this sensitivity issue by allowing the testing of potentially whole blood volume of a patient. On the other hand, label-free PAFC detection of melanoma CTCs primarily relies on the melanin expression in these cells, which varies in a wide range. We believe that nonlinear PAFC using nanobubble-based amplification of PA signals from low pigmented CTCs can significantly enhance label-free detection of low pigmented CTCs, or CTCs labeled with a limited number of NPs [17] whose linear signals are below absorption background from RBCs. This achievement further improves the sensitivity of PAFC beyond 1 CTC/mL.
Besides label-free detection of melanoma CTCs, nonlinear amplification can easily be extended to the detection of similar markers and biological targets. Laser-induced nanobubbles around other cellular chromophores, NPs, dyes, and drugs (either in bloodstream, in drug carriers, or absorbed by circulating cells) may allow their PA detection, even if their average absorption is below the background of surrounding tissue. Integration of nonlinear PA signal amplification with simultaneous spectral sharpening of PA spectra [8] can be used to enhance spectral specificity of photoacoustics.
Conflict of interest
There are no conflicts of interest.
Acknowledgments
This work was supported in part by the National Institute of Health Grants R01EB000873, R01CA131164, R01EB009230, and R21CA139373, and the National Science Foundation Grant DBI-0852737. M.A.J was supported in part by the Deutsche Forschungsgemeinschaft (German Research Foundation Grant-DFG, JU 2814/1-1). We thank Alex Biris and Thikra Mustafa for providing TEM images, and Stephen Foster for cell preparation.
Biographies

Mustafa Sarimollaoglu, Ph.D., is a Research Associate at the Phillips Classic Laser & Nanomedicine Laboratories, University of Arkansas for Medical Sciences. He received his B.S. and M.S degrees in Electronics and Communication Engineering from Istanbul Technical University, Turkey, and Ph.D. degree in Applied Computing at the University of Arkansas at Little Rock, the USA. His research experience includes the development of high-speed photoacoustic flow cytometry systems, image and signal processing in biomedicine.

Dmitry Nedosekin, Ph.D., is a Research Associate at the Phillips Classic Laser & Nanomedicine Laboratories, University of Arkansas for Medical Sciences. He completed doctoral training at the Philipps-Universität Marburg, Germany (2004–2005) and at the M.V. Lomonosov Moscow State University, Russia (2003–2007) and received a Ph.D. degree on Analytical Chemistry. His scientific interests cover a wide range of biophotonic methods including fluorescence, photothermal, photoacoustic, and Raman spectroscopy techniques and their integration for biomedical imaging and flow analysis.

Yulian A. Menyaev, Ph.D., is a Research Associate at the Philips Classic Laser & Nanomedicine Laboratories, University of Arkansas for Medical Sciences. He received his Ph.D. in Biomedical Techniques Science at Bauman Moscow State Technical University. His scientific interests cover a range of methods in the field of medical technique: photoacoustic flow cytometry, medical lasers, ultrasound imaging, ophthalmic systems, XR-systems, and whole body tomography (CT, MR, SPECT, PET).

Mazen A. Juratli is a Research Assistant in the Phillips Classic Laser and Nanomedicine Laboratories at the University of Arkansas for Medical Sciences, USA. He received his M.D. from Philipps University of Marburg in Germany and has worked in the General Surgery Department and in the ENT/Head and Neck Surgery Department. He has conducted in vivo studies using photoacoustic and fluorescence flow cytometry detection of circulating tumor cells and circulating blood clots in mouse, rat and rabbits model. He has experience in animal handling procedures including injections, blood sampling, and aseptic technique with regard to mouse and rat surgery, and the use of anesthesia.

Vladimir P. Zharov is the director of the Arkansas Nanomedicine Center and a Professor of Biomedical Engineering (BME) at the University of Arkansas for Medical Sciences, the USA. He received his Ph.D. and D.Sc. degrees from Bauman Moscow State Technical University (BMSTU), completed a postdoctoral fellowship at Lawrence Berkeley National Laboratory and served as the Chairman of the BME department at BMSTU. He is the author of 5 books, 52 patents, and more than 200 papers in the field of laser spectroscopy, biophotonics, and nanomedicine. He is one of the pioneers of photoacoustic spectroscopy and the inventor of photoacoustic tweezers, pulse nanophotothermolysis of infections and cancer, and in vivo multicolor flow cytometry. Dr. Zharov is the State Prize Winner in Russia and the first recipient of the U.S. Maiman Award named after the inventor of the first laser.
Footnotes
This is an open-access article distributed under the terms of the Creative Commons Attribution-NonCommercial-No Derivative Works License, which permits non-commercial use, distribution, and reproduction in any medium, provided the original author and source are credited.
Appendix A. Supplementary data
The following are the supplementary data to this article:
References
- 1.Patel C.K.N., Tam A.C. Pulsed optoacoustic spectroscopy of condensed matter. Rev Mod Phys. 1981;53:517–550. [Google Scholar]
- 2.Zharov V.P., Letokhov V.S. Springer-Verlag; New York: 1986. Laser optoacoustic spectroscopy. [Google Scholar]
- 3.Oraevsky A.A., Karabutov A.A. Optoacoustic tomography. In: Vo-Dinh T., editor. Handbook of biomedical photonics. CRC Press; Boca Raton: 2003. [Google Scholar]
- 4.Ntziachristos V. Going deeper than microscopy: the optical imaging frontier in biology. Nat Methods. 2010;7(8):603–614. doi: 10.1038/nmeth.1483. [DOI] [PubMed] [Google Scholar]
- 5.Ntziachristos V., Razansky D. Molecular imaging by means of multispectral optoacoustic tomography (MSOT) Chem Rev. 2010;110:2783–2794. doi: 10.1021/cr9002566. [DOI] [PubMed] [Google Scholar]
- 6.Wang L.V., Hu S. Photoacoustic tomography: in vivo imaging from organelles to organs. Science. 2012;335:1458–1462. doi: 10.1126/science.1216210. [DOI] [PMC free article] [PubMed] [Google Scholar]
- 7.Bayer C.L., Joshi P.P., Emelianov S.Y. Photoacoustic imaging: a potential tool to detect early indicators of metastasis. Expert Rev Med Dev. 2013;10:125–134. doi: 10.1586/erd.12.62. [DOI] [PMC free article] [PubMed] [Google Scholar]
- 8.Zharov V.P. Ultrasharp nonlinear photothermal and photoacoustic resonances and holes beyond the spectral limit. Nat Photonics. 2011;5:110–116. doi: 10.1038/nphoton.2010.280. [DOI] [PMC free article] [PubMed] [Google Scholar]
- 9.Galanzha E.I., Zharov V.P. Photoacoustic flow cytometry. Methods. 2012;57:280–296. doi: 10.1016/j.ymeth.2012.06.009. [DOI] [PMC free article] [PubMed] [Google Scholar]
- 10.Kreuzer L.B. Ultralow gas concentration infrared absorption spectroscopy. J Appl Phys. 1971;42:2934–2943. [Google Scholar]
- 11.Zharov V.P., Shtepa V.I., Vereshchagina I.N., Osmanov R.R., Putilin F.N. Optoacoustic detection of polyatomic biomolecules using the multiphoton absorption effect. J Photoacoustics. 1983;1:181–202. [Google Scholar]
- 12.Zharov V.P. Principles of selective optoacoustic detection of molecules in complex mixtures. J Anal Chem. 1984;39(5):780–790. [Google Scholar]
- 13.Zharov V.P., Shtepa V.I. Optoacoustic detection non-absorbing radiation molecules. Vestnik Moskovskogo Universiteta, Seria Himia. 1985;25:231. [Google Scholar]
- 14.Galanzha E.I., Shashkov E.V., Spring P.M., Suen J.Y., Zharov V.P. In vivo, noninvasive, label-free detection and eradication of circulating metastatic melanoma cells using two-color photoacoustic flow cytometry with a diode laser. Cancer Res. 2009;69:7926–7934. doi: 10.1158/0008-5472.CAN-08-4900. [DOI] [PMC free article] [PubMed] [Google Scholar]
- 15.Xia J., Pelivanov I., Wei C., Hu X., Gao X., O’Donnell M. Suppression of background signal in magnetomotive photoacoustic imaging of magnetic microspheres mimicking targeted cells. J Biomed Opt. 2012;17:061224. doi: 10.1117/1.JBO.17.6.061224. [DOI] [PMC free article] [PubMed] [Google Scholar]
- 16.Shashkov E.V., Everts M., Galanzha E.I., Zharov V.P. Quantum dots as multimodal photoacoustic and photothermal contrast agents. Nano Lett. 2008;8:3953–3958. doi: 10.1021/nl802442x. [DOI] [PMC free article] [PubMed] [Google Scholar]
- 17.Galanzha E.I., Shashkov E.V., Kelly T., Kim J.W., Yang L., Zharov V.P. In vivo magnetic enrichment and multiplex photoacoustic detection of circulating tumour cells. Nat Nanotechnol. 2009;12:855–860. doi: 10.1038/nnano.2009.333. [DOI] [PMC free article] [PubMed] [Google Scholar]
- 18.Kim J-W., Galanzha E.I., Shashkov E.V., Moon H.-M., Zharov V.P. Golden carbon nanotubes as multimodal photoacoustic and photothermal high-contrast molecular agents. Nat Nanotechnol. 2009;4:688–694. doi: 10.1038/nnano.2009.231. [DOI] [PMC free article] [PubMed] [Google Scholar]
- 19.Galanzha E.I., Shashkov E.V., Sarimollaoglu M., Beenken K.E., Basnakian A.G., Shirtliff M. In vivo magnetic enrichment, photoacoustic diagnosis and photothermal purging of infected blood using multifunctional gold and magnetic nanoparticles. PLoS ONE. 2012;7:e45557. doi: 10.1371/journal.pone.0045557. [DOI] [PMC free article] [PubMed] [Google Scholar]
- 20.Khodakovskaya M.V., de Silva K., Nedosekin D.A., Dervishi E., Biris A.S., Shashkov E.V. Complex genetic, photothermal, and photoacoustic analysis of nanoparticle-plant interactions. Proc Natl Acad Sci USA. 2011;108(3):1028–1033. doi: 10.1073/pnas.1008856108. [DOI] [PMC free article] [PubMed] [Google Scholar]
- 21.Nedosekin D.A., Galanzha E.I., Dervishi E., Biris A.S., Zharov V.P. Super-resolution nonlinear photothermal microscopy. Small. 2013 doi: 10.1002/smll.201300024. [DOI] [PubMed] [Google Scholar]
- 22.Zharov V.P., Kim J-W., Everts M., Curiel D.T. Self-assembling nanoclusters in living systems: application for integrated photothermal nanodiagnostics and therapy. J Nanomed. 2005;1:326–345. doi: 10.1016/j.nano.2005.10.006. [review] [DOI] [PubMed] [Google Scholar]
- 23.Calasso I., Craig W., Diebold G. Photoacoustic point source. Phys Rev Lett. 2001;86:3550–3553. doi: 10.1103/PhysRevLett.86.3550. [DOI] [PubMed] [Google Scholar]
- 24.Inkov V., Karabutov A., Pelivanov I. A theoretical model of the linear thermo-optical response of an absorbing particle immersed in a liquid. Laser Phys. 2001;11:1283–1291. [Google Scholar]
- 25.Larina I.V., Larin K.V., Esenaliev R.O. Real-time optoacoustic monitoring of temperature in tissues. J Phys D: Appl Phys. 2005;38(15):2633–2639. [Google Scholar]
- 26.Nam S.Y., Ricles L.M., Suggs L.J., Emelianov S.Y. Nonlinear photoacoustic signal increase from endocytosis of gold nanoparticles. Opt Lett. 2012;37:4708–4710. doi: 10.1364/ol.37.004708. [DOI] [PMC free article] [PubMed] [Google Scholar]
- 27.O’Connor M.T., Diebold G.J. Chemical amplification of optoacoustic signals. Nature. 1983;301:321–322. [Google Scholar]
- 28.Bonch-Bruevich A.M., Razumova T.K., Starobogatov I.O. Zh Prikl Spektroskopii. 1982;37:981. [Russian] [Google Scholar]
- 29.Danielli A., Favazza C.P., Maslov K., Wang L.V. Picosecond absorption relaxation measured with nanosecond laser photoacoustics. Appl Phys Lett. 2010;97(16):163701. doi: 10.1063/1.3500820. [DOI] [PMC free article] [PubMed] [Google Scholar]
- 30.Abbott A. Cancer: the root of the problem. Nature. 2006;442:742–743. doi: 10.1038/442742a. [DOI] [PubMed] [Google Scholar]
- 31.Yu M., Stott S., Toner M., Maheswaran S., Haber D.A. Circulating tumor cells: approaches to isolation and characterization. J Cell Biol. 2011;192:373–382. doi: 10.1083/jcb.201010021. [review] [DOI] [PMC free article] [PubMed] [Google Scholar]
- 32.Weight R.M., Viator J.A., Dale P.S., Caldwell C.W., Lisle A.E. Photoacoustic detection of metastatic melanoma cells in the human circulatory system. Opt Lett. 2006;31:2998–3000. doi: 10.1364/ol.31.002998. [DOI] [PubMed] [Google Scholar]
- 33.Mocellin S., Hoon D., Ambrosi A., Nitti D., Rossi C.R. The prognostic value of circulating tumor cells in patients with melanoma: a systematic review and meta-analysis. Clin Cancer Res. 2006;12:4605–4613. doi: 10.1158/1078-0432.CCR-06-0823. [DOI] [PubMed] [Google Scholar]
- 34.Alix-Panabieres C., Pantel K. Circulating tumor cells: liquid biopsy of cancer. Clin Chem. 2013;59:110–118. doi: 10.1373/clinchem.2012.194258. [DOI] [PubMed] [Google Scholar]
- 35.Clawson G.A., Kimchi E., Patrick S.D., Xin P., Harouaka R., Zheng S. Circulating tumor cells in melanoma patients. PLoS ONE. 2012;7:e41052. doi: 10.1371/journal.pone.0041052. [DOI] [PMC free article] [PubMed] [Google Scholar]
- 36.Nedosekin D.A., Sarimollaoglu M., Ye J.H., Galanzha E.I., Zharov V.P. In vivo ultra-fast photoacoustic flow cytometry of circulating human melanoma cells using near-infrared high-pulse rate lasers. Cytometry A. 2011;79:825–833. doi: 10.1002/cyto.a.21102. [DOI] [PMC free article] [PubMed] [Google Scholar]
- 37.Letfullin R.R., Joenathan C., George T.F., Zharov V.P. Laser-induced explosion of gold nanoparticles: potential role for nanophotothermolysis of cancer. Nanomedicine. 2006;1(4):473–480. doi: 10.2217/17435889.1.4.473. [DOI] [PubMed] [Google Scholar]
- 38.Gao L., Wang L., Li C., Garcia-Uribe A., Wang L.V. Photothermal bleaching in time-lapse photoacoustic microscopy. J Biophotonics. 2013;6:543–548. doi: 10.1002/jbio.201200184. [DOI] [PMC free article] [PubMed] [Google Scholar]
- 39.Nedosekin D.A., Galanzha E.I., Ayyadevara S., Shmookler Reis R.J., Zharov V.P. Photothermal confocal spectromicroscopy of multiple cellular chromophores and fluorophores. Biophys J. 2012;102(3):672–681. doi: 10.1016/j.bpj.2011.12.035. [DOI] [PMC free article] [PubMed] [Google Scholar]
- 40.Sarimollaoglu M., Nedosekin D.A., Simanovsky Y., Galanzha E.I., Zharov V.P. In vivo photoacoustic time-of-flight velocity measurement of single cells and nanoparticles. Opt Lett. 2011;36:4086–4088. doi: 10.1364/OL.36.004086. [DOI] [PMC free article] [PubMed] [Google Scholar]
- 41.Nedosekin D.A., Shashkov E.V., Galanzha E.I., Hennings L., Zharov V.P. Photothermal multispectral image cytometry for quantitative histology of nanoparticles and micrometastasis in intact, stained and selectively burned tissues. Cytometry A. 2010;77:1049–1058. doi: 10.1002/cyto.a.20977. [DOI] [PMC free article] [PubMed] [Google Scholar]
Associated Data
This section collects any data citations, data availability statements, or supplementary materials included in this article.